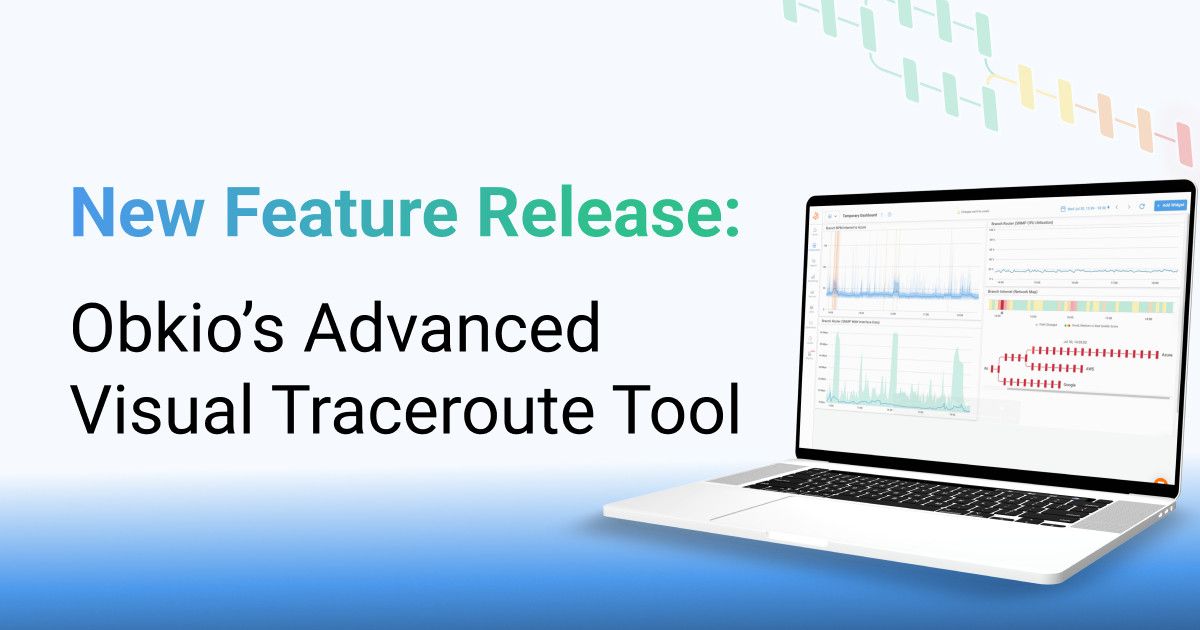
Obkio's Advanced Visual Traceroute Tool
Empower your team with a traceroute tool that accelerates diagnostics and uncovers the root cause of performance issues in seconds.

Introducing Obkio’s All-New
Visual Traceroute Tool
Fully integrated into our Network Performance Monitoring platform.
For years, traditional traceroutes have been a last-resort troubleshooting step. They’re hard to run in real time, rarely provide the right data when you need it, and offer little to no historical visibility.
On top of that, traceroutes on their own lack context for meaningful diagnostics. Results are often one-directional, which limits visibility, and command-line outputs add a layer of complexity when you’re trying to correlate them with other data sources.
Since not everything happens at the same moment, and data isn’t aggregated across the same time period, you’re often left piecing together fragments instead of seeing the full picture. So catching an intermittent issue with an intermittent tool is more luck than skill.
We knew there had to be a better way. That’s why we set out to reinvent traceroute from the ground up. What started with periodic, triggered, and live traceroutes, and eventually Obkio Vision, has now grown into a refactored, advanced Visual Traceroute tool.
Obkio's Traceroutes are visual, modern, continuous, and are designed to correlate data alongside Network Performance, SNMP (Device) and Application Performance data to identify and troubleshoot performance issues.
This feature reimagines and reinvents traditional Traceroutes to help IT teams truly understand network path performance and quickly identify the root cause of network issues.
Obkio's Visual Traceroute Is the Diagnotic Tool For Network Pros
Now, traceroutes live side-by-side with your network performance and SNMP monitoring data, right where you need them, exactly when something goes wrong.
The result? Faster diagnostics, simpler data, and a smarter way to troubleshoot network problems at the source.
The Visual Traceroute Tool is included free in all Obkio plans. Known internally as the “AHA moment” feature, it enables users to pinpoint the root cause of issues in seconds. By making it universally available, Obkio ensures every team can benefit from faster problem-solving and greater network visibility.
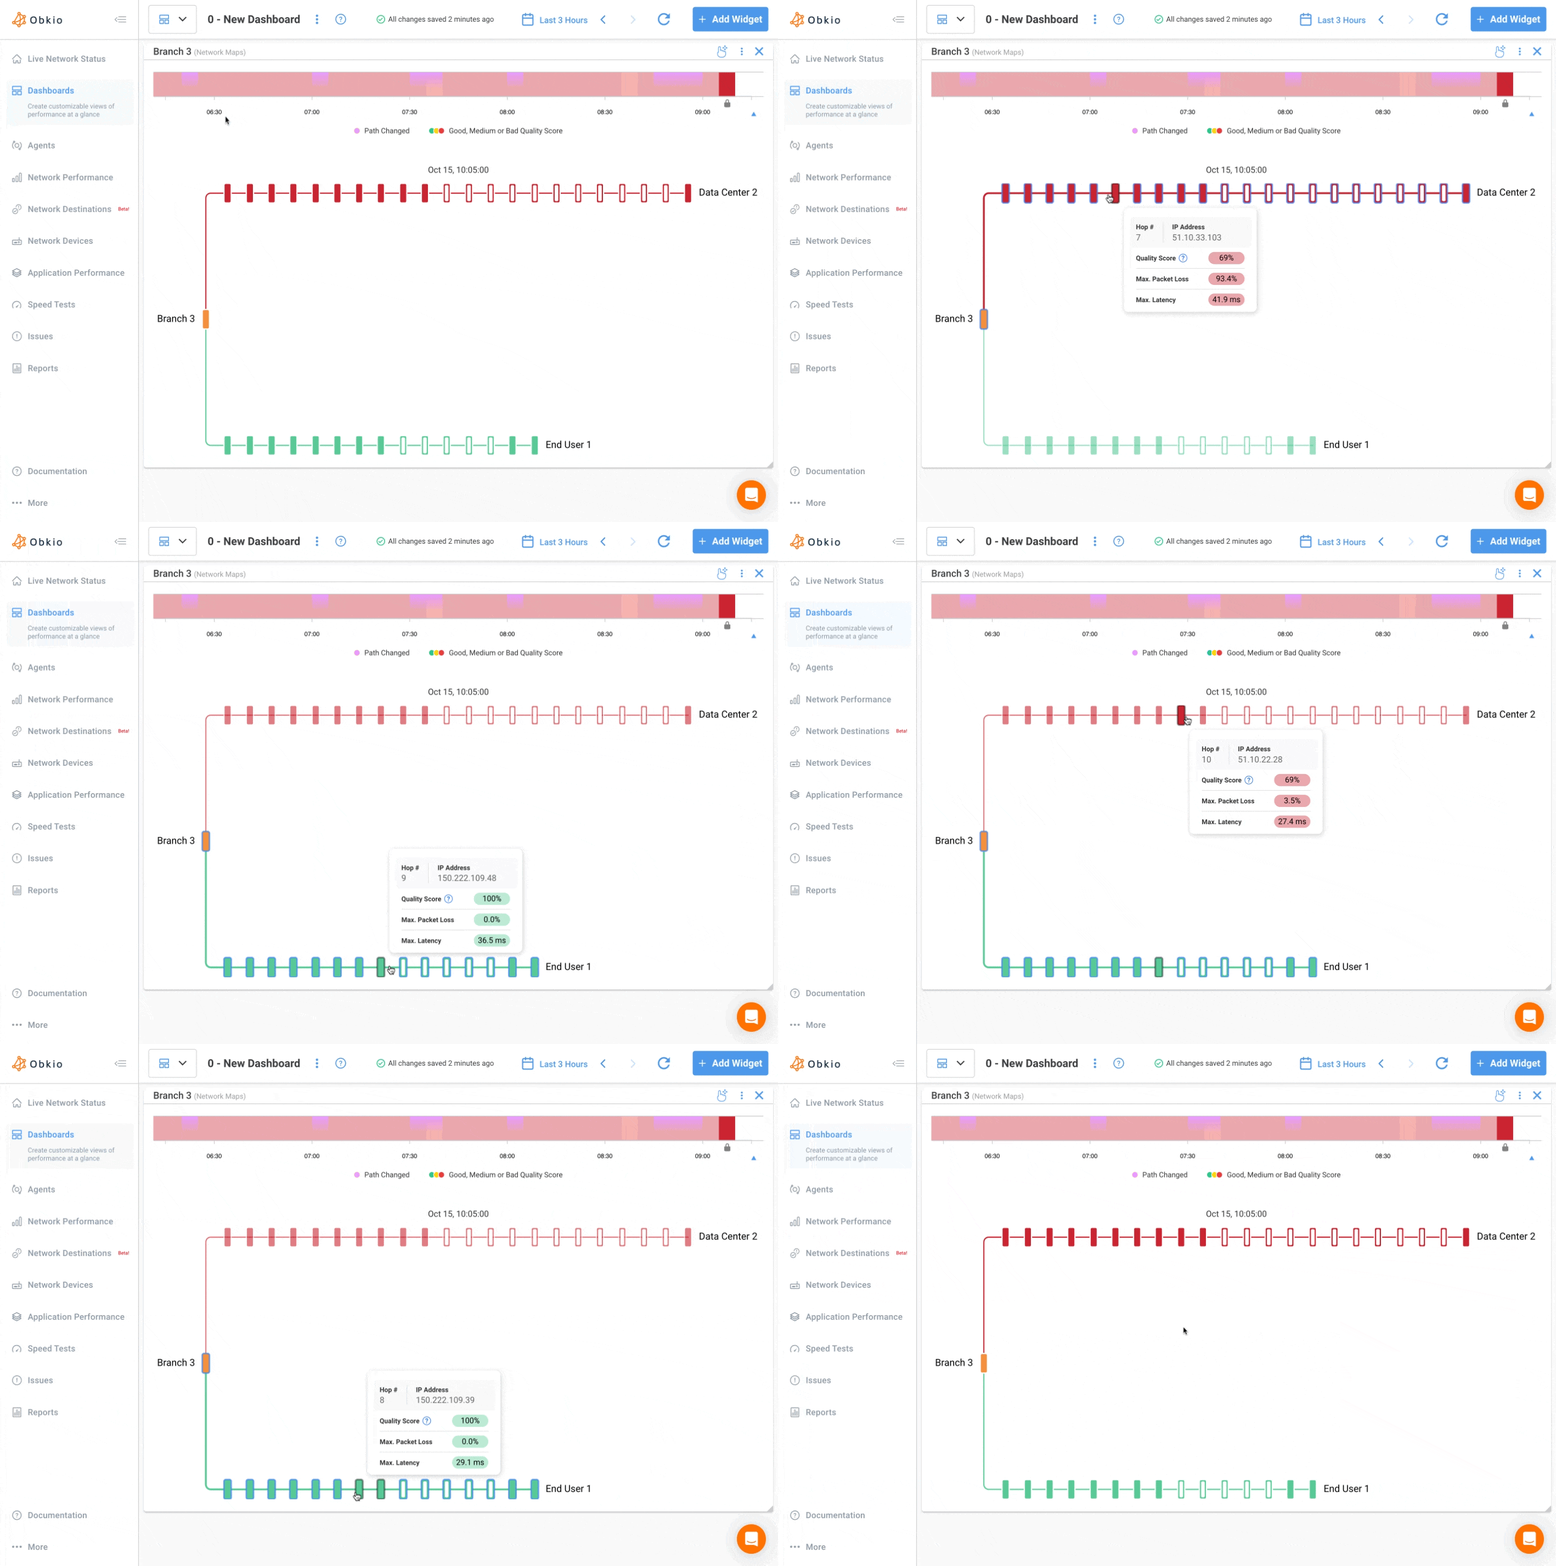
Responsive Network Path Map
Every hop, every metric, instantly visualized as interactive, colour-coded network maps.
Say goodbye to endless rows of hops. Obkio Visual Traceroutes include visual, responsive network maps enriched with per-hop insights and historical context. Integrated directly into the Obkio platform, the Network Path Map gives you a clear, colour-coded view of network health so you can spot issues instantly.
Key Features
Multi-Destination View: Visualize performance between one Obkio Agent and multiple destinations in a single, unified view.
Path & Hop Details: See exactly how traffic flows, with hop counts, related IPs, and alternate routes mapped out in a clean, colour-coded layout.
Per-Hop Insights: Metrics like latency, packet loss, and jitter are overlaid at each hop, helping you quickly identify where degradation begins.
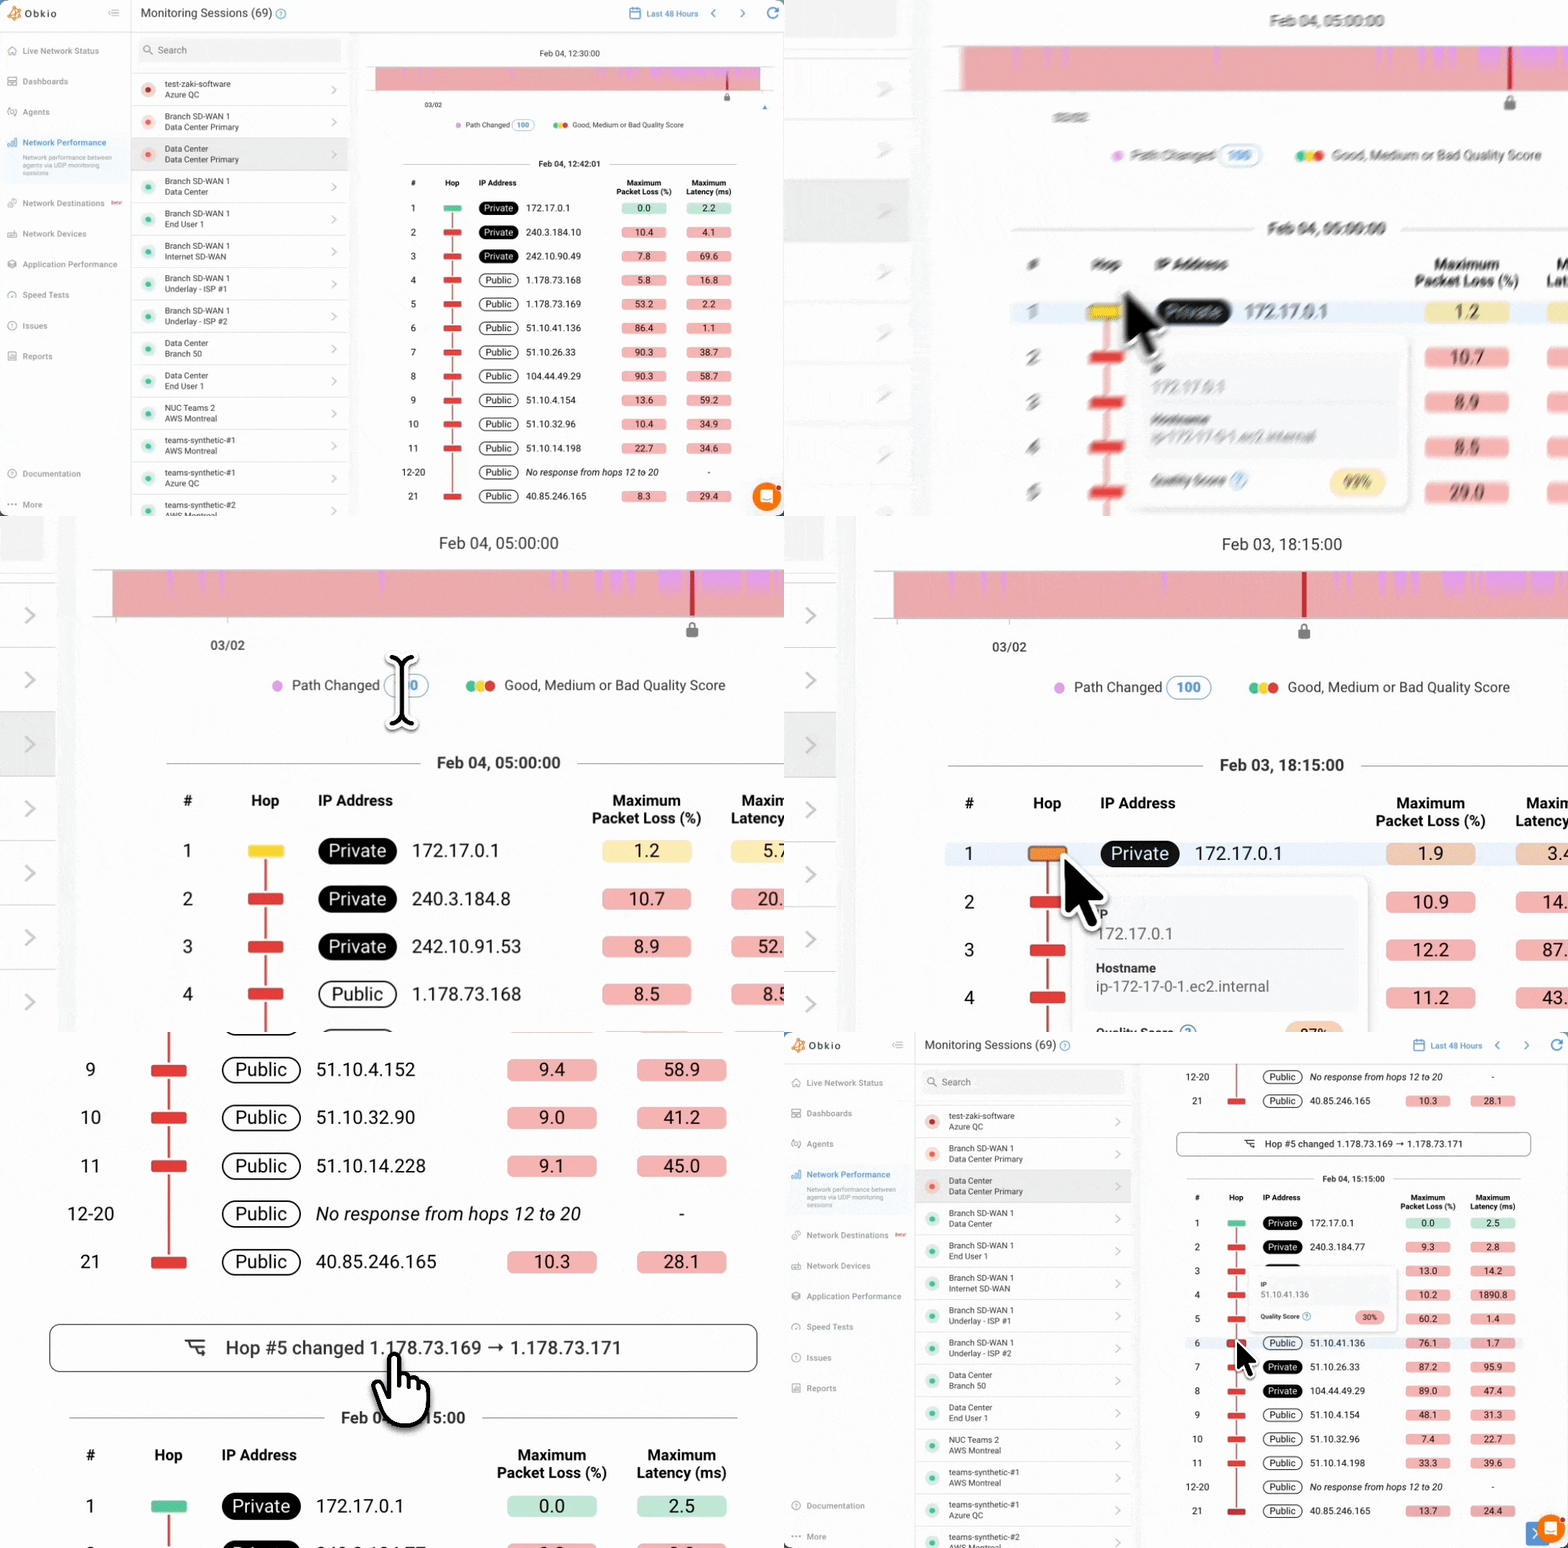
Interactive Tooltips: Hover over any hop to see IP addresses, quality scores, and hostnames (when available). Non-responsive hops are clearly flagged with a “No response from hop X” message.
Intuitive Visual Traceroute Timeline View
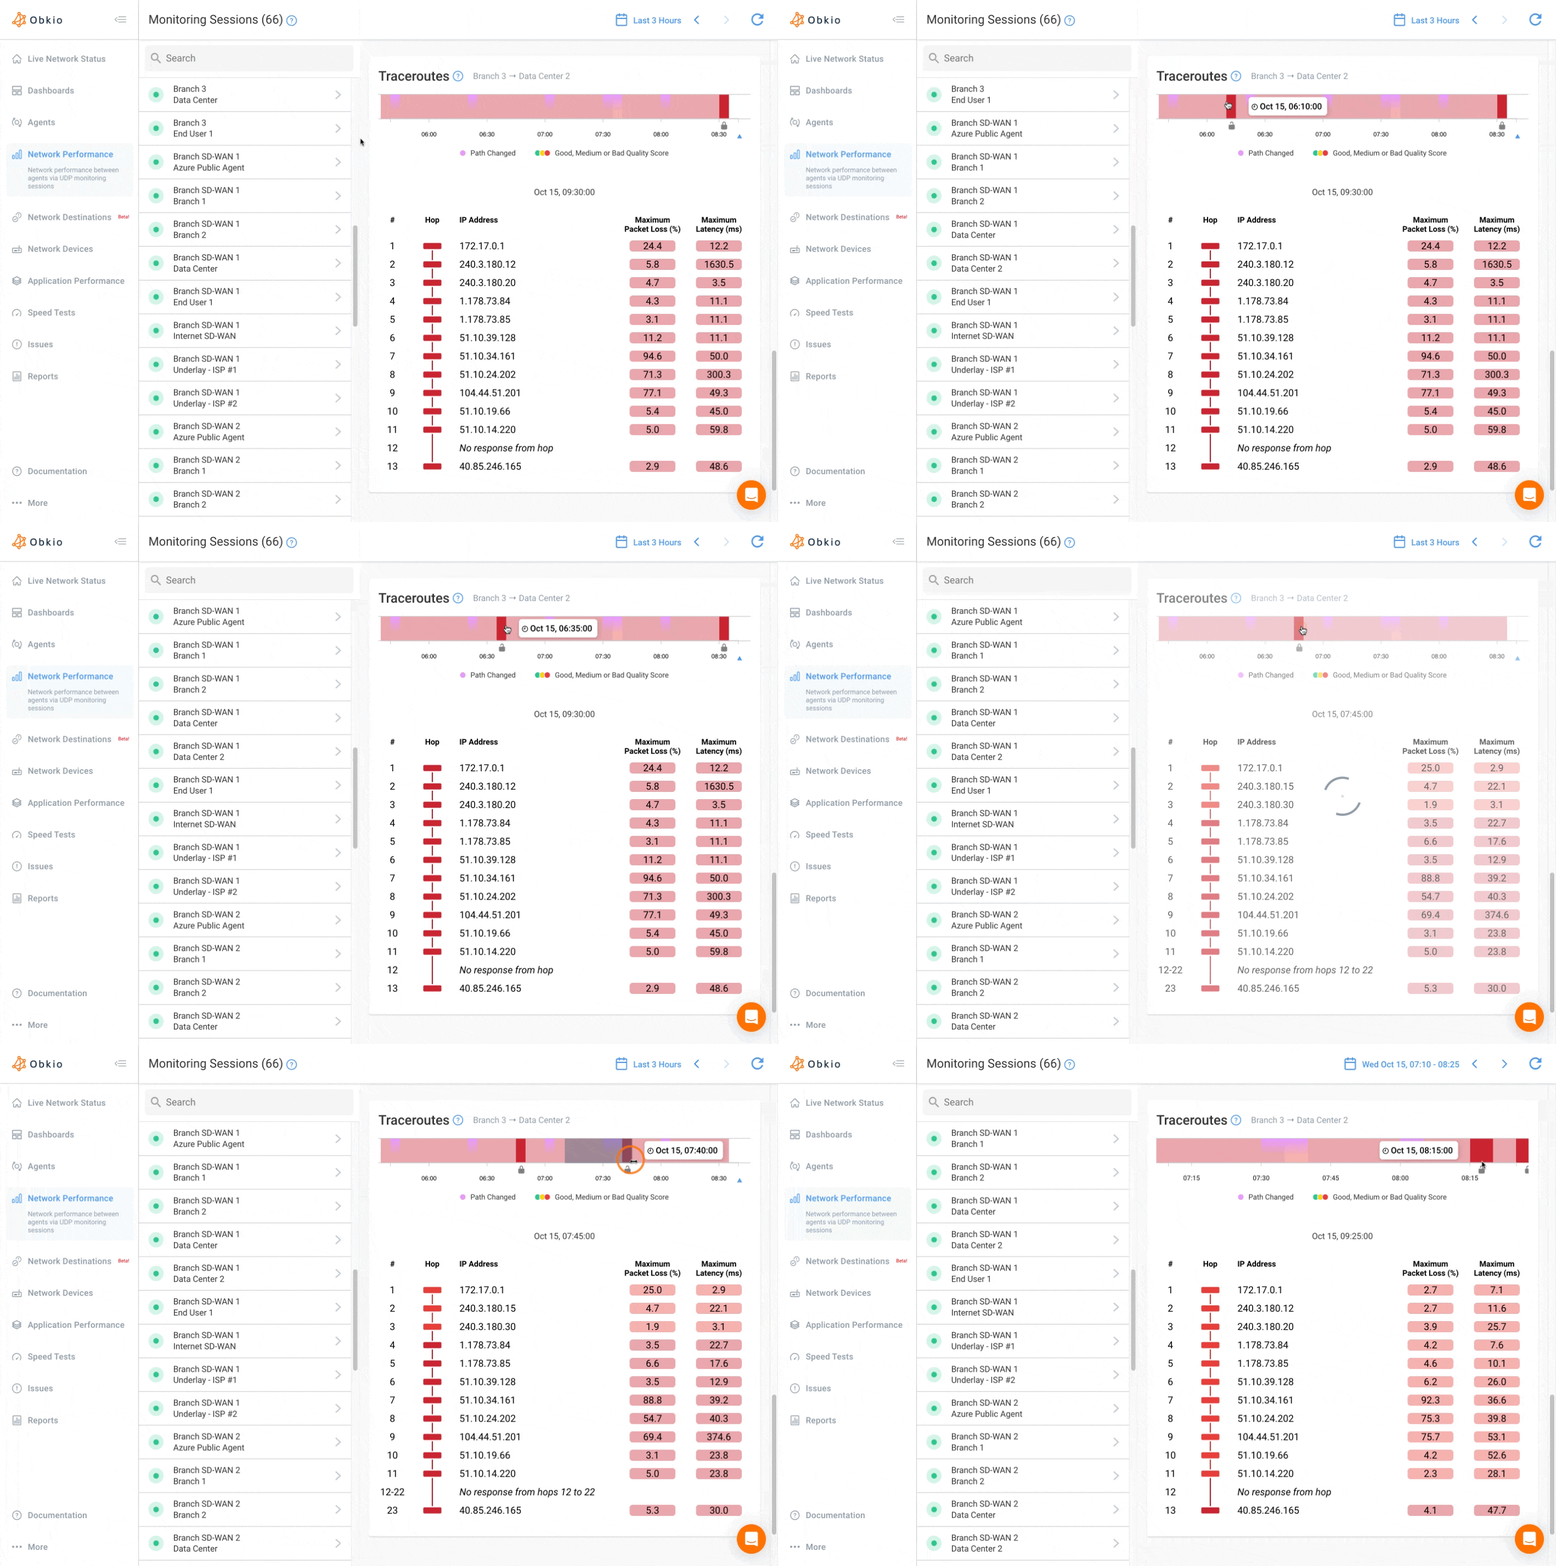
See when problems start and exactly where they unfold using the Visual Traceroute Timeline.
The timeline is your primary selector for exploring both Visual Traceroute details and Network Path performance. It uses colour codes to show you moments of performance degradation over time. Green means great performance, yellow indicated some performance degradation, and red means there is a definite performance issue.
Key Features
Performance & Path Over Time: Visualize network performance alongside path changes to see when and where routes diverge or degrade.
Unified Time Selector: Control time across dashboards and session pages with one timeline. Select the colour codes in the timeline (green, yellow, green) to instantly zoom in and open detailed Visual Traceroute and Path views from those moments in time.
Smart Aggregation: For longer timeframes, data is aggregated to surface the worst outcomes per interval, helping you spot critical periods when issues are present. Get a more detailed view with less aggregation and more granularity.
Zoom in to focus on problem periods, then drill down to see exactly how each hop changed over time. With timelines directly integrated into Obkio’s dashboards and session pages, you can investigate issues with context and precision.
Visual Traceroute Results Made Simple & Modern
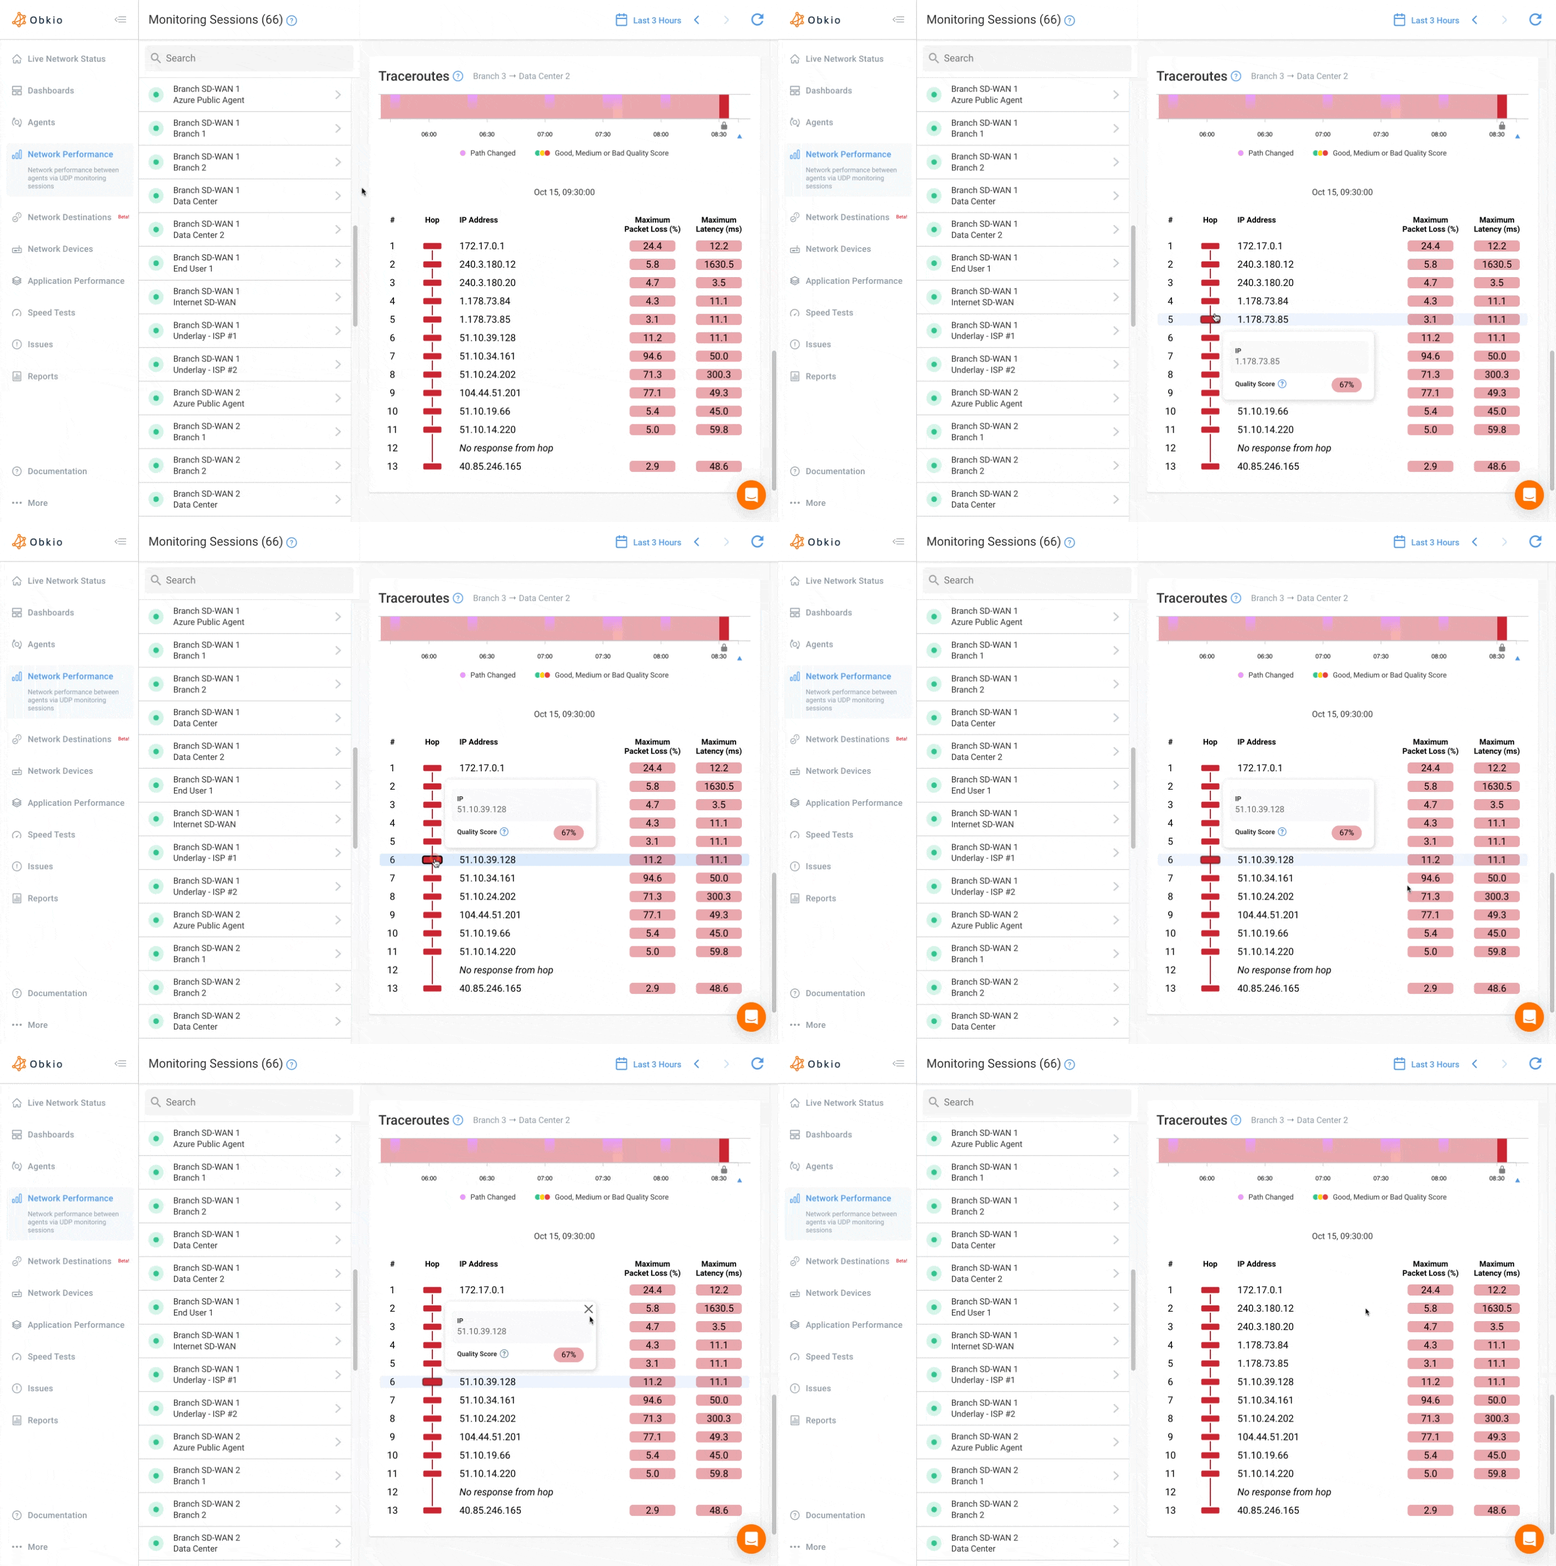
Say goodbye to walls of code. Obkio gives you Traceroute results, made simple and visual.
Traditional traceroute results are raw, text-heavy, and difficult to interpret, exactly when you need clarity the most. Obkio reinvents this experience by showing traceroute results side-by-side with your Network Map in a visual, intuitive format.
When you select hops on the network map or timeline, detailed results appear instantly. Each discovered path is clearly displayed, with hop counts, related IPs, and alternate routes neatly labelled. Metrics like latency, packet loss, and jitter are colour-coded, so spotting problems is simple and immediate.
Key Features
Visual Results, Not Code Dumps: Clear, colour-coded traceroute results replace the messy, text-based outputs of traditional tools.
Contextual Exploration: Drill into hop-by-hop results directly from the Network Map or Timeline View for a seamless troubleshooting workflow.
Comprehensive Path Data: View hop counts, IP addresses, hostnames, and alternate routes, all organized and labelled in one place.
Instant Issue Detection: Each hop on the network map is colour-coded by quality metrics like latency, jitter, packet loss, and MOS, so issues stand out instantly.
Obkio Automatically Runs Visual Traceroute For You
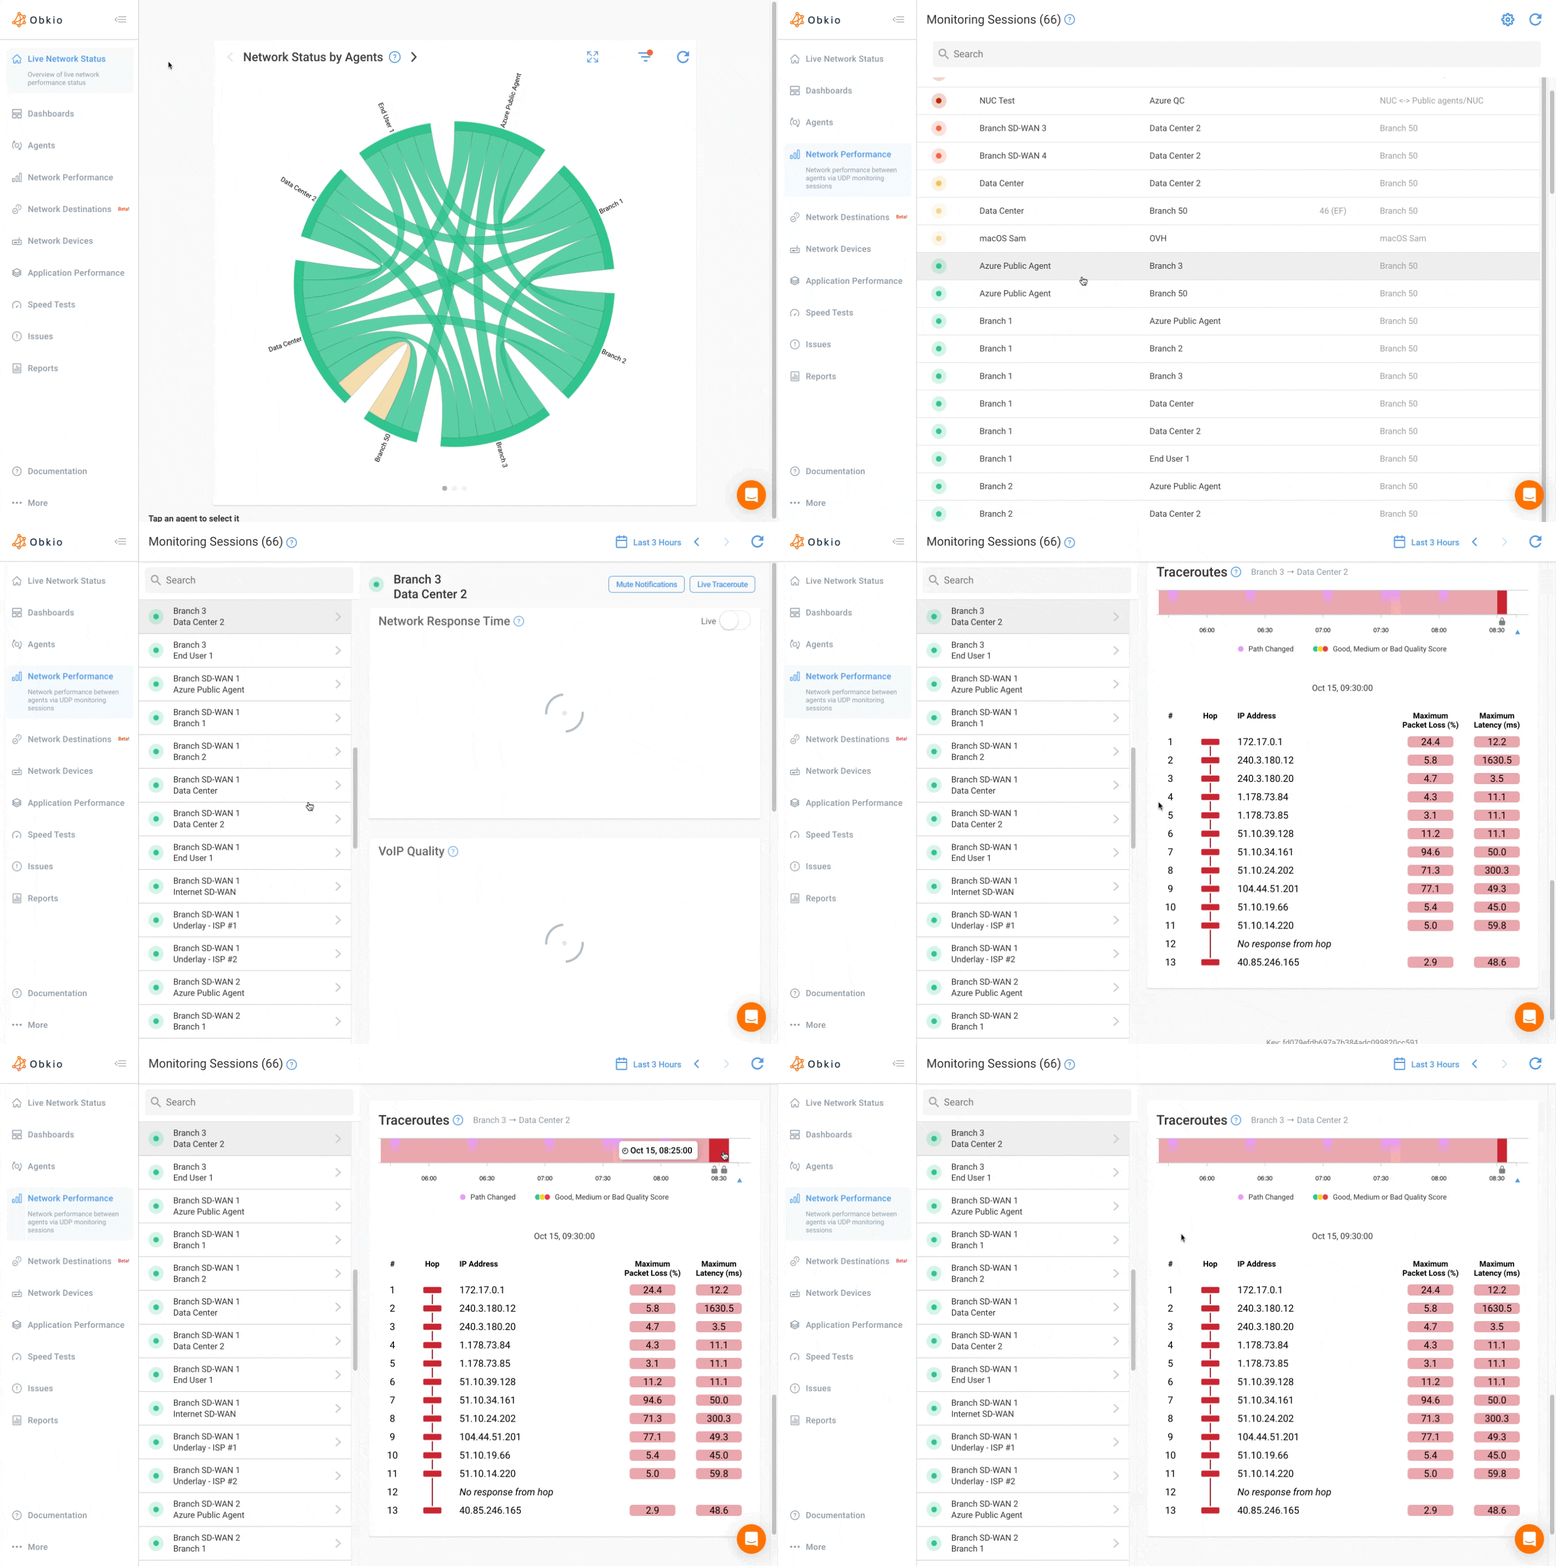
The best part of Obkio’s Visual Traceroute Tool is that there’s no configuration required. As soon as you sign up, follow the onboarding wizard, add your Agents, and create your Monitoring Sessions, Obkio automatically begins running traceroutes in the background. That means your diagnostic data is always ready when you need it, without any extra steps.
Traceroutes provide the top-down diagnostic view for your sessions. When you create a session with UDP traffic, you’ll see exactly when a problem occurs. And if you want to know where it’s happening, traceroutes are the fastest way to pinpoint the issue.
When you spot an anomaly, you can correlate the session data with the traceroute results right in your dashboard, giving you both the “what” and the “where” of the problem in a single view.
More Features for Faster Traceroute Troubleshooting
Obkio’s Visual Traceroute goes beyond visualization. It’s built with features that add depth, context, and automation to help you spot issues faster and understand them better.
One-Minute Granularity, Six Months of History
Forget the old three-hour limit. With up to six months of traceroute history (plan-dependent) and one-minute precision, you can look back in time, spot recurring patterns, and troubleshoot issues that would have otherwise gone unnoticed.
Network Destinations
Traceroute monitoring is no longer limited. Add and monitor external or internal IP destinations directly from your dashboard. No extra agents required. Correlate timelines, visualize paths, and soon, receive alerts for reachability and performance thresholds like latency, loss, and jitter.
Visual Traceroutes in Monitoring Sessions
Accessible in seconds. Visual Traceroutes are always running, always ready when you need them.
With Obkio, traceroutes don’t require setup or manual triggers; they run automatically the moment you create your Monitoring Sessions. That means the data is always there, ready for you when an issue strikes.
How to Access
- Sign in to the Obkio app.
- Navigate to the Network Performance tab.
- Open your Monitoring Sessions list. Your Visual Traceroutes are right there, alongside your performance metrics.
Because traceroutes are continuously collected in the background, you’ll never have to think about running one in the heat of troubleshooting again. The results are already waiting for you, fully integrated with your session data, maps, and timelines.
Visual Traceroutes as Dashboard Widgets
Add Visual Traceroutes to any dashboard as customizable widgets, right alongside network performance metrics, SNMP device data, and APM graphs. So you can correlate issues at a glance.
- Context in one place: Traceroutes, metrics, and device data side-by-side.
- Fully responsive: On narrow screens, the widget highlights key hop details; on short (vertical) screens, smooth scrolling lets you navigate the full path.
- Flexible layout: Resize and rearrange to fit your workflow; widgets auto-adapt to screen size.
How to add the widget
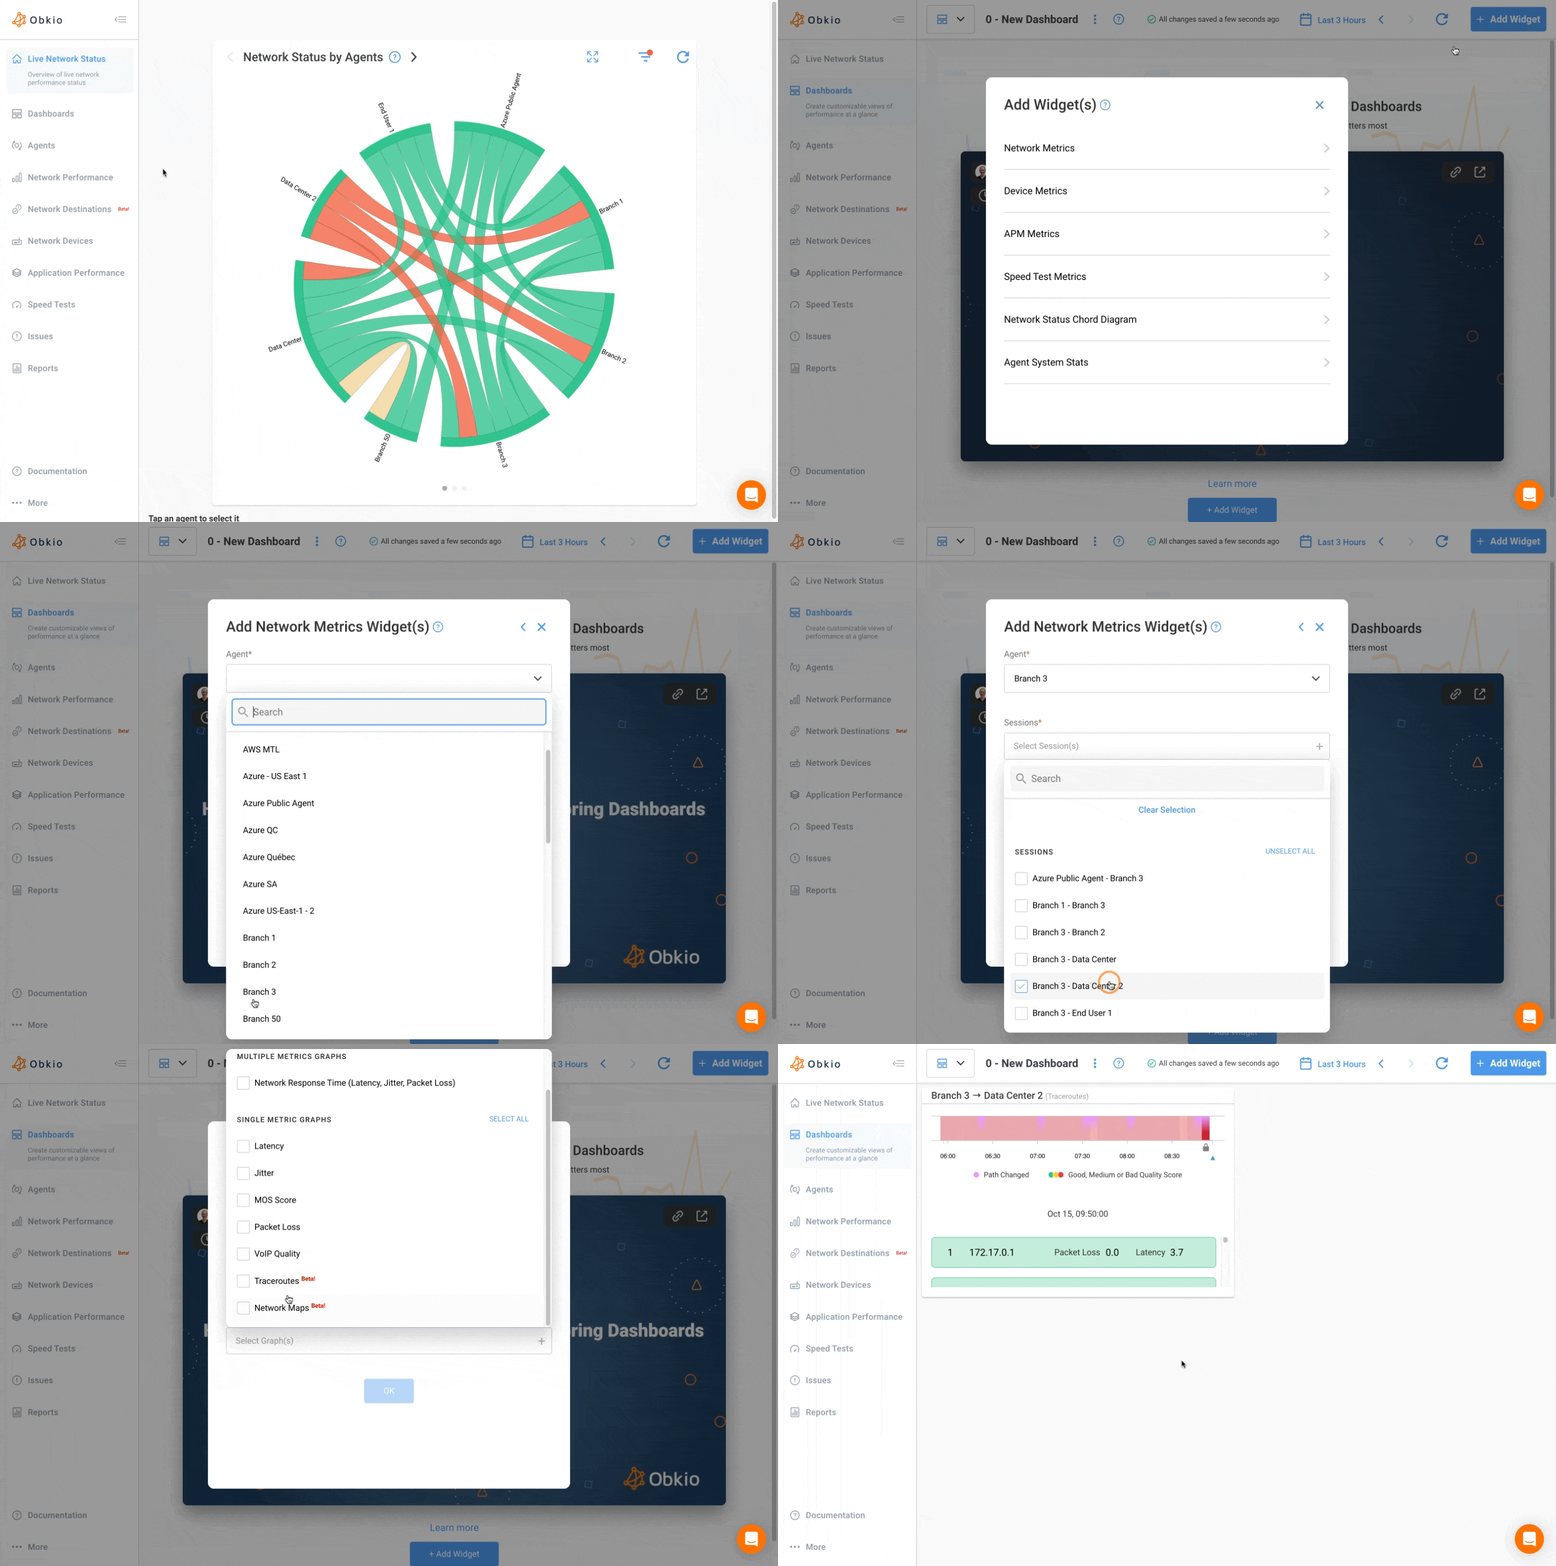
- Go to the Dashboards tab and open an existing dashboard (or create a new one).
- Click Add Widget.
- Under Network Metrics, select the Agent and Sessions you want to visualize.
- Choose Graph Type → Traceroutes to add the results widget.
- Or choose Graph Type → Network Map to add the visual path map widget.
- Save. The widget appears on your dashboard. Resize or arrange as needed.
With Visual Traceroute widgets, your dashboards become a single pane of glass for performance, paths, and root-cause diagnostics.
Visual Tracerotues in Network Destinations
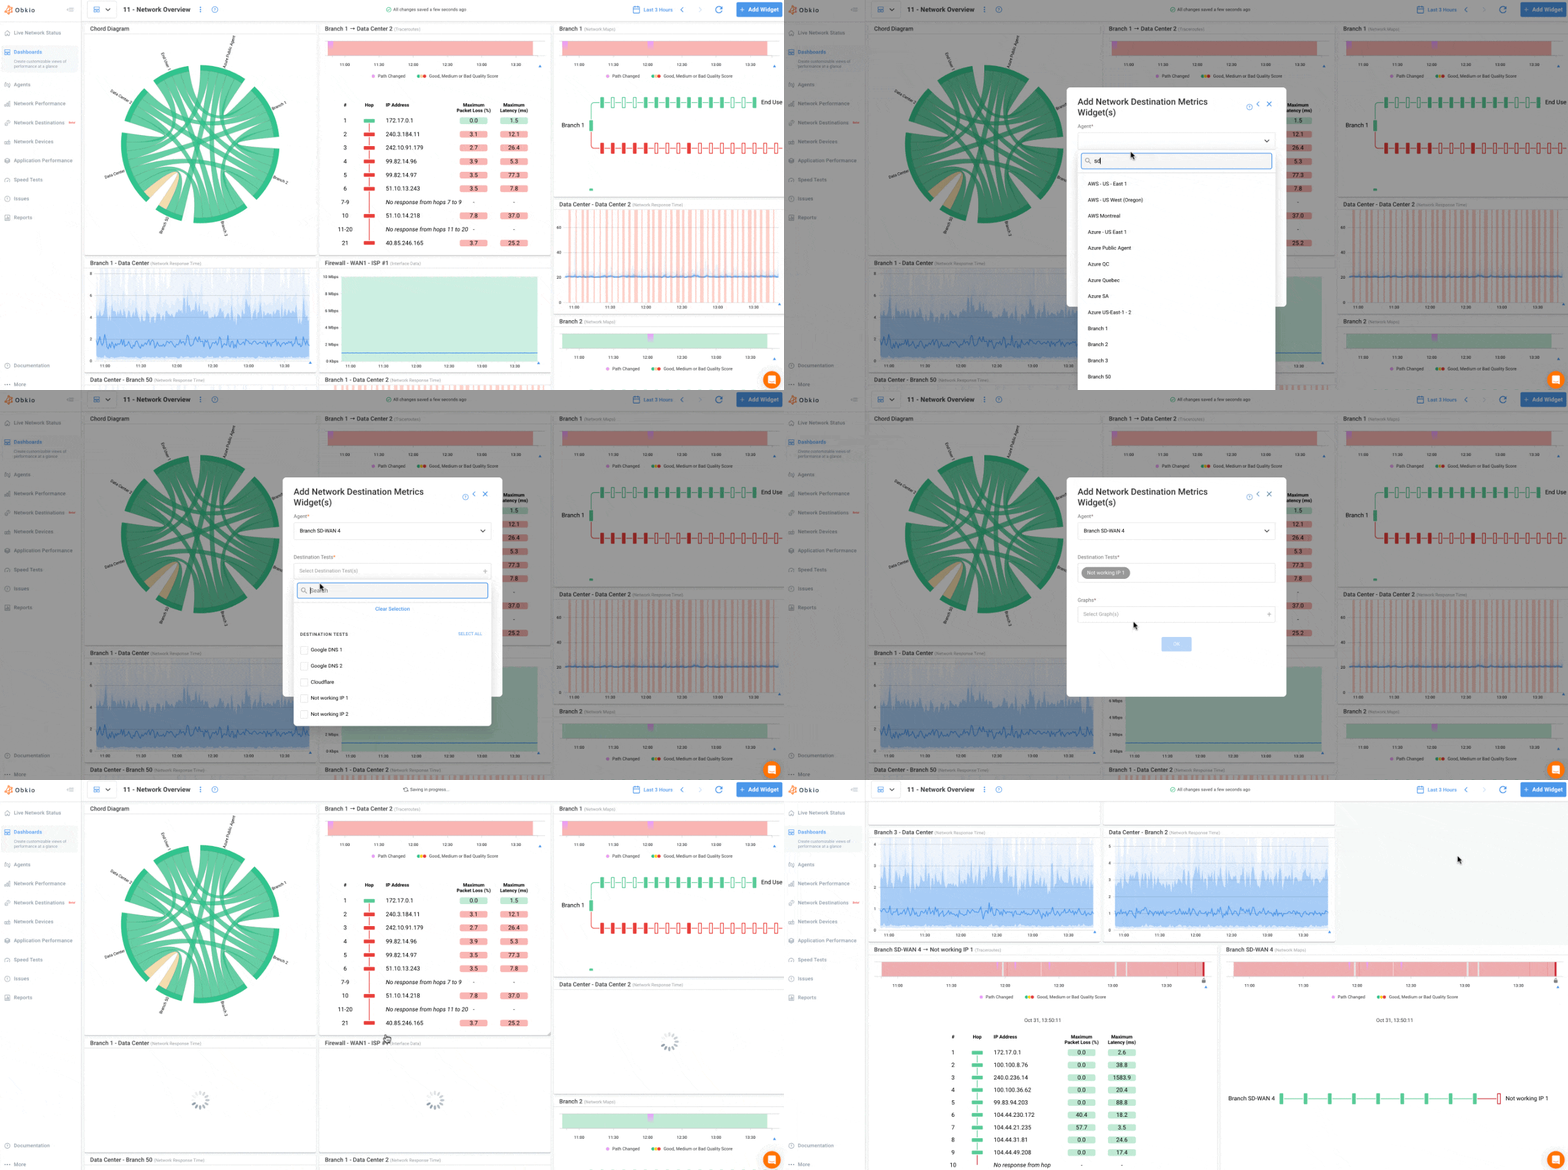
Obkio's Visual traceroutes also power our Network Destinations feature, enabling continuous ICMP monitoring of any IP address without requiring destination agents.
Instead of running one-time traceroutes, Network Destinations performs continuous traceroute monitoring to third-party services, APIs, SaaS applications, and IoT devices—visualizing the complete network path to these endpoints in real-time.
Every monitored destination generates live visual traceroutes that update continuously, allowing you to spot latency increases, packet loss, or routing changes the moment they occur. These visual traceroutes integrate seamlessly with your existing Obkio monitoring data, correlating destination performance with your broader network metrics for unified troubleshooting across both agent-monitored networks and agent-free endpoints.
Watch the Webinar: Introducing Obkio’s Visual Traceroute Feature

Join us as we introduce Obkio’s Advanced Visual Traceroute Tool, a complete reinvention of one of the most trusted troubleshooting tools in networking.
🔍 Introduction to Visual Traceroutes: Traditional traceroutes are limited, reactive, and often frustrating. We’ll break down why they fall short and how Obkio has transformed traceroute into a continuous, visual, and actionable diagnostic tool.
🚀 Discover Obkio’s Visual Traceroute Tool in Action: See how our traceroute engine changes the game.
🛠️ Live Troubleshooting Demo Using Visual Traceroutes: Watch a step-by-step walkthrough of troubleshooting a real-world network issue:
- Visualize the end-to-end path between agents and destinations
- Identify the exact hop or provider causing trouble
- Use timelines and maps to pinpoint recurring or intermittent problems
- Set up proactive alerts so issues don’t catch you off guard
Network Monitoring, Troubleshooting & Diagnostics:
Expert Insights and How To's
Welcome to our blog, where we address the common challenge of identifying network issues and provide you with effective solutions. At times, network problems can be elusive, causing disruptions, performance bottlenecks, and frustration. But fret not, because we are here to help. Our team of experts has extensive experience in tackling network issues head-on, and we are excited to share our knowledge and insights with you.

Frequently Asked Questions
Obkio's Visual Traceroute replaces text-based command-line outputs with interactive, color-coded network maps that show you exactly where network issues occur. Unlike traditional traceroutes that provide one-time snapshots, our tool runs continuously in the background, giving you up to six months of historical data with one-minute granularity. This means you can track down intermittent issues that would be nearly impossible to catch with traditional traceroute tools.
No configuration is required. As soon as you complete the onboarding wizard and create your Monitoring Sessions, Obkio automatically begins running traceroutes in the background. The data is always there when you need it, fully integrated with your session data, maps, and timelines.
Yes! The Visual Traceroute Tool is included free in all Obkio plans. We've made it universally available so every team can benefit from faster problem-solving and greater network visibility.
You can access up to six months of traceroute history depending on your selected plan, with precision down to one minute. This is a significant improvement over the old three-hour limit, allowing you to spot patterns and troubleshoot long-standing issues.
Yes! With Network Destinations (Extra IPs), you can add and monitor external or internal IP destinations directly from your dashboard without deploying additional agents. You can correlate timelines, visualize paths, and soon receive alerts for reachability and performance thresholds like latency, packet loss, and jitter.
Simply sign in to the Obkio app, navigate to the Network Performance tab, and open your Monitoring Sessions list. Your Visual Traceroutes are right there alongside your performance metrics. You can also add Visual Traceroute widgets to any dashboard for at-a-glance correlation with other network data.
Absolutely. You can add Visual Traceroute widgets to any dashboard, right alongside network performance metrics, SNMP device data, and APM graphs. The widgets are fully responsive and adapt to different screen sizes, making it easy to correlate issues at a glance.
For each hop along the network path, you can see key performance metrics including latency, packet loss, jitter, and MOS (Mean Opinion Score). These metrics are color-coded—green for great performance, yellow for some degradation, and red for definite issues—so you can spot problems instantly.
The timeline is your primary selector for exploring Visual Traceroute details and Network Path performance. It uses color codes to show moments of performance degradation over time. You can zoom in on problem periods, and when you select a time range, the entire page updates to show detailed hop-by-hop changes for that period.
Yes! While SNMP polling is still the best practice for network devices, you can use Extra IPs to monitor important non-network devices like servers, applications, and printers by running traceroutes directly to their IPs—no agents required.
Non-responsive hops are clearly flagged in the network map with a "No response from hop X" message. The tooltip will display this information when you hover over the hop, so you know exactly which points along the path aren't responding to ICMP.
If you're already an Obkio customer, the Visual Traceroute feature is automatically available in your account—no action needed. Just explore the new interface in your dashboard to see how it can help you spot, understand, and resolve network issues faster.
Start Your Free 14-Day Trial Now!
Get a free POC with Obkio's 14-day trial. Identify network problems & collect data to troubleshoot.
Start Now Book a Demo


