Table of Contents
Table of Contents
If you’ve spent any time managing networks, you know the switch is the backbone that keeps everything connected, but it’s easy to take them for granted until something breaks. Monitoring network switches isn’t just “nice to have”; it’s critical if you want to avoid those sudden outages that bring everything to a halt.
Network switch monitoring means keeping a close eye on how your switches are performing in real time, from their availability to traffic flow and overall health. The goal? Catch issues before they snowball into outages or degraded network performance.
From experience, two monitoring techniques stand out for getting the job done: SNMP (Simple Network Management Protocol) and Network Performance Monitoring (NPM) solutions. SNMP is the tried-and-true protocol used to pull key data directly from switches, while NPM tools take that raw data and turn it into clear, actionable insights.
Put them together, and you get a powerful setup that helps you spot problems early, optimize bandwidth, and keep your network running smoothly, saving you from firefighting when things go sideways.
Let’s start with the basics: A network switch is a device that connects multiple devices in a local network (think computers, printers, servers) and makes sure data gets to the right place quickly and efficiently. Unlike a hub, which blasts data everywhere, a switch is smarter: it sends data only where it’s supposed to go, reducing unnecessary traffic and keeping things running smoothly.

Now, network switch monitoring is about monitoring the performance of these switches to make sure they’re healthy and performing as expected. This means tracking things like whether the switch is up and running, how much traffic is flowing through each port, if there are any errors or failures, and how much of the switch’s resources (CPU, memory) are in use.
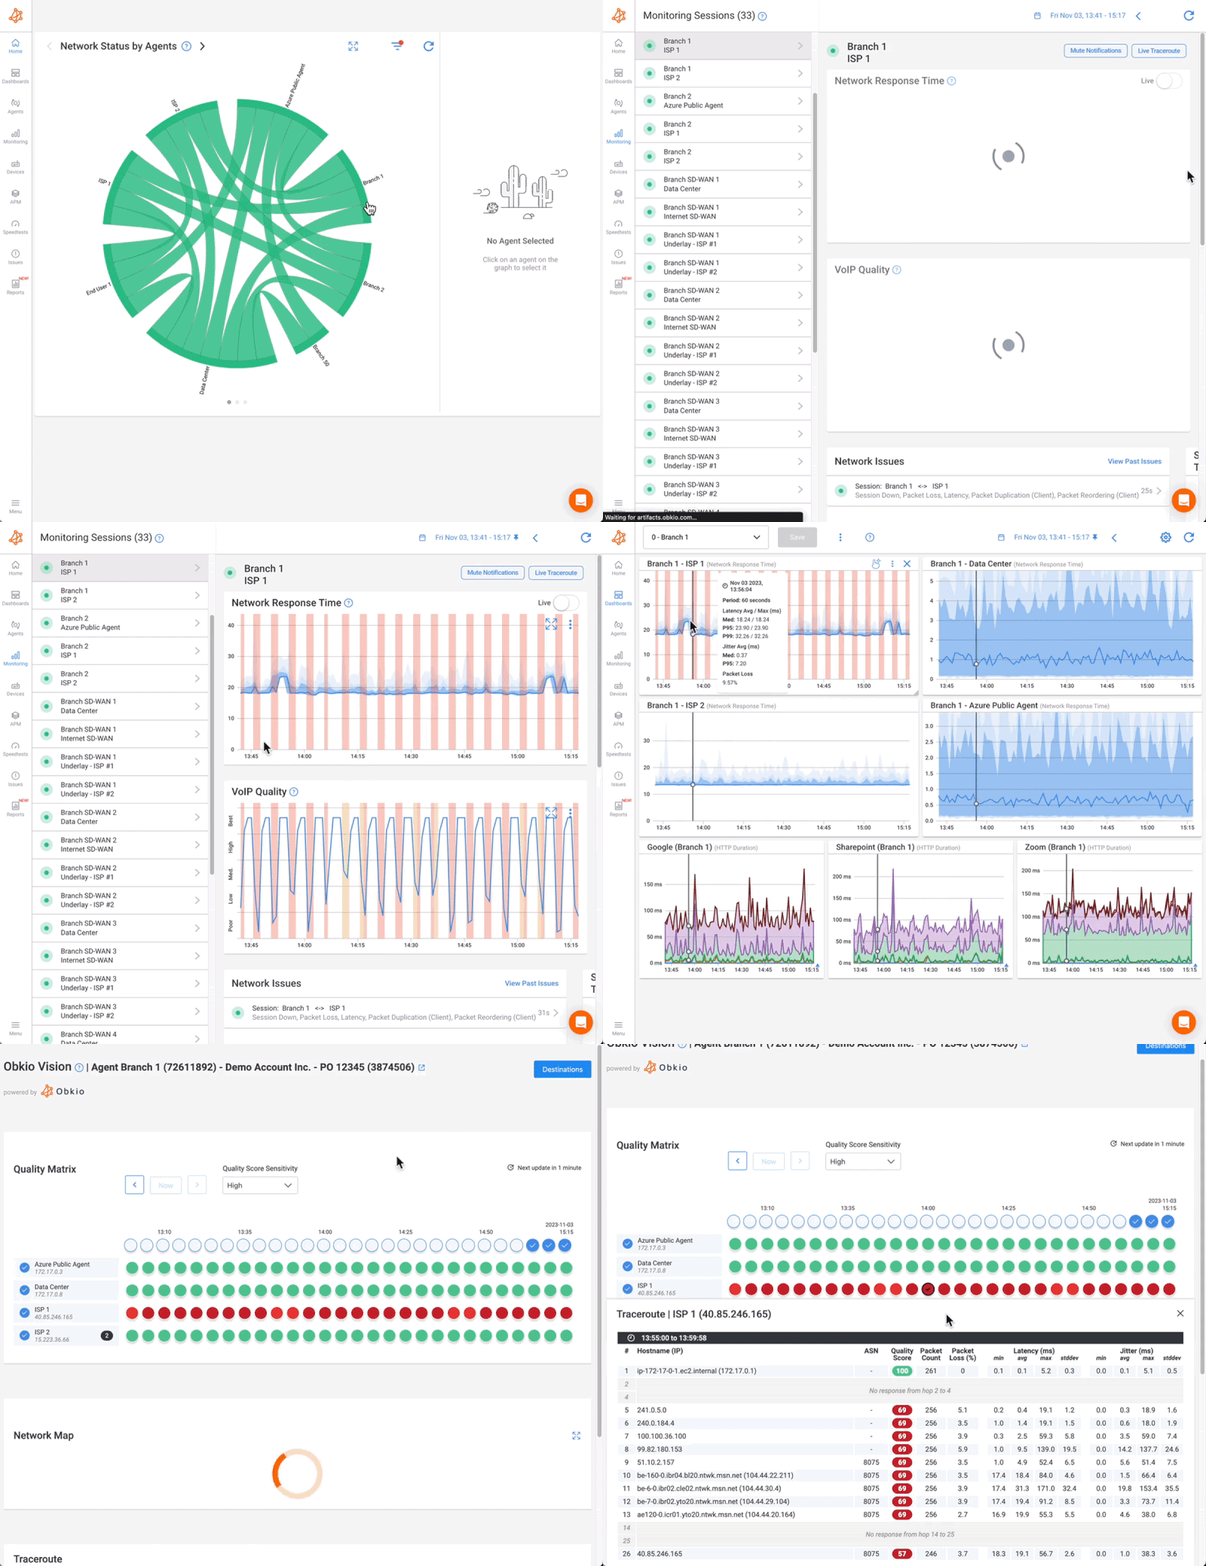
 Monitoring setup using Obkio's Network Monitoring Tool
Monitoring isn’t just a “set it and forget it” task. It’s continuous vigilance because switches are the gateways for all your network traffic. If a switch starts misbehaving, it can slow down or even knock out parts of your entire network. For IT teams, MSPs, or anyone managing large networks, switch monitoring is essential to keep everything humming without surprises.
You might think, “The switches are working fine, why bother monitoring them all the time?”
Once you’ve had a switch failure cause downtime or a traffic jam choke your network, you’ll see why monitoring is non-negotiable.
- Optimize the Performance of Switches: Switches handle tons of traffic daily. Monitoring helps you ensure data flows smoothly, avoiding bottlenecks and congestion that slow down users and applications.
- Proactively Troubleshoot Switch Issues: Instead of scrambling after a switch fails or a port goes down, monitoring lets you spot warning signs early (like rising error rates or CPU spikes) and fix problems before they hit production.
- Plan for an Increase in Network Switch Capacity Requirements: Network demands grow. By watching bandwidth and resource usage trends, you can plan hardware upgrades or bandwidth increases before you max out your switches.
- Security Monitoring Via Network Switches: Switches can reveal suspicious activity, unexpected traffic spikes, unknown devices connecting, or abnormal port behaviour. Monitoring helps catch these security red flags early.
In short: Monitoring your switches isn’t just about uptime. It’s about running a network that’s efficient, secure, and ready to scale without surprises.
SNMP has been around since the late ‘80s and hasn’t lost its relevance because it’s simple, lightweight, and widely supported by nearly every vendor out there. Here’s how it works: switches have something called MIBs (Management Information Bases), which are like databases of status and stats. Each piece of data you want (say, CPU usage or port status) has a unique identifier called an OID.
Your monitoring tool polls the switch at regular intervals, asking for these OIDs, or the switch can send “traps,” which are alerts triggered by specific events like a port going down. This way, you get real-time or near-real-time visibility into switch health and performance.

1. SNMP Agent on the Switch: The switch runs an SNMP agent that stores performance data (CPU load, interface stats, errors) in its MIB.
2. Monitoring Tool Sends a Request: The SNMP manager (your NPM tool) sends an SNMP GET request to the switch for specific OIDs (Object Identifiers).
3. Switch Responds with Data: The SNMP agent returns the requested performance metrics to the monitoring tool.
4. Regular Polling: This process repeats at set intervals (e.g., every 1–5 minutes) to gather up-to-date data.
5. SNMP Traps: If an event occurs (like a port going down), the switch sends an unsolicited TRAP message to the monitoring tool for immediate alerting.
6. Data Analysis & Alerts: The monitoring tool stores and analyzes the collected data to detect performance issues and trigger alerts when thresholds are exceeded.
Why SNMP (Simple Network Management Protocol)? It’s vendor-neutral, meaning it works with Cisco, Juniper, Arista, and even budget brands like TP-Link or Ubiquiti. It uses minimal resources on your devices, so it won’t slow down your switches. Plus, it supports real-time alerts so you’re not stuck checking logs manually.
That said, SNMP isn’t perfect. Older versions (v1 and v2) have security weaknesses, no encryption, which can be risky. SNMPv3 fixes that with authentication and encryption, so if you’re serious about security, use v3.
Another thing: SNMP gives you lots of useful data, but it’s not always super granular. For deeper traffic analysis, you’ll want to pair it with specialized Network Performance Monitoring tools.
Learn about what SNMP monitoring is & how to use it to monitor performance of networking devices like firewalls, routers, switches and wifi access points.
Learn more

SNMP gives you the “what” — the status and health of your switches, but to understand the “how” and “why” behind network traffic and performance, you need Network Performance Monitoring (NPM).
Network Performance Monitoring digs deeper by analyzing traffic flows, bandwidth usage, latency, and packet loss across your switches. They often use flow protocols like NetFlow or sFlow to capture detailed info about what devices are talking to each other, how much data they’re sending, and whether anything unusual is happening.
Beyond device metrics, NPM is also about understanding how your network switches impact the performance of your network as a whole — including end-user experience. It helps you see if issues beyond just device-related health (like CPU, memory, or bandwidth) are affecting your switches’ performance, such as upstream network congestion, application-level problems, or poor routing paths.

1. Centralize Your Performance Data: The NPM tool acts as the SNMP manager, polling switches for metrics and storing the results in one place. It turns raw OID values from SNMP into easy-to-read graphs, dashboards, and heatmaps so you can see performance trends at a glance.
2. Alerting of Switch Issues: Instead of manually checking SNMP stats, the NPM tool watches them for you, comparing values against thresholds and sending alerts when something’s wrong.
3. Beyond Device Metrics: NPM isn’t just about switch CPU, memory, or bandwidth. It’s about understanding how network switches affect the performance of your entire network, including end-user experience. It also helps you identify whether issues outside of the switch itself (such as WAN congestion, application delays, or routing problems) are impacting switch performance.
4. Correlating SNMP with Other Data: While SNMP tracks device health, NPM also integrates traffic flow data (NetFlow, sFlow), application performance metrics, and synthetic tests, giving a full view of network performance beyond just the switch’s internal stats.
With NPM, you can spot traffic spikes that could indicate congestion, track bandwidth hogs, or uncover latency problems that impact real-time apps like VoIP or video conferencing.
Many Network Performance Monitoring Tools integrate SNMP polling with advanced network analysis to give you a full picture of your network switch performance.
Together, SNMP and NPM give you both the health check and the traffic insights you need to keep your switches and your network running like a well-oiled machine.
Reliable switch monitoring doesn’t have to be complicated — but if you set it up properly from day one, you’ll save yourself countless hours of chasing down issues later.
Obkio simplifies this process by combining Network Performance Monitoring (NPM) with SNMP device monitoring in a single, streamlined platform. This gives you both a detailed view of device health and a complete picture of how your network is actually performing.
Traditional monitoring approaches have leaned heavily on SNMP polling to collect data like CPU load, memory usage, or temperature. While important, this method often triggers a flood of alerts whenever thresholds are crossed — many of them false positives. Over time, this “alert fatigue” makes it harder to notice the issues that truly matter.
Obkio changes that. Instead of focusing only on infrastructure stats, it monitors network quality metrics such as latency, jitter, and packet loss through synthetic testing and performance measurements. You only get alerts when real performance problems occur, so your attention is spent where it counts.
SNMP monitoring is still part of the equation, acting as a powerful tool for pinpointing switch-level or hardware-specific problems. Paired with NPM insights, it helps you determine whether slowdowns stem from the device itself or from other areas in your network, giving you a complete, actionable view of your network health.
Here’s a practical, step-by-step guide to help you deploy Obkio’s effective network switch monitoring solution:
Before you can monitor anything, you need the right tool in place.
- Start with a Free Trial: Most tools, including Obkio, offer free trials. Set it up in your environment and see if it fits your needs. Testing early saves headaches down the road.

- 14-day free trial of all premium features
- Deploy in just 10 minutes
- Monitor performance in all key network locations
- Measure real-time network metrics
- Identify and troubleshoot live network problems

Install Monitoring Agents: Deploy monitoring agents in key network locations, your data centers, main office, branch sites, wherever your switches live. These agents measure performance from multiple points and help pinpoint where issues arise.
Segment Monitoring by Location or Switch Type: If you manage multiple switches across sites or different models, organize monitoring by location or switch category. This keeps your data clean and actionable.
Use Both Local and Public Agents: Local agents monitor internal switch performance, while public agents (in cloud providers like AWS or Azure) provide external benchmarks for comparison.
Your network switch monitoring software needs SNMP data from the switch to track performance.
Enable SNMP: Log in to your switch via CLI or web UI and enable the SNMP service. It’s usually off by default.
Configure SNMP Credentials: For SNMP v1/v2c, set a community string (essentially a read-only password). For SNMP v3, configure user credentials with authentication and encryption, strongly recommended for security.
Allow SNMP Through Firewalls: Ensure SNMP traffic is allowed between your monitoring servers and switches.
Add Switch as SNMP Device: In your monitoring tool’s dashboard, add each switch by its IP address and provide SNMP credentials.
Select Metrics to Track: Choose key metrics like interface bandwidth, CPU, memory usage, errors, and port statuses to get a comprehensive view.
Start Polling: Obkio tool will begin querying switches regularly to collect real-time and historical data.

Once your monitoring solution is in place, you’ll need to focus on the metrics that truly reflect your switch’s performance and overall network health. Measuring these metrics will help you spot early warning signs that your network switch may be underperforming, so you can troubleshoot faster and optimize performance.

1. Bandwidth Utilization: The amount of data passing through each switch port over time. Consistently high utilization can cause congestion, leading to slow applications and dropped connections. Conversely, extremely low utilization on a critical port may indicate underuse or a misconfiguration.
What to look for:
- Identify top talkers (devices or applications using the most bandwidth).
- Watch for sustained usage above 80–90% capacity.
- Track peak vs. average utilization to see if congestion is occasional or ongoing.
2. CPU & Memory Usage: The processing and memory load on your switch’s hardware. A switch under heavy load may process packets more slowly or fail to handle additional connections, affecting network stability.
What to look for:
- Spikes in CPU usage during peak hours.
- Gradual increases in memory usage, which could indicate a leak or misconfigured features (e.g., excessive logging).
- Correlation between CPU/memory strain and performance complaints.
3. Interface Status & Errors: The operational state and quality of each port. Ports going down unexpectedly, network flapping (frequent up/down changes), or generating high error counts can point to faulty hardware, bad cabling, or duplex mismatches.
What to look for:
- CRC errors and collisions (often linked to cabling or speed mismatches).
- Frequent interface resets or port flaps.
- Disabled or administratively down ports that should be active.
4. Latency & Packet Loss: The delay in packet delivery (latency) and the percentage of packets that never reach their destination (packet loss). Even small delays or losses can disrupt real-time applications like VoIP, video conferencing, or online gaming.
What to look for:
- Consistent latency spikes between specific devices or VLANs.
- Packet loss patterns that align with peak traffic times.
- Correlation between latency issues and high CPU/memory usage or bandwidth saturation.
5. Device Availability & Uptime: The ability of the switch — and its ports — to remain operational. Even a short outage on a core switch can impact dozens or hundreds of users.
What to look for:
- Immediate alerts for switch or port downtime.
- Uptime trends for identifying unstable hardware.
- Redundant switch pairs where one device fails more often than the other.
💡 Pro Tip: Don’t just monitor these metrics in isolation — correlate them. For example, high CPU usage combined with rising latency often signals a processing bottleneck, while increased CRC errors and packet loss can point to failing cables or ports.

Don’t wait for users to complain:
Identify the metrics that, when they cross certain limits, indicate a real problem. Common examples include:
CPU Usage – Alert if CPU usage stays above 85% for more than 5 minutes, which could signal the switch is overloaded.
Memory Usage – Alert when memory usage exceeds 90%, preventing crashes or slow packet processing.
Bandwidth Saturation – Trigger alerts when link utilization is consistently above 80–90% on a port or trunk link.
Port Errors – Alert on a high number of CRC errors, packet drops, or interface resets, which could indicate bad cables, failing hardware, or duplex mismatches.
Temperature – Trigger warnings when temperature exceeds manufacturer-recommended limits (e.g., over 75°C for many models).
Device Uptime – Alert immediately if a core switch or critical port goes offline.
When thresholds are breached, get immediate alerts to investigate before issues impact users.
Scenario 1: CPU usage hits 88% for 10 minutes on a core switch → Alert triggers → Engineer checks for a broadcast storm or excessive spanning tree recalculations.
Scenario 2: Interface errors spike on a port connecting to a server → Alert triggers → Network team finds and replaces a faulty cable.
Scenario 3: WAN uplink bandwidth hits 95% utilization → Alert triggers → Traffic analysis shows a backup process running during business hours, which is rescheduled to off-hours.
Diagnose Intermittent Issues: Spot trends or recurring problems that only show up over time.
Plan Capacity: Track usage patterns to forecast when you’ll need to upgrade switches or bandwidth.
Validate SLAs: Use data to confirm if service providers are meeting their SLAs commitments.
Switch monitoring alone gives you device-level insights but real power comes from combining it with end-to-end network performance data.
Scenario 1: Latency in Cloud Apps
- Switch monitoring shows rising latency on uplink ports.
- NPM tool shows matching delays in Office 365 response times.
- Conclusion: The problem is likely upstream bandwidth saturation, not the cloud provider.
Scenario 2: High Packet Loss on a VLAN
- Switch monitoring detects CRC errors and packet loss on multiple ports in VLAN 20. End-to-end performance data shows slow database queries from remote offices.
- Conclusion: Faulty cabling between the core switch and distribution layer is impacting application performance.
Scenario 3: Voice Quality Issues
Switch port monitoring shows CPU usage spiking during large file transfers.
- VoIP monitoring detects increased jitter and dropped calls.
- Conclusion: QoS policies need adjusting to prioritize voice traffic.
This holistic view speeds troubleshooting and ensures your network runs smoothly from core to edge. When you correlate device-level switch metrics with full network performance data, you get:
- Faster root cause analysis.
- Fewer “finger-pointing” incidents between teams.
- More informed capacity planning.
- A smoother, more predictable end-user experience — from the network core to the edge.
The good news? If your switch supports SNMP (and most modern switches do) chances are it will work seamlessly with Obkio and similar NPM tools.
Here’s a quick rundown of common brands and models that Obkio supports out of the box:
Cisco – The industry leader, from SMB Catalyst switches to high-end Nexus series for large enterprises.
Juniper Networks – Known for robust, high-performance EX and QFX series switches.
Arista Networks – Popular in data centers for low-latency, high-throughput environments.
Hewlett Packard Enterprise (HPE) / Aruba – Covers both campus and data center needs with the Aruba CX series.
Dell Technologies – Offers enterprise-grade PowerSwitch series.
Extreme Networks – Known for flexible, software-driven networking gear.
Netgear – Affordable options popular in small and medium businesses.
TP-Link – Cost-effective switches, which are frequently used in SMB and home offices.
Ubiquiti Networks – Well-known for UniFi-managed switches in prosumer and SMB settings.
MikroTik – Feature-rich yet budget-friendly switches.
Huawei – Enterprise-grade hardware strong in Asia and emerging markets.
Zyxel – Affordable switches targeting SMB and education sectors.
Allied Telesis – Industrial-grade and ruggedized switch options.
Avaya / Extreme (legacy) – Found in many older enterprise deployments.
…and many more.
Obkio supports standard MIBs, which means it can pull data from any switch that supports SNMP standards, and if you have advanced setups, custom OIDs are no problem either.
Monitoring switches isn’t just about collecting numbers; it’s about knowing which metrics actually tell you if your network is healthy or heading for trouble. Here’s what to track and why each metric matters:
Why it matters: If a switch goes down, so does everything connected to it. Uptime monitoring tells you instantly whether a switch or specific port is offline, helping you react before users notice. Historical uptime trends also reveal chronic reliability issues, letting you plan replacements or maintenance proactively.
Why it matters: A port that’s down or generating errors can disrupt connectivity, reduce throughput, and create intermittent problems that are hard to trace. Tracking interface status (including link flaps, CRC errors, and discards) helps you spot hardware problems, bad cabling, or misconfigurations before they impact operations.
Why it matters: Knowing how much traffic flows through each port is critical for capacity planning and congestion management. High utilization can indicate a bottleneck, while underutilized links may reveal inefficient traffic distribution. This metric helps you balance loads, avoid saturation, and plan for future growth.
Why it matters: Switches are essentially small computers. High CPU or memory usage can slow packet processing, increase latency, or even cause device crashes. Monitoring these metrics ensures your switches aren’t being pushed past their limits and alerts you to processes or traffic patterns that may need optimization.
Why it matters: These are the ultimate indicators of network performance from a user perspective. Packet loss can disrupt applications like VoIP, video conferencing, and critical data flows. High latency can indicate congestion, routing issues, or faulty hardware. Tracking both metrics allows you to detect issues before they escalate into service-impacting outages.

Monitoring a switch isn’t just about checking if it’s online, it’s about knowing how it’s performing at every level, from hardware to ports to traffic patterns.
A switch’s core health determines whether it can handle its workload without hiccups. Key elements to monitor include:
Availability/Uptime: Ensure the switch is online and accessible. Even a few minutes of downtime can cascade into network-wide disruptions.
CPU & Memory Usage: High CPU or memory utilization can slow down packet processing, introduce latency, or cause outages.
Temperature & Environmental Conditions: Overheating or poor ventilation can damage components. Monitoring temperature and environmental sensors helps prevent costly failures.
Power Supply & Fan Status: Redundant power supplies and fans are only useful if they’re working. Tracking their status ensures your switch stays up even if one component fails.
Hardware Errors & Alerts: Keep an eye on CRC errors, dropped packets, or failing components. These can indicate cabling issues, faulty ports, or hardware nearing end-of-life.
Ports are the gateways for all connected devices, making them a critical focus for monitoring:
Operational Status (Up/Down): Detect disconnected or disabled ports immediately to minimize downtime.
Port Utilization: Identify overused links that may be bottlenecks or underused links that indicate inefficient traffic distribution.
Error Rates: Spot packet loss, collisions, or high error counts that often point to cabling problems or failing hardware.
Port Flapping: Repeated up/down behaviour can disrupt network connectivity and should trigger alerts for investigation.
Monitoring the flow of data through your switch reveals network performance and potential security issues:
Bandwidth Usage: Measure how much traffic each port carries to spot congestion or overutilization.
Traffic Spikes & Trends: Detect unusual traffic patterns that could indicate network issues or emerging bottlenecks.
Latency & Jitter: Critical for real-time applications like VoIP, video conferencing, and cloud services.
Protocol & Flow Analysis: Use NetFlow, sFlow, or similar tools to see which applications or devices are consuming bandwidth.
Security Anomalies: Identify suspicious traffic patterns that could indicate malware, DDoS attacks, or unauthorized access attempts.
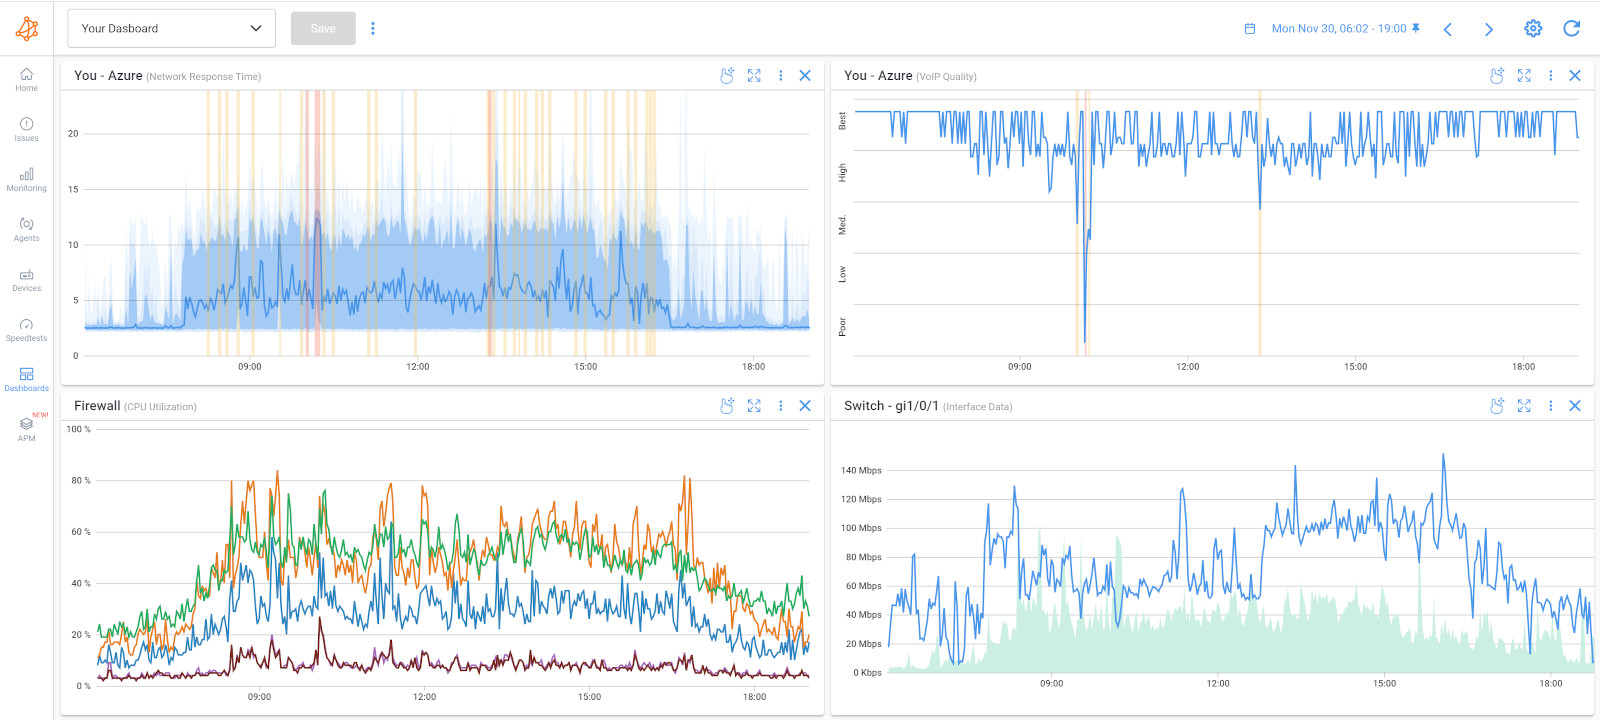 Screenshot from Obkio's Network Device Monitoring Tool
Monitoring your network switches isn’t just about checking boxes, it’s about catching problems before they snowball into outages. By keeping an eye on key metrics and device health, you can uncover a range of issues that might otherwise go unnoticed:
- Port Errors & Flapping: Ports going up and down repeatedly, or showing high error counts, can disrupt connectivity and indicate cabling problems, misconfigurations, or hardware faults.
- Overloaded CPU & Memory: Switches running near capacity can cause slowdowns, dropped packets, or erratic behaviour affecting all connected devices.
- High Bandwidth Utilization & Congestion: Overused links can lead to latency spikes, jitter, and poor application performance, especially for VoIP or video.
- Latency & Packet Loss: Even small amounts of packet loss or excessive latency can ripple through the network, impacting user experience and real-time services.
- Firmware or Configuration Issues: Outdated firmware or misconfigurations can trigger instability, security vulnerabilities, and inaccurate monitoring data.
- Environmental & Hardware Problems: Overheating, fan failures, or failing power supplies can cause sudden switch failures if left unchecked.
Regular monitoring doesn’t just spot these issues, it gives you the context to troubleshoot quickly, fix root causes, and prevent recurring problems.
For a deeper dive into common network switch issues and detailed troubleshooting steps, check out our full guide here: Common Network Switch Issues & How to Fix Them.
Learn how to spot, troubleshoot, and fix common network switch issues, from slow connections to VLAN errors, and keep your network running smoothly.
Learn more

Monitoring a switch isn’t just about setting up a tool and walking away, it’s about creating a disciplined approach that keeps your network healthy and secure. Here’s what seasoned network admins do:
SNMP is the backbone of switch monitoring, but older versions (v1 and v2c) are insecure. SNMP v3 adds authentication and encryption, keeping your performance data safe from prying eyes. If your switch supports it, always go v3, it’s worth the extra configuration time.
Polling gives you continuous metrics, but traps give you instant notifications when something goes wrong. Using both together means you’ll get the historical data for analysis and real-time alerts for urgent issues. That’s how you stay ahead of outages instead of reacting after the fact.
Outdated firmware can give you misleading readings or even prevent monitoring tools from collecting data properly. Schedule firmware updates for your switches to ensure metrics are accurate and your devices run smoothly.
Core switches carry the bulk of your network traffic, while edge switches connect users and devices. Ignoring either can leave blind spots. A comprehensive monitoring strategy covers both layers so you can spot problems wherever they appear.
Networks change — new devices, higher traffic, updated applications. Thresholds that made sense six months ago may trigger false alarms today or miss real issues. Review your alert thresholds regularly to make sure they reflect current conditions and keep your monitoring meaningful.
Following these best practices ensures that switch monitoring isn’t just a set-it-and-forget-it task, it becomes a proactive tool for maintaining network reliability and performance.
Switch monitoring sounds straightforward until reality hits. Even seasoned network admins run into recurring pitfalls. Here’s what to watch out for, and how to tackle them:
The Problem: Your monitoring tool is screaming about every little spike, interface flap, or brief latency blip. Before long, you start ignoring alerts, which defeats the whole purpose of monitoring.
The Solution: Refine your thresholds. Focus on metrics that truly matter to your network’s performance and set realistic limits. Prioritize critical alerts for high-impact issues like core switch failures or link saturation. Fewer, smarter alerts = faster, more effective response.
The Problem: Your network isn’t just Cisco, Juniper, or HPE — it’s a mix. Some monitoring tools struggle with heterogeneous environments, leaving blind spots.
The Solution: Use vendor-agnostic monitoring tools that support standard MIBs and SNMP. Tools like Obkio can poll switches across vendors, and even handle custom OIDs if needed. This way, you get consistent visibility without having to manage multiple monitoring systems.
The Problem: Monitoring requires access to your switches, which can create security risks if not handled properly. SNMP v1/v2c traffic is unencrypted, and misconfigured access can expose your devices.
The Solution: Use SNMP v3 whenever possible; it encrypts communication and adds authentication. Additionally, manage your switches through secure VLANs and follow least-privilege access principles. Secure monitoring ensures your network stays observable and safe.
Overcoming these challenges isn’t about complexity; it’s about strategy. With tuned thresholds, the right tools, and secure practices, switch monitoring becomes a manageable, high-value activity that keeps your network running smoothly.

A network switch is a device that connects multiple devices (such as computers, printers, and servers) within a local area network (LAN) and directs data between them. It ensures efficient data transfer by forwarding packets only to the intended device, which improves speed, reduces congestion, and keeps your network organized.
Yes, but it’s not as effective. While SNMP is the most common protocol for monitoring switches, some network performance monitoring (NPM) tools can also use other methods like API integrations, CLI-based polling, or flow protocols (NetFlow, sFlow) to gather data. However, SNMP provides the broadest compatibility and most standardized approach.
Continuous, real-time monitoring is ideal. Most NPM tools collect data at regular intervals (e.g., every 1–5 minutes) and send alerts immediately when an issue is detected. This allows teams to respond before a small problem turns into a network outage.
Older versions (SNMP v1 and v2c) are not encrypted, which makes them vulnerable to interception. SNMP v3 is the recommended version because it includes authentication and encryption to protect management data.
Yes. While you can manually check switch performance using the CLI or web interface, specialized network performance monitoring tools (with SNMP) provide continuous monitoring (which you can’t achieve manually), real-time alerts, detailed reports, and long-term trend analysis.
The process varies by vendor, but generally involves:
Logging into the switch via CLI or web UI.
- Enabling SNMP service.
- Configuring the SNMP community string (or user credentials for SNMP v3).
- Allowing SNMP traffic through any firewalls.
- Adding the switch to your NPM tool for polling.
Using both gives you continuous monitoring plus instant alerts.
- Polling: The monitoring tool regularly queries the switch for data at set intervals.
- Traps: The switch sends an immediate notification to the monitoring tool when a pre-set condition is met (e.g., a port goes down).
Warning signs include:
- High CPU or memory usage over time.
- Frequent interface errors or port flapping.
- Increased packet loss or latency
- Overheating or power issues.
Monitoring tools can alert you to these signs before a total failure occurs.
Yes. By tracking unusual spikes in traffic, unexpected port activity, or configuration changes, monitoring can help detect security breaches or unauthorized access attempts.
- Managed switches allow SNMP and advanced monitoring, configuration, and alerts.
- Unmanaged switches generally don’t support SNMP and offer minimal monitoring, often requiring physical inspection or inline network analysis tools.
This depends on your monitoring tool and network capacity. Many enterprise-grade NPM solutions can monitor hundreds or thousands of switches simultaneously, but you may need distributed polling for large or multi-site networks.
- Monitoring focuses on collecting data, detecting issues, and sending alerts.
- Management also includes configuration, firmware updates, and policy enforcement.
Switch monitoring is part of broader network management.
Yes, many NPM tools support remote monitoring through distributed agents or cloud-based dashboards, making it possible to monitor switches in branch offices, data centers, and remote sites.
Monitoring switch availability, ports, traffic patterns, and hardware health gives you the visibility you need to catch issues before they impact users or business operations.
Combining SNMP monitoring with a robust Network Performance Monitoring (NPM) tool lets you go beyond simple status checks. You get actionable insights, real-time alerts, and historical data that make troubleshooting faster, capacity planning smarter, and SLA validation easier.
Ultimately, the key to reliable networks is proactive monitoring. By continuously tracking switch performance, setting thresholds, and reviewing trends, you stay ahead of problems rather than reacting to outages. In the world of network administration, foresight beats firefighting every time.
Explore our Device Monitoring Tool!
- 14-day free trial of all premium features
- Deploy in just 10 minutes
- Monitor performance in all key network locations
- Measure real-time network metrics
- Identify and troubleshoot live network problems


 Obkio Blog


