


Table of Contents
Table of Contents
Welcome, tech enthusiasts and IT superheroes, to a captivating journey through the realm of infrastructure monitoring! In this blog, we dive headfirst into the exciting world of keeping your IT operations running smoothly. So fasten your seatbelts and get ready to catch the pulse of your systems with the top 30 infrastructure monitoring tools!
Think of these tools as your trusty sidekicks, constantly scanning the depths of your servers, networks, applications, and databases. With their watchful eyes and analytical prowess, they'll help you uncover bottlenecks, track resource utilization, and conquer any lurking performance demons. From server monitoring tools that keep hardware in check, to network monitoring tools that sniff out connectivity gremlins, and application performance monitoring tools that dive deep into the heart of your software, we've got it all covered!
So, whether you're a seasoned IT wizard or just embarking on your technological quest, "Catching the Pulse: The Top 30 Infrastructure Monitoring Tools for Seamless IT Operations" is your gateway to a world of insight, efficiency, and dare we say, a dash of tech superhero prowess. Get ready to unleash the power of these tools and soar to new heights of IT excellence. Let's dive in, shall we?
What is an Infrastructure Monitoring Tool? 
An Infrastructure Monitoring Tool is a software solution designed to track and analyze the performance and health of various components within an IT infrastructure. These tools collect data from servers, networks, databases, applications, and other infrastructure elements, providing insights into system availability, resource utilization, and potential issues or bottlenecks.
Different kinds of Infrastructure Monitoring Tools include:
- Server Monitoring Tools: These tools focus on monitoring server hardware, operating systems, and services running on the servers. They track metrics such as CPU usage, memory utilization, disk space, and network traffic. Examples of server monitoring tools are Obkio, Nagios, Zabbix, and Datadog.
- Network Monitoring Tools: These tools monitor network devices and traffic to identify connectivity issues, bandwidth utilization, and network performance problems. They provide visibility into network devices like routers, switches, firewalls, and capture data on packet loss, latency, and bandwidth consumption. Prominent network monitoring tools include Obkio, PRTG Network Monitor, SolarWinds Network Performance Monitor, and Wireshark.
- Application Performance Monitoring (APM) Tools: APM tools monitor the performance and availability of software applications. They provide insights into response times, transaction throughput, error rates, and dependencies of applications. APM tools often trace requests across various application components, enabling troubleshooting and optimization. Popular APM tools include New Relic, Dynatrace, and AppDynamics.
- Database Monitoring Tools: These tools focus on monitoring database systems, ensuring their availability, performance, and efficient resource utilization. They monitor metrics such as query response times, database connections, and disk space. Database monitoring tools include SQL Monitor, Oracle Enterprise Manager, and DataDog.
- Cloud Monitoring Tools: Cloud monitoring tools are specifically designed to monitor cloud-based infrastructure and services. They provide visibility into virtual machines, containers, cloud storage, and other cloud resources. These tools help track performance, availability, and cost optimization in cloud environments. Examples of cloud monitoring tools are Obkio, Amazon CloudWatch, Google Cloud Monitoring, and Azure Express Route Monitor.
- Log Monitoring Tools: Log monitoring tools collect and analyze log files generated by various systems and applications. They help identify patterns, errors, and security threats by parsing and correlating log data. Log monitoring tools include ELK Stack (Elasticsearch, Logstash, Kibana), Splunk, and Graylog.
These are just a few examples of the different kinds of Infrastructure Monitoring Tools available. Each tool has its own set of features and capabilities, and organizations often use a combination of tools to ensure comprehensive monitoring and management of their infrastructure.

Embracing Complexity: Navigating the Versatile Landscape of Infrastructure Monitoring Tools
Here is where the headache starts: The landscape of infrastructure monitoring tools has become a labyrinth of overlapping functionalities and blurred boundaries. It's no wonder that trying to neatly categorize them into predefined boxes has become a challenging task. In this ever-evolving technological arena, tools have grown and diversified, incorporating features from multiple categories, making them multifaceted and, at times, difficult to pigeonhole.
For instance, Application Performance Monitoring (APM) tools, originally designed to monitor software applications, have expanded their horizons to include Cloud and Network Monitoring capabilities. Suddenly, they are no longer confined to the realm of code optimization and error tracking; they can also peer into the inner workings of cloud environments and keep an eye on network performance. Likewise, Network Performance Monitoring tools have evolved into comprehensive suites that offer everything from network device monitoring to bandwidth analysis and beyond.
But here's the catch: While these tools may encompass a wide range of functionalities, there's always a certain point where their capabilities hit a limit. It's like a superhero with super strength—impressive, but there's still a ceiling to how much they can lift. The challenge lies in gauging these limits and understanding where each tool excels and where it might fall short.
The truth is, the effectiveness of infrastructure monitoring tools often depends on your specific needs. What works for one organization may not work for another, as each environment and infrastructure is unique. This inherent subjectivity is what often leads to confusion when browsing through listings on the web. Many rankings and comparisons tend to mix these tools together, as if they were directly comparable, when in reality, they cater to different aspects and requirements.
So, dear reader, as we embark on this exploration of the top 30 infrastructure monitoring tools, let's embrace the fluidity and complexity of this realm. Instead of rigidly confining them within predefined categories, let's celebrate their versatility and focus on understanding their strengths and limitations. By doing so, we can navigate the maze of options and find the perfect tool—or combination of tools—that aligns with our unique needs, bringing us one step closer to achieving monitoring bliss in our IT operations.

Demystifying the Categories of Infrastructure Monitoring Tools
Prepare to delve into the realm of infrastructure monitoring, where we break down the vast array of tools into five distinct families. In this section, we aim to bring clarity to the complex landscape of monitoring solutions by grouping them according to their functionalities, pricing models, and use cases. Get ready to explore each category and gain a deeper understanding of their unique characteristics.
Pure-Play Network and Infrastructure Performance Tools are dedicated specifically to network and infrastructure performance monitoring. They offer comprehensive capabilities to monitor network devices, traffic, and infrastructure components. They focus on delivering in-depth insights into network performance, bandwidth utilization, and connectivity issues. These tools typically come with advanced features, customizable dashboards, and robust reporting capabilities. They are designed for organizations that prioritize network performance optimization and require extensive visibility into their infrastructure.

Traditional network and infrastructure monitoring encompasses the more traditional monitoring tools that have been in the market for some time. They cover a broad range of infrastructure monitoring aspects, including network devices, server performance, resource utilization, and application availability. These tools often have a wide array of monitoring features and integrations with various systems. They are suitable for organizations seeking a comprehensive monitoring solution that combines multiple functionalities and provides a holistic view of their infrastructure.
Open-source or free monitoring tools offer cost-effective alternatives for organizations with budget constraints or those who prefer the flexibility of open-source software. These tools provide monitoring capabilities for network devices, servers, applications, and other infrastructure components. While they may not have all the advanced features of commercial tools, they still offer valuable monitoring functionalities and can be customized to fit specific requirements. These tools are suitable for small to medium-sized organizations or those who prefer community-driven solutions.
Application performance monitoring tools primarily focus on monitoring application performance, but they also incorporate infrastructure monitoring capabilities. In addition to tracking application metrics like response times, transaction throughput, and error rates, they provide visibility into the underlying infrastructure components that support the applications. This includes monitoring server performance, network connectivity, and database resources. These tools are ideal for organizations that require comprehensive insights into both application performance and the supporting infrastructure.
Packet capture tools excel in capturing and analyzing network traffic at a granular level. They are often used for high-security environments where deep packet inspection and analysis are crucial. These tools allow organizations to monitor network behavior, detect anomalies, and identify potential security threats. They provide detailed insights into network traffic patterns, bandwidth usage, and protocol-level information. These tools are typically utilized by organizations with strict security requirements or those who need in-depth network traffic analysis.
By categorizing infrastructure monitoring tools into these five families, it becomes easier to understand their functionalities, pricing models, and use cases. This approach provides a more structured framework for evaluating and selecting the right tool or combination of tools based on specific monitoring requirements and organizational needs.
Unleashing the Power: 6 Pure-Play Network and Infrastructure Performance Tools
Get ready to harness the true potential of your network and infrastructure with these six pure-play performance tools. Designed exclusively to optimize network performance, monitor traffic, and ensure the seamless operation of your infrastructure, these tools bring a new level of control and visibility to your IT operations. Let's dive into the world of these specialized tools and discover how they can supercharge your network and infrastructure performance.
1. Obkio Network Performance Monitoring
Obkio offers a cloud-based network performance monitoring tool that provides real-time monitoring and performance analytics for all networks types. This platform offers a range of features, including network latency and loss monitoring, as well as bandwidth monitoring, to help identify network bottlenecks and optimize network performance. Obkio's key features include continuous network testing, automatic alerting, device tracking, and usage reports.
One of the advantages of Obkio's network monitoring tool is its user-friendly interface. The platform's intuitive interface provides real-time insights into network performance, enabling users to detect and troubleshoot network issues quickly. Users can access the network monitoring and testing features via an easy-to-use interface that offers a range of options to identify and address network issues.
Obkio offers a range of dashboards and visualizations that provide real-time data on network performance. The platform offers a home page, agent details page, network session page, data center dynamic dashboard, branch dynamic dashboard, branch dashboard, visual traceroutes, thresholds, and notifications to help users monitor and optimize network performance.
Use Obkio's cloud monitoring tools to keep an eye on your most used cloud apps, with:
- AWS Direct Connect Monitoring
- Microsoft Azure ExpressRoute Monitoring
- Google Cloud Interconnect Monitoring
Obkio’s Pricing:
- Free : 2 Agents | 1 Device | 1 User (Limited Functionality)
- $399 / month : 10 Agents | 5 Devices | 2 Users
- $699 / month : 10 Agents | 10 Devices | 5 Users
- Additional Fees for Additional Agent, Device and User
Use Obkio's Price Calculator to build your custom plan, and get a customized quote that you can use for your business' budgetting and planning needs.

Obkio offers good news for its customers: its network performance monitoring solution comes with a straightforward pricing model. Obkio's pricing is based on a flat monthly fee per monitoring agent, device and users, with no additional costs based on data usage, bandwidth, or other metrics hard to estimate. This transparent pricing model makes it easy for customers to budget for their network monitoring costs without worrying about unexpected charges.
Learn more here : https://obkio.com/pricing/
Free Trial: https://obkio.com/signup/

Obkio’s App:


Additionally, Obkio offers a free trial for organizations to test out the platform and determine if it meets their needs before committing to a paid plan.

Be guided through how to identify and troubleshoot network problems with Obkio’s Network Monitoring app tour and features through screenshots.
Learn more- 14-day free trial of all premium features
- Deploy in just 10 minutes
- Monitor performance in all key network locations
- Measure real-time network metrics
- Identify and troubleshoot live network problems


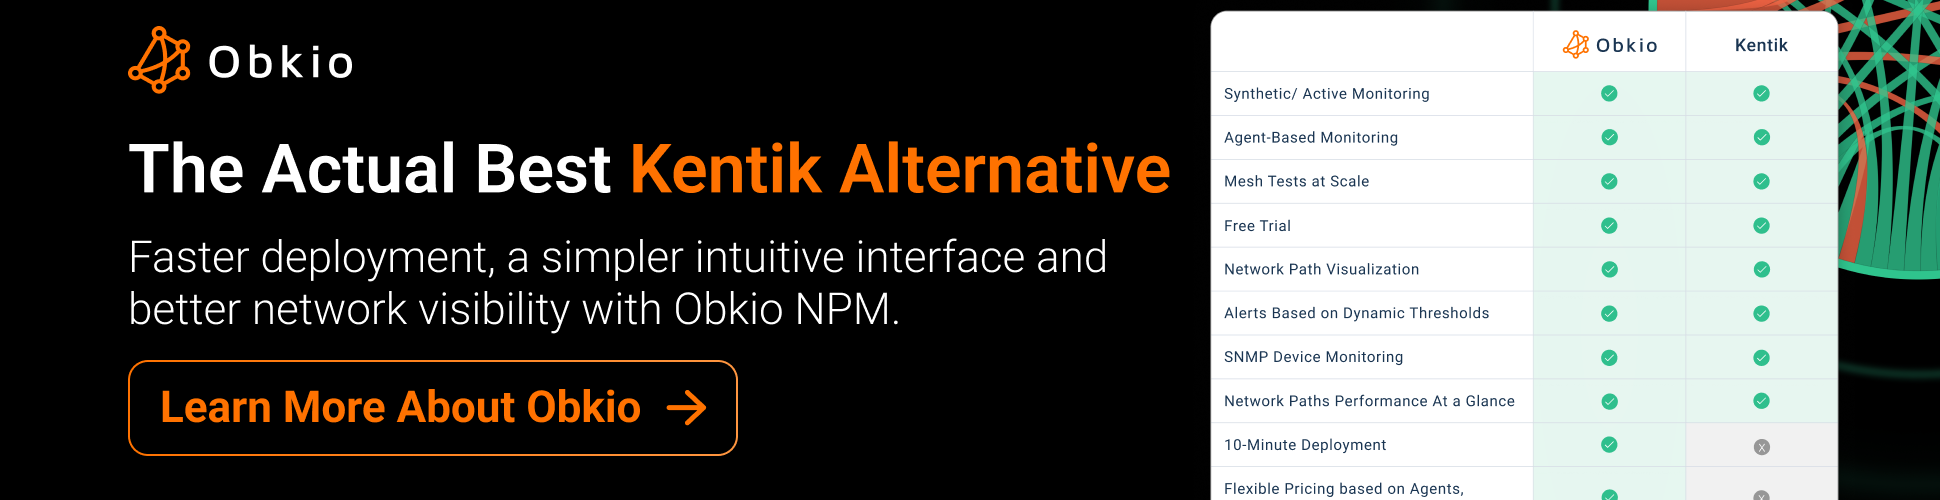
2. Kentik
Kentik is a network traffic intelligence platform that provides real-time network performance monitoring and analytics.
Its features include DDoS protection, network security monitoring, network performance optimization, and API integration. Kentik offers two pricing options - Essentials and Pro, which vary in included FPS, API queries/hour, dashboards, and scheduled reports.
Kentik App:


See how Obkio's Network Monitoring tool stands up against Kentik as the #1 Kentik Alternative.
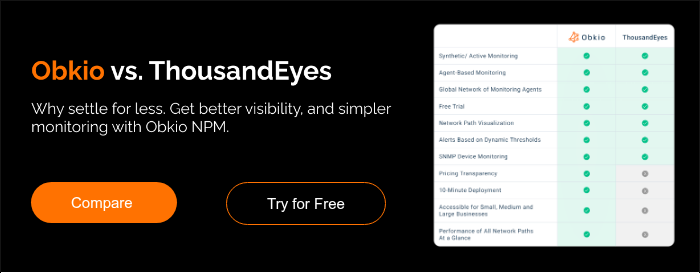
3. ThousandEyes
ThousandEyes is a cloud-based network performance monitoring tool that offers real-time monitoring and analytics for network performance, application performance, and user experience. Its key features include real-time alerts, device tracking, network topology mapping, and application performance monitoring.
ThousandEyes App:


See how Obkio's Network Monitoring tool stands up against ThousandEyes as the best ThousandEyes Alternative.
4. Catchpoint
Catchpoint is a cloud-based network and digital experience monitoring platform that provides real-time monitoring and analytics for network performance, web performance, and user experience. Its key features include real-time alerting, device tracking, network topology mapping, and API integration.
Catchpoint App:


Experience the power of the Catchpoint platform in action! This demo provides an overview of Catchpoint's real-time visibility into global monitoring networks and its various platform dashboards. You'll discover how monitoring teams can leverage Catchpoint to perform synthetic tests, analyze real-time user data, and monitor full network performance to optimize the user experience.

5. AppNeta
AppNeta is a cloud-based network performance monitoring tool that offers real-time monitoring and analytics for network performance and application performance. Its key features include real-time alerting, device tracking, network topology mapping, and API integration. AppNeta offers five pricing options, including Small Office, Large Office, Data Center, and two Global Monitoring options.
AppNeta App:


See how Obkio's Network Monitoring tool stands up against Appneta as the ultimate Appneta Alternative.

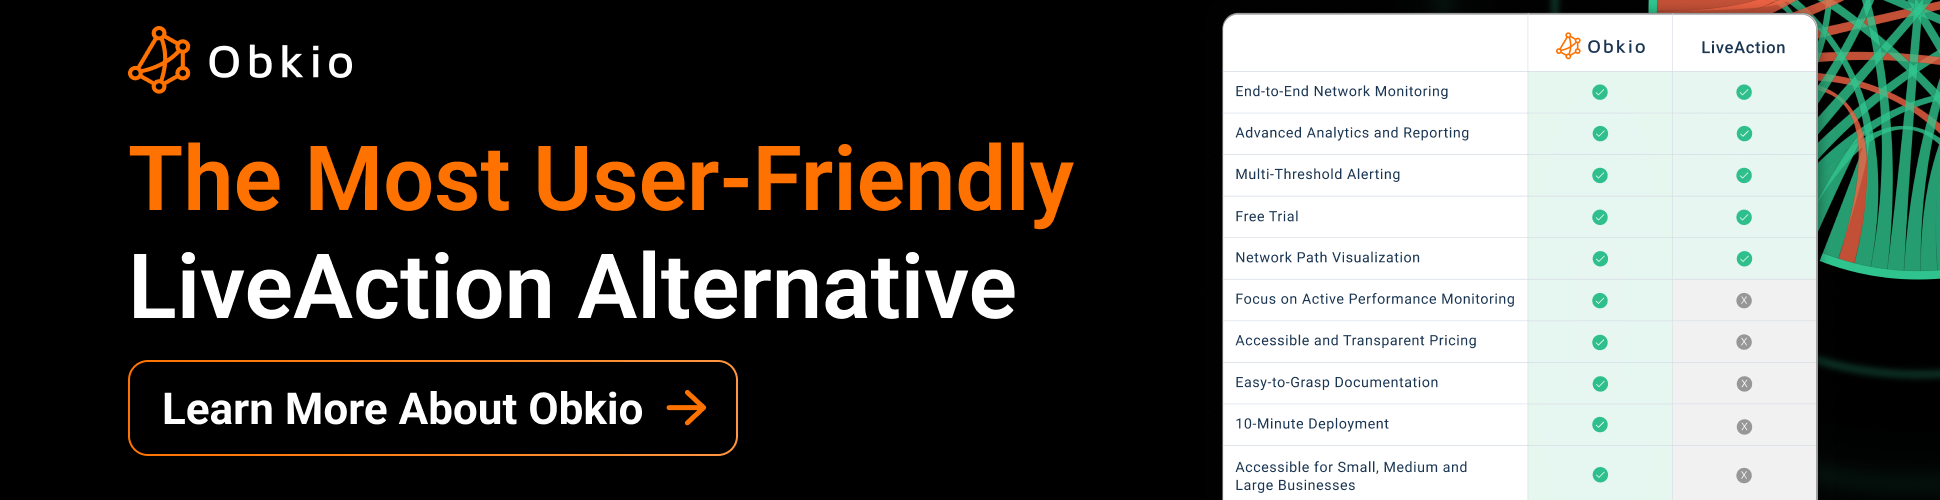
6. LiveAction
LiveAction is a cloud-based network performance monitoring and diagnostics tool that provides real-time monitoring and analytics for network performance.
Its key features include real-time alerts, network topology mapping, application performance monitoring, and API integration. LiveAction offers various pricing options, including LiveNX WAN Perpetual License and LiveNX SMB Perpetual License.
LiveAction App:


Time-Tested Solutions: 7 Traditional Network and Infrastructure Monitoring Tools
Explore the realm of tried and true monitoring tools that have stood the test of time. These seven traditional network and infrastructure monitoring tools have been the go-to choice for organizations seeking comprehensive solutions. From network device monitoring to server performance tracking, they offer a holistic view of your infrastructure's health and performance. Join us as we unravel the features and capabilities of these trusted tools and uncover the insights they can provide for your IT environment.
1. PRTG Network Monitor
A comprehensive IT management software solution that offers network bandwidth monitoring capabilities. It provides real-time traffic analysis, bandwidth usage reports, device tracking, and more. It can monitor a variety of network devices and applications and offers customizable alerts and notifications to keep users informed of network performance issues. PRTG offers cloud-based network monitoring services that allow users to monitor their network from anywhere and offers flexible deployment options.
PRTG App:


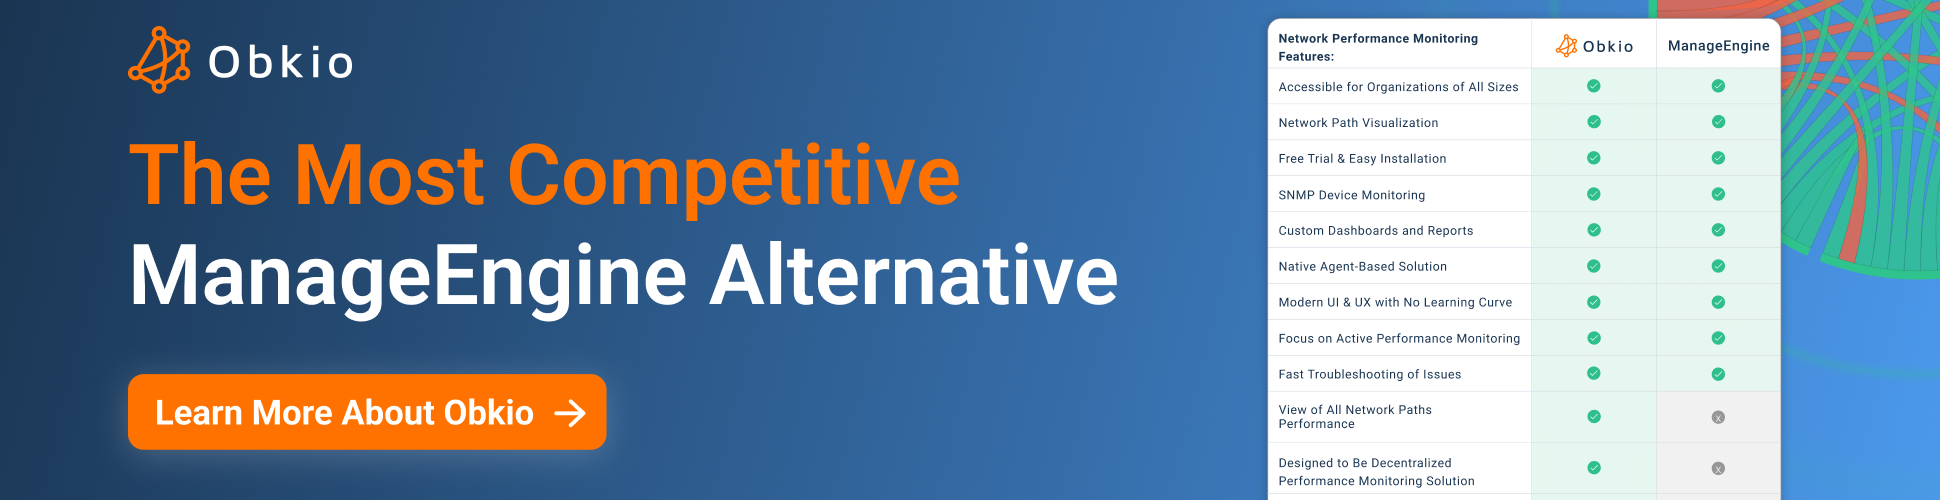
2. Manage Engine OPManager
A popular IT management software solution that offers network bandwidth monitoring capabilities. It provides real-time traffic analysis, bandwidth usage reports, device tracking, and more. It can monitor a range of network devices and applications and offers customizable alerts and notifications to keep users informed of network performance issues. OPManager offers cloud-based network monitoring services that allow users to monitor their network from anywhere and provides a range of deployment options, including on-premises, hosted, or as a virtual appliance.
Manage Engine OPManager App:


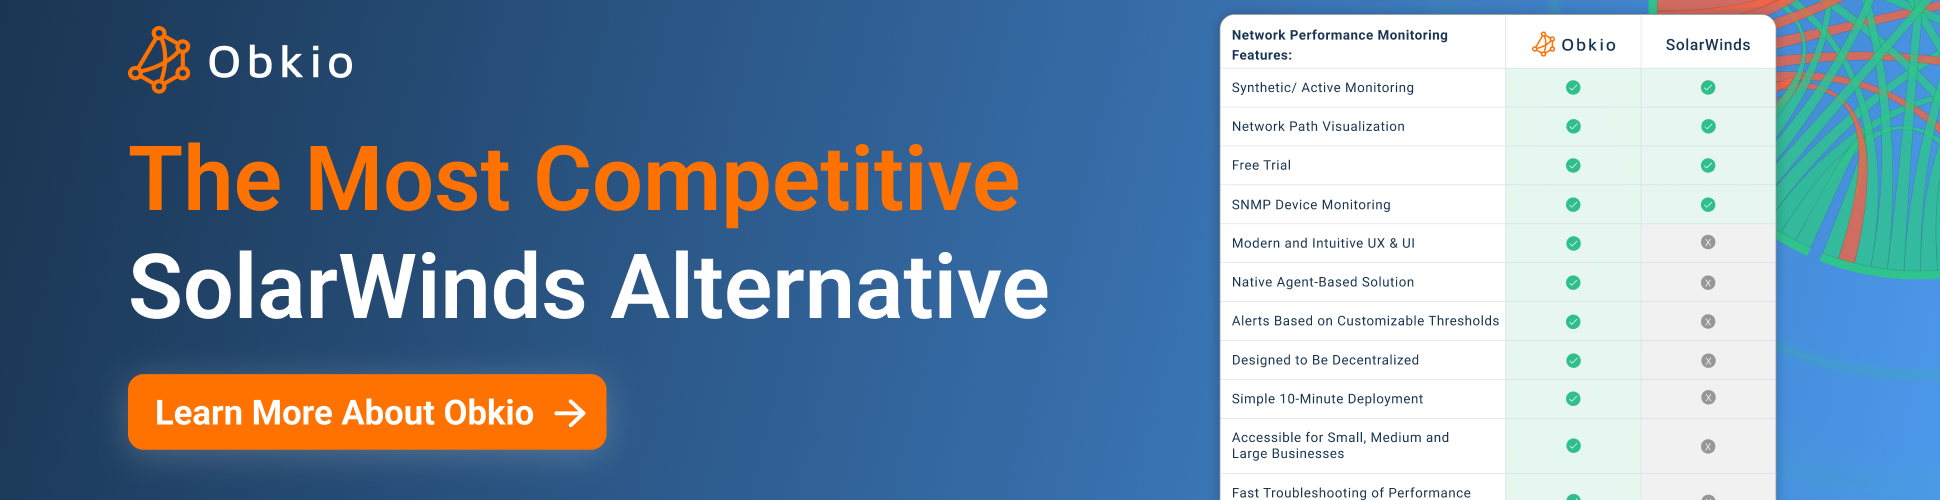
3. SolarWinds Network Performance Monitor
A comprehensive network performance monitoring tool that provides real-time visibility into network performance and health. It offers network device monitoring, traffic analysis, and real-time alerts and notifications to help identify and troubleshoot network issues. SolarWinds offers cloud-based network monitoring services that allow users to monitor their network from anywhere and offers flexible deployment options.
SolarWinds App:


Discover how Obkio stands up against SolarWinds NPM as the simplest, most affordable SolarWinds alternative.
4. ScienceLogic
An IT infrastructure monitoring and management platform that offers real-time visibility into network performance, health, and security. It provides network device monitoring, traffic analysis, and customizable alerts and notifications to help identify and troubleshoot network issues. ScienceLogic offers cloud-based network monitoring services that allow users to monitor their network from anywhere and provides a range of deployment options, including public and private cloud, on-premises, or hybrid.
ScienceLogic App:


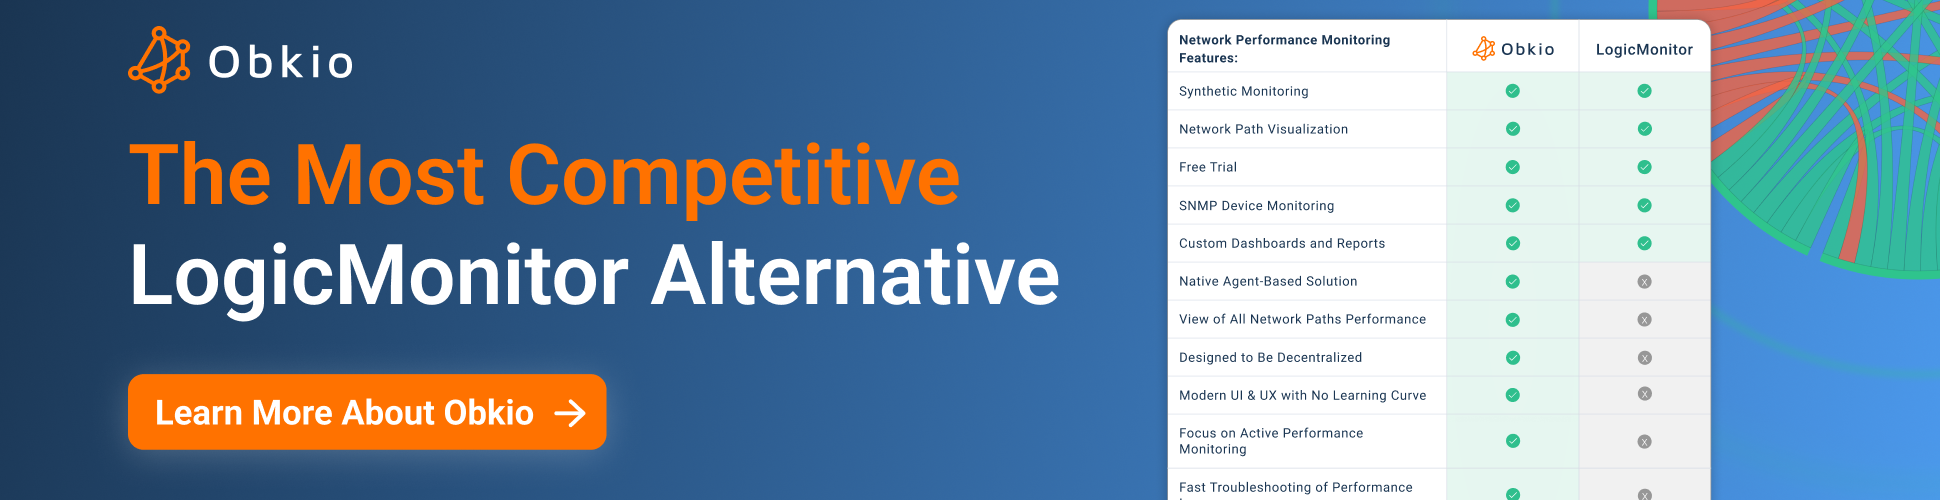
5. LogicMonitor
A cloud-based IT infrastructure monitoring and management platform that provides real-time visibility into network performance and health. It offers network device monitoring, traffic analysis, and real-time alerts and notifications to help identify and troubleshoot network issues. LogicMonitor offers cloud-based network monitoring services that allow users to monitor their network from anywhere and provides a range of deployment options, including public and private cloud, on-premises, or hybrid.
LogicMonitor App:


6. Auvik
A cloud-based network monitoring and management tool that provides real-time visibility into network performance, health, and security. It offers network device monitoring, traffic analysis, and customizable alerts and notifications to help identify and troubleshoot network issues. Auvik offers cloud-based network monitoring services that allow users to monitor their network from anywhere and provides a range of deployment options, including public and private cloud, on-premises, or hybrid.
Auvik App:


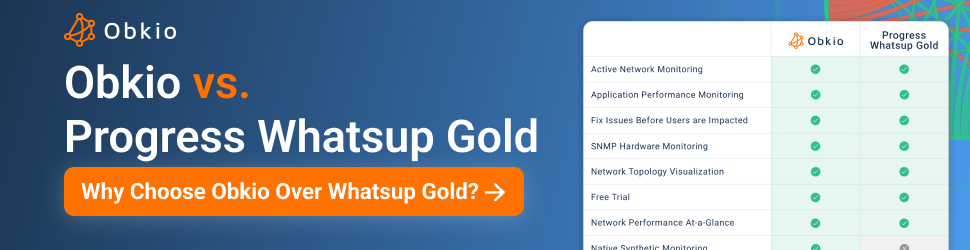
7. Progress WhatsUp Gold
An IT infrastructure monitoring and management platform that offers network device monitoring, traffic analysis, and customizable alerts and notifications to help identify and troubleshoot network issues. It provides real-time visibility into network performance and health and offers cloud-based network monitoring services that allow users to monitor their network from anywhere and provides a range of deployment options, including public and private cloud, on-premises, or hybrid.
Progress WhatsUpGold App:


Embracing Flexibility: 5 Open-Source or Free Network and Infrastructure Monitoring Tools
Enter the world of cost-effective and flexible monitoring solutions with these five open-source or free tools. Perfect for organizations on a budget or those who prefer the freedom of open-source network monitoring software, these tools offer valuable monitoring functionalities without the price tag. Discover the customizable nature of these solutions as we delve into their monitoring capabilities for networks, servers, and applications. Let's explore the realm of community-driven tools and unlock the possibilities they hold for your infrastructure monitoring needs.
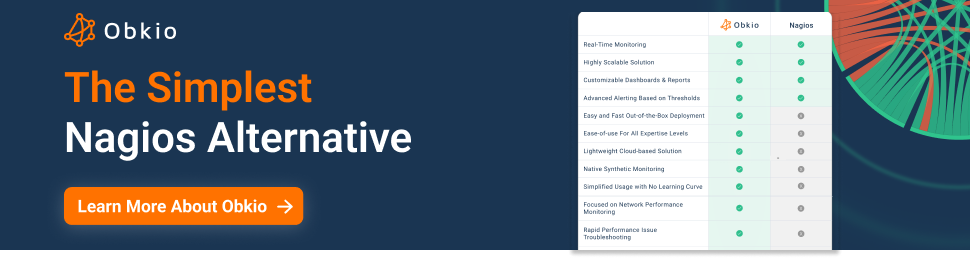
1. Nagios XI
Nagios XI is a popular IT infrastructure monitoring solution that provides comprehensive monitoring capabilities for networks, systems, and applications. It offers real-time alerting, reporting, and customizable dashboards to help users quickly identify and resolve issues. Nagios XI also includes cloud monitoring capabilities, allowing users to monitor cloud-based infrastructure, such as AWS and Azure, along with on-premises infrastructure. It provides insights into cloud resource usage, performance, and availability, and supports monitoring of cloud services such as RDS, S3, and EC2.
Nagios XI App:


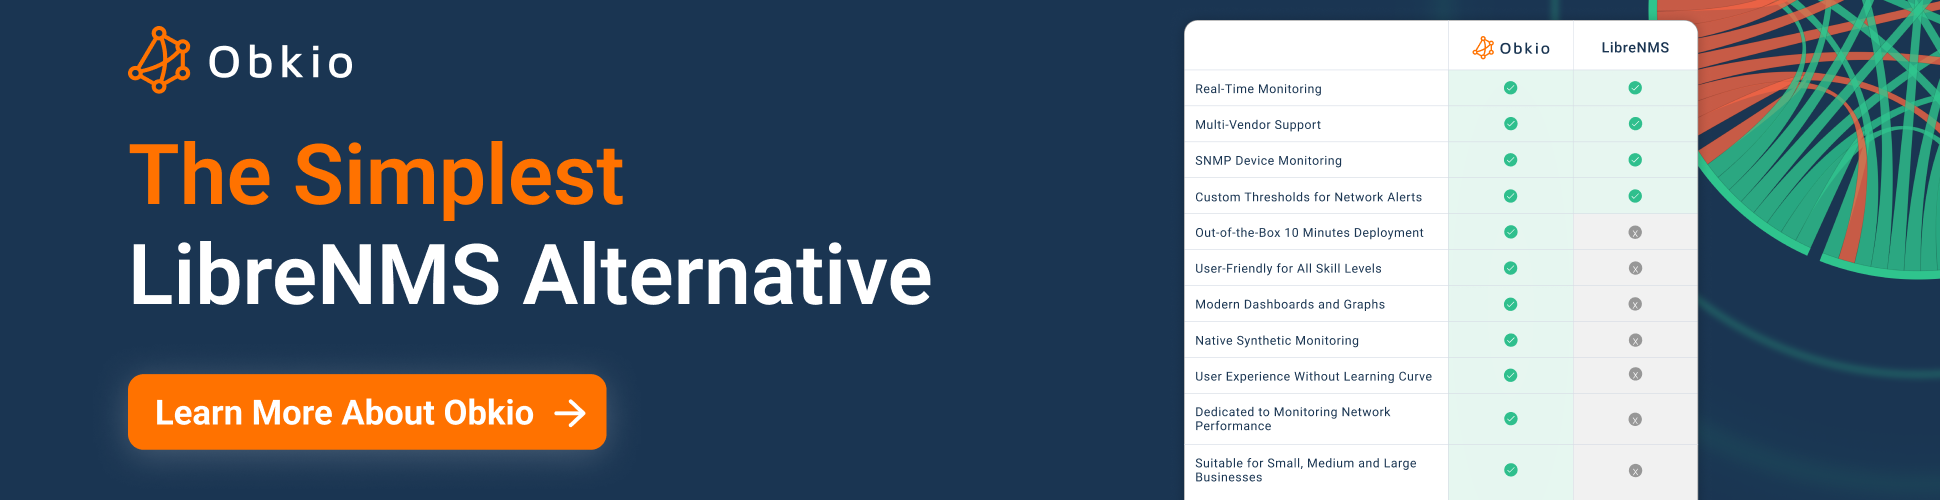
2. LibreNMS
LibreNMS is a free and open-source network monitoring solution that provides auto-discovery, alerting, and reporting capabilities. It offers support for a wide range of devices and protocols, including SNMP network monitoring, syslog, and ICMP. LibreNMS also includes cloud monitoring capabilities, allowing users to monitor cloud-based infrastructure, such as AWS and Azure, along with on-premises infrastructure. It provides insights into cloud resource usage, performance, and availability, and supports monitoring of cloud services such as EC2 and RDS.
LibreNMS App:


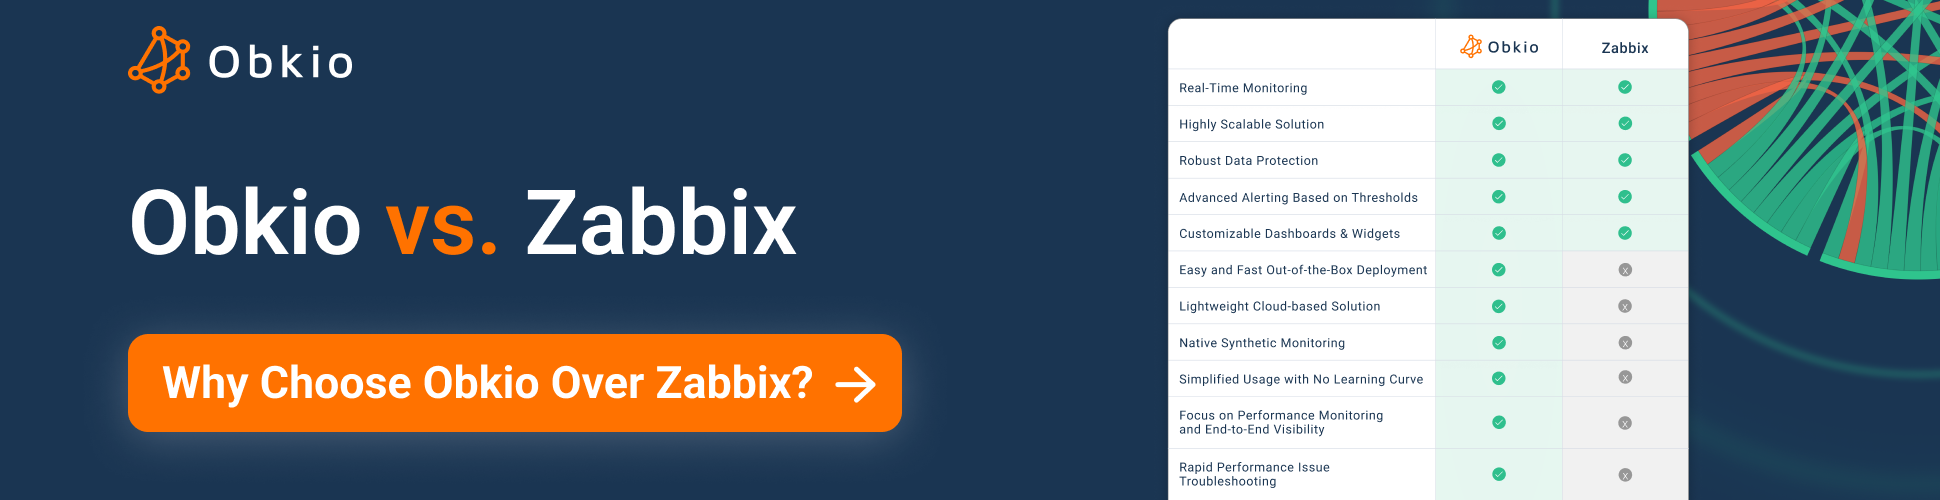
3. Zabbix
Zabbix is an enterprise-grade monitoring solution that offers a wide range of monitoring capabilities, including network, server, and application monitoring. It provides real-time alerting, reporting, and customizable dashboards to help users quickly identify and resolve issues. Zabbix also includes cloud monitoring capabilities, allowing users to monitor cloud-based infrastructure, such as AWS and Azure, along with on-premises infrastructure. It provides insights into cloud resource usage, performance, and availability, and supports monitoring of cloud services such as EC2, RDS, and ELB.
Zabbix App:


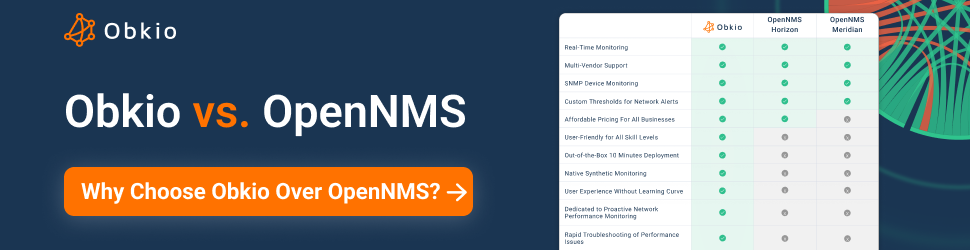
4. Open NMS
OpenNMS is a free and open-source network monitoring solution that provides auto-discovery, alerting, and reporting capabilities. It offers support for a wide range of devices and network monitoring protocols, including SNMP, syslog, and ICMP. OpenNMS also includes cloud monitoring capabilities, allowing users to monitor cloud-based infrastructure, such as AWS and Azure, along with on-premises infrastructure. It provides insights into cloud resource usage, performance, and availability, and supports monitoring of cloud services such as EC2 and RDS. OpenNMS also offers a Kubernetes plugin that allows users to monitor Kubernetes clusters and their components.
OpenNMS App:


5. Icinga
An open-source network monitoring and management tool that provides real-time visibility into network performance and health. It offers network device monitoring, traffic analysis, and customizable alerts and notifications to help identify and troubleshoot network issues. Icinga offers cloud-based network monitoring services that allow users to monitor their network from anywhere and provides a range of deployment options, including public and private cloud, on-premises, or hybrid.
Icinga App:


The Perfect Synergy: 6 Application Performance Monitoring Tools with Infrastructure Monitoring
Witness the convergence of application performance monitoring and infrastructure monitoring with these six exceptional tools. Designed to optimize application performance while also offering insights into the supporting infrastructure, these tools provide a comprehensive view of your IT ecosystem. From tracking response times and transaction throughput to monitoring server performance, network connectivity, and database resources, these tools ensure your applications run at peak efficiency. Join us as we uncover the powerful synergy between application performance monitoring and infrastructure monitoring.
1. Datadog
Datadog is a cloud-based monitoring and analytics platform that provides monitoring, alerting, tracing, and logging capabilities for applications and infrastructure. It offers full-stack observability with support for over 450 integrations across more than 150 technologies, including AWS, Azure, GCP, Kubernetes, and Docker. Datadog's cloud monitoring services enable users to collect and analyze data from across their entire stack, providing deep insights into system performance and helping them troubleshoot issues quickly.
Datadog App:


2. AppDynamics
AppDynamics is an application performance monitoring (APM) solution that provides real-time insights into application performance, user experience, and business impact. It provides end-to-end visibility across application environments, including cloud, on-premises, and hybrid environments, enabling users to quickly identify and resolve issues before they impact end-users. AppDynamics' cloud monitoring services allow users to monitor their applications, microservices, and APIs in real-time and track performance metrics such as response times, error rates, and resource utilization.
AppDynamics App:

3. Dynatrace
Dynatrace is an APM and digital experience management (DEM) solution that provides real-time insights into application performance, user experience, and business impact. It uses AI-powered automation to detect anomalies and performance issues, providing root cause analysis and recommendations for remediation. Dynatrace's cloud monitoring services allow users to monitor their applications and infrastructure across cloud, hybrid, and multi-cloud environments, providing visibility into cloud provider-specific metrics such as AWS, Azure, and Google Cloud.
Dynatrace App:


4. Splunk
Splunk is a cloud-based platform that provides monitoring, logging, and analytics capabilities for applications and infrastructure. It offers machine learning-driven insights and predictive analytics for detecting and resolving issues, and provides support for over 300 integrations across multiple technology stacks. Splunk's cloud monitoring services allow users to monitor their entire stack, from infrastructure to application performance, and analyze data in real-time to identify issues and troubleshoot problems.
Splunk App:

5. New Relic
New Relic is an APM solution that provides real-time insights into application performance, user experience, and business impact. It offers support for multiple languages, frameworks, and environments, including cloud, on-premises, and hybrid environments, and provides customizable dashboards and alerts for tracking performance metrics. New Relic's cloud monitoring services enable users to monitor their entire stack, including applications, infrastructure, and logs, and provides out-of-the-box integrations with popular cloud platforms such as AWS, Azure, and GCP.
New Relic App:


6. Elastic Observability
Elastic Observability is a cloud-based monitoring and observability solution that provides real-time insights into application performance, infrastructure, and logs. It offers support for multiple technologies and integrations, including AWS, Azure, and GCP, and provides customizable dashboards and alerts for tracking performance metrics. Elastic Observability's cloud monitoring services enable users to monitor their entire stack, from infrastructure to application performance, and analyze data in real-time to identify issues and troubleshoot problems.
Elastic Observability App:


Unveiling the Secrets: 6 Packet Capture High-Security Network and Infrastructure Monitoring Tools
Step into the realm of heightened security with these six packet capture tools designed for high-security environments. With their ability to capture and analyze network traffic at a granular level, these tools are essential for monitoring network behavior, detecting anomalies, and identifying potential security threats. Discover the world of deep packet inspection, detailed network traffic analysis, and robust security features as we unveil the secrets these tools hold for securing your network and infrastructure.
1. Ixia/Keysight Network Monitoring
Ixia/Keysight Network Monitoring provides network visibility and security solutions to enterprises and service providers. Their cloud network monitoring solution offers visibility into public, private, and hybrid cloud environments. It provides packet-level visibility, performance monitoring, and security analysis of network traffic in the cloud. The solution can be deployed as a virtual machine or on-premises appliance.
Ixia/Keysight App:


2. Viavi Observer Solutions
Viavi Observer Solutions offers a comprehensive network performance management solution for enterprises, service providers, and government agencies. Their cloud network monitoring solution provides end-to-end visibility across hybrid cloud environments. It offers real-time analytics and diagnostics of cloud network performance, identifying and resolving issues before they impact users. The solution is available as a SaaS or on-premises deployment.
Viavi Solutions App:


3. Gigamon
Gigamon provides a cloud visibility and analytics platform for monitoring and securing hybrid cloud environments. Their cloud network monitoring solution offers real-time visibility into network traffic across public, private, and hybrid cloud environments. It enables IT teams to monitor and optimize network performance, detect and respond to security threats, and ensure compliance. The solution can be deployed as a physical or virtual appliance, or as a SaaS offering.
Gigamon App:


4. Netscout nGeniusOne
Netscout nGeniusOne is a network and application performance management solution for enterprises and service providers. Their cloud network monitoring solution offers end-to-end visibility into multi-cloud environments, including AWS, Azure, and Google Cloud. It provides real-time analytics and diagnostics of network performance, ensuring that applications are running smoothly and user experience is optimized. The solution is available as a SaaS or on-premises deployment.
Netscout nGeniusOne App:


5. Extrahop Revealx
Extrahop Revealx is a cloud-native network detection and response (NDR) solution for securing hybrid cloud environments. Their cloud network monitoring solution provides full visibility into network traffic, detecting and responding to security threats in real-time. It offers automated threat detection and response, ensuring that IT teams can quickly remediate security incidents before they cause damage. The solution is available as a SaaS offering.
Extrahop Revealx App:


6. Accedian Skylight
Skylight is a cloud-native network and application performance monitoring solution for enterprises and service providers. Their cloud network monitoring solution offers real-time visibility into network traffic across multi-cloud environments. It provides end-to-end network performance monitoring, ensuring that applications are running smoothly and user experience is optimized. The solution can be deployed as a SaaS or on-premises deployment.
Accedian Skylight App:


Unlocking Your Infrastructure Monitoring Success: Embrace Obkio
In conclusion, we hope that this exploration of the various categories of infrastructure monitoring tools has shed light on the diverse options available to meet your organization's unique needs. Whether you're seeking specialized network and infrastructure performance tools, reliable traditional monitoring solutions, cost-effective open-source alternatives, application performance monitoring with infrastructure insights, or high-security packet capture tools, there's a toolset that can empower you to optimize your IT operations.
Remember, the right solution depends on your specific requirements and priorities. By understanding the functionalities, pricing models, and use cases of each tool category, you can make informed decisions and select the tools that align best with your monitoring objectives.
But before we part ways, we'd like to introduce you to a monitoring solution that stands out from the crowd. Meet Obkio, the cool kid in the neighborhood with no strings attached. With Obkio, you can be up and running in less than 10 minutes, enjoying a hassle-free monitoring experience. Obkio offers a user-friendly interface, real-time monitoring, customizable dashboards, and insightful reports, making it a reliable ally in your quest for seamless IT operations.
So, if you're ready to take the next step and try a monitoring solution that's as cool as it gets, give Obkio a whirl. Embrace the simplicity, power, and agility it brings to your infrastructure monitoring journey. Get started with Obkio and unlock the true potential of your IT environment today!
Remember, the world of infrastructure monitoring is ever-evolving, so stay curious, adapt to new technologies, and continue to explore innovative solutions that can drive your organization forward. Cheers to smooth operations, unparalleled insights, and a future filled with monitoring success!
This page is compiled from the information available on the software’s official website. We have made every attempt to ensure the accuracy and reliability of the information provided in this article. However, the information is provided “as is” without warranty of any kind. Obkio is not liable for any inaccuracies in the article due to changes made on their websites or any development made to their products after the date of publication of this article. Please refer to their websites for more information.
