Table of Contents
Table of Contents
In today's fast-paced business environment, reliable and efficient network connectivity is crucial to the success of any organization. Slow or inconsistent connections can disrupt operations, cause delays, and negatively impact productivity. One of the key factors that can affect the performance of your network is latency, or the delay between the sending and receiving of data.
By testing your network latency, you can identify potential issues and take steps to optimize your connection for maximum speed and reliability. In this article, we will provide a comprehensive guide to testing your network latency, including recommended tools and techniques.
Whether you are an IT professional, a small business owner, or a member of a larger organization, this article will equip you with the knowledge you need to ensure a smooth and efficient connection.
Network latency is the time it takes for data to travel from a source to a destination and back again. It is often referred to as the "delay" in a network and is typically measured in milliseconds (ms). Latency is an essential metric in network performance because it affects how quickly devices communicate and respond to one another.
For example:
- When you click on a link, latency determines how fast the website loads.
- In video calls or online gaming, latency influences how smoothly interactions occur without lag or delay.

- One-Way Latency: The time it takes for a packet to travel in one direction (e.g., from your computer to a server).
- Round-Trip Time (RTT): The total time for a packet to go to its destination and back, often measured using tools like ping.
We asked a supercomputer “What is latency”, its impact on network performance, and strategies for minimizing it and created this comprehensive guide.
Learn more

Testing network latency is critical because it directly impacts the performance and usability of various applications, especially in real-time scenarios. Here's why:
Ensure Smooth User Experiences: High latency causes delays in browsing, downloading, or streaming, leading to frustration for end-users. For businesses, it can negatively affect customer satisfaction and employee productivity.
Optimize Real-Time Applications: Applications like VoIP, video conferencing (e.g., Zoom), and online gaming require low latency to function without interruptions. Testing helps maintain quality in these environments.
Identify and Troubleshoot Issues: High latency may signal problems such as congestion, routing inefficiencies, or faulty hardware. Regular testing helps detect and address these issues proactively.
Plan for Scalability: Testing latency allows businesses to assess their network's readiness for increased usage, such as during peak traffic or after deploying new applications.
Improve Network Performance: Testing helps network administrators optimize routes, allocate bandwidth, and implement technologies (e.g., SD-WAN or QoS) to reduce latency.
By understanding and regularly testing network latency, you can ensure your network meets the demands of modern applications and user expectations, keeping disruptions and frustrations to a minimum.
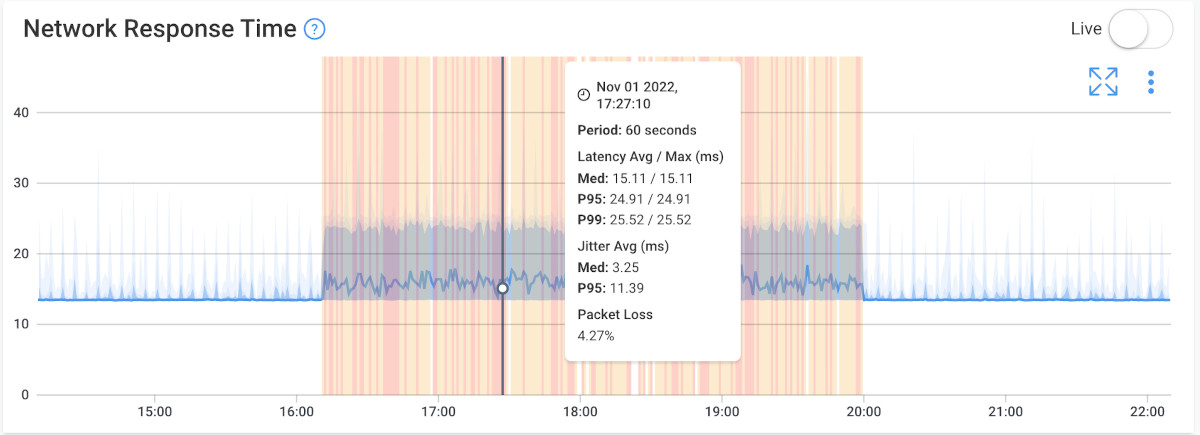 Screenshot from Obkio's Network & Latency Monitoring Tool
Sign up for Obkio's Free Trial today to proactively monitor and detect latency issues in your network, improve your network performance, and ensure a better user experience.
- 14-day free trial of all premium features
- Deploy in just 10 minutes
- Monitor performance in all key network locations
- Test real-time network metrics
- Identify and troubleshoot live network problems

The method used to test network latency depends on the complexity of your network and your needs. For smaller networks with relatively simple setups, basic tools like Ping and Traceroute may be sufficient to diagnose and address latency issues. However, for larger or more complex networks, more sophisticated tools and techniques may be required to get an accurate picture of network performance.
In this section, we will explore several methods for testing network latency. You can test network latency using Ping, Traceroute, Network Analyzers, Network Performance Monitoring tools or Network Latency Monitoring tools.
Whether you are managing a small home network or a large enterprise-level system, there is a tool or technique that can help you diagnose and address latency issues to ensure optimal performance.
Testing network latency is an essential step in diagnosing and addressing performance issues. Here are some common tools and techniques used to Test network latency:
A question that people often ask is "How do I measure network latency using command-line tools like ping and traceroute?" Lucky for you, these two tools are the easiest ways to quickly test latency. While they don't give you complete diagnostics about latency like more comprehensive Network Monitoring tools, they're a great start.
- Difficulty : Easy
- Time : 30 Minutes
- Accuracy : Average
- Troubleshooting : Basic
- Monitoring : None
Ping is a simple command-line utility that sends a small packet of data to a specific IP address and tests the time it takes for the response to be received. This can be a quick and easy way to get a basic measurement of network latency.
Or a simple https://www.speedtest.net/ can do the work for that. You can verify this on multiple devices and scenarios in your network
here is an example of using the Ping command to test network latency:
Open a Command Prompt or Terminal window on your computer.
Type ping followed by the IP address or hostname of the device you want to test. For example:
ping www.google.com
Press Enter.
The command will send several packets of data to the target device (in this case, the Google website) and test the time it takes for the responses to be received. You will see the results of each ping attempt in the Command Prompt or Terminal window, including the round-trip time (RTT) in milliseconds.
Analyze the results of the ping test. If the RTT is consistently low (less than 50 ms), your network latency is likely performing well. If the RTT is high (over 100 ms) or fluctuates significantly, you may have latency issues that require further investigation.
Repeat the test several times over a period of minutes or hours with multiple sites and devices to get a more accurate picture of network latency over time.
Here is a an example of what the results of the Ping Command might look like:
Pinging www.google.com [216.58.194.196] with 32 bytes of data:
    Reply from 216.58.194.196: bytes=32 time=11ms TTL=118
    Reply from 216.58.194.196: bytes=32 time=12ms TTL=118
    Reply from 216.58.194.196: bytes=32 time=10ms TTL=118
    Reply from 216.58.194.196: bytes=32 time=9ms TTL=118
Ping statistics for 216.58.194.196:
    Packets: Sent = 4, Received = 4, Lost = 0 (0% loss),
    Approximate round trip times in milli-seconds:
    Minimum = 9ms, Maximum = 12ms, Average = 10ms
In this example, the Ping command sent four packets of data to the IP address associated with www.google.com and received all four packets back without any loss. The "time" value for each packet represents the round-trip time in milliseconds, or the amount of time it took for the packet to travel from the computer to the Google server and back.
The Ping statistics at the bottom of the output show that the minimum, maximum, and average round-trip times were 9ms, 12ms, and 10ms, respectively.
You can also do this using Obkio's IP Monitoring feature.
Here are some scenarios using ping to troubleshoot network latency (the following commands are different on mac and linux):
Ping the Local Host: Start by pinging the local host to ensure that your computer is functioning correctly. Type ping localhost in the command prompt or terminal to check if the response time is within an acceptable range. If the response time is high, it could indicate an issue with your computer's network adapter or other hardware problems.
Ping the Default Gateway: Ping the default gateway to verify that your computer can communicate with the local network. Type ping <default gateway IP address> in the command prompt or terminal. If the response time is high or there are lost packets, it could indicate issues with the local network or router.
Ping a Remote Host: Ping a remote host on the internet to check if latency issues are due to the network infrastructure or the remote host. Type ping <remote host IP address> in the command prompt or terminal. If the response time is high or there are lost packets, it could indicate issues with the remote host or the network infrastructure.
Ping Traceroute: Use the ping command with the -T flag to perform a traceroute and identify the specific point where latency is occurring.
Type ping -T <remote host IP address> in the command prompt or terminal. The output will display the response time and the IP address of each router the ping passes through. If there is a high response time at a specific router, it could indicate an issue with that router or network segment.
Ping Flood Test: Use the ping command with the -f flag to perform a flood test and identify the maximum packet rate before lost packets occur.
Type ping -f <remote host IP address> in the command prompt or terminal. The output will display the packet loss rate. If there is high packet loss, it could indicate issues with the network infrastructure or the remote host.
These scenarios using ping can help troubleshoot network latency issues and identify specific points of failure in the network infrastructure. It's important to use multiple tools and tests to diagnose latency issues and ensure that your network is running smoothly.
Note that the actual round-trip time may vary depending on a variety of factors, including network congestion and the distance between the computer and the server.
Additionally, the results of the Ping command may not always be indicative of true network latency, as factors such as network congestion (WAN or LAN congestion) or device processing times can impact the accuracy of the results.
However, like mentioned before, Ping can be a useful tool for quickly getting a basic measurement of network latency.
- Difficulty : Easy
- Time : 30 Minutes
- Accuracy : Average
- Troubleshooting : Limited
- Monitoring : None

Traceroute is another command-line utility that can be used to identify the path that network traffic takes between two devices. By testing the time it takes for data to travel between each hop along the way, you can identify potential sources of latency.
Leverage Obkio Vision to monitor, detect and troubleshoot network problems with visual traceroutes, IP route historic and graphical network maps.
Try for Free

here is an example of a Traceroute command to test network latency:
Open a Command Prompt or Terminal window.
Type "tracert" followed by the IP address or hostname of the device you want to test. For example: tracert 192.168.1.1 or tracert www.google.com
Press Enter.
The command will send packets of data to the target device and test the time it takes for the responses to be received at each hop along the network path. You will see the results of each hop in the Command Prompt or Terminal window, including the time it takes for each hop to respond.
To stop the Traceroute command, press Ctrl+C.
In this example, the Traceroute command traced the network path from the computer to the Google server associated with www.google.com.
Each line of the output represents a hop along the network path, with the first column showing the hop number, the second column showing the round-trip time for each hop in milliseconds, and the third column showing the IP address of the device at each hop.
Tracing route to www.google.com [172.217.11.196] over a maximum of 30 hops:

1   1 ms     1 ms     1 ms  192.168.1.1
2   8 ms     8 ms     9 ms  10.1.10.1
3   10 ms    11 ms    10 ms  68.85.106.245
4   13 ms    12 ms    14 ms  68.85.108.61
4   11 ms    12 ms    12 ms  68.86.90.5
5   19 ms    20 ms    19 ms  68.86.85.142
6   29 ms    29 ms    28 ms  72.14.219.193
7   29 ms    28 ms    28 ms  108.170.245.81
8   29 ms    29 ms    28 ms  216.239.47.210
9   29 ms    28 ms    28 ms  172.217.11.196

Trace complete.
Here are some scenarios using traceroute to troubleshoot network latency (the following commands are different on mac and linux):
Download Obkio's free Complete Guide to Traceroutes to learn to identify network problems with the most popular network troubleshooting tool for IT Pros.
Download Now

Traceroute the Local Host: Start by performing a traceroute to the local host to ensure that your computer is functioning correctly. Type traceroute localhost in the command prompt or terminal to check if the response time is within an acceptable range. If the response time is high, it could indicate an issue with your computer's network adapter or other hardware problems.
Traceroute the Default Gateway: Traceroute the default gateway to verify that your computer can communicate with the local network.
Type traceroute <default gateway IP address> in the command prompt or terminal. If the response time is high or there are lost packets, it could indicate issues with the local network or router.
Traceroute a Remote Host: Traceroute a remote host on the internet to check if latency issues are due to the network infrastructure or the remote host.
Type traceroute <remote host IP address> in the command prompt or terminal. The output will display the response time and the IP address of each router the traceroute passes through. If there is a high response time at a specific router, it could indicate an issue with that router or network segment.
Traceroute ICMP Ping: Use the traceroute command with the -I flag to perform an ICMP ping and identify the specific point where latency is occurring.
Type traceroute -I <remote host IP address> in the command prompt or terminal. The output will display the response time and the IP address of each router the traceroute passes through. If there is a high response time at a specific router, it could indicate an issue with that router or network segment.
Traceroute UDP Probe: Use the traceroute command with the -U flag to perform a UDP probe and identify the specific point where latency is occurring.
Type traceroute -U <remote host IP address> in the command prompt or terminal. The output will display the response time and the IP address of each router the traceroute passes through. If there is a high response time at a specific router, it could indicate an issue with that router or network segment.
These scenarios using traceroute can help troubleshoot network latency issues and identify specific points of failure in the network infrastructure. It's important to use multiple tools and tests to diagnose latency issues and ensure that your network is running smoothly.
The Traceroute command can help identify potential sources of latency by showing the round-trip time for each hop along the network path. Note that the actual round-trip time may vary depending on a variety of factors, including network congestion and the distance between the computer and the server.
Additionally, Traceroute may not always provide an accurate measurement of true network latency due to factors such as network congestion or device processing times.
Learn how to use Obkio Vision’s Visual Traceroute tool to troubleshoot network problems with traceroutes in your LAN, WAN, and everything in between.
Learn more

- Difficulty : Hard
- Time : 1 Hour
- Accuracy : Good
- Troubleshooting : Good
- Monitoring : Limited
Network analyzers can provide a detailed view of network traffic, including latency metrics. By capturing and analyzing packets of data, you can identify patterns and trends that may indicate latency issues.
Here is a list of popular network analyzers:
- Wireshark: This is a free and open-source network analyzer that can capture and analyze packets in real-time. It supports a wide range of protocols and features a user-friendly interface.
- Microsoft Network Monitor: This is a free network analyzer from Microsoft that can capture and analyze packets on Windows-based systems. It includes a user-friendly interface and supports a range of protocols.
- Colasoft Capsa: This is a network analyzer that can capture and analyze packets in real-time. It includes features like protocol analysis, traffic analysis, and network diagnosis.
- Nmap: This is a free and open-source network monitoring tool that can be used as a network analyzer. It can identify hosts and services on a network and provide information on network performance.
- NetWitness: This is a network analyzer that can capture and analyze packets in real-time. It includes features like deep packet inspection, application analysis, and network forensics.
These are just a few examples of the many network analyzers available. The best one for you will depend on your specific needs and requirements.
Network analyzers are powerful tools that can help test network latency in several ways. Here are some of the ways that network analyzers can be used to test network latency:
Packet Capture: Network analyzers can capture packets traveling across the network and analyze them for latency issues. By looking at the time stamps on packets, network analyzers can identify the latency between devices on the network and pinpoint where delays are occurring.
Protocol Analysis: Network analyzers can analyze network protocols to identify any issues that may be causing latency problems. This includes analyzing protocol-specific features like flow control and congestion avoidance, which can impact latency.
Traffic Generation: Network analyzers can generate traffic on the network to simulate real-world conditions and test network latency under different load conditions. By generating traffic, network analyzers can identify where latency issues occur and how they impact the network.
Network Simulation: Network analyzers can simulate network traffic to test network latency in a controlled environment. This allows network administrators to test different scenarios and identify potential latency issues before they occur in the real world.
Network Visualization: Network analyzers can provide a visual representation of network traffic and latency, allowing network administrators to quickly identify potential issues and take corrective action.
In summary, network analyzers are essential tools for testing network latency because they can capture packets, analyze protocols, generate traffic, simulate networks, and provide network visualization.
By using these tools, network administrators can quickly identify and troubleshoot latency issues, ensuring that their network is running smoothly and providing the best possible experience for users.
- Difficulty : Medium (or Easy with Obkio <3)
- Time : 1 Hour
- Accuracy : Excellent
- Troubleshooting : Excellent
- Monitoring : Excellent

Network performance monitoring tools are essential for testing network latency because they provide a comprehensive view of network performance and can detect even minor issues that can impact the user experience. These tools allow you to continuously monitor latency values and provide real-time network monitoring alerts when there are problems.
Additionally, they can help you diagnose issues and troubleshoot problems more quickly, reducing the time it takes to resolve issues and minimize downtime.
With network performance monitoring tools, you can gain a deeper understanding of your network, optimize its performance, and ensure that your users have the best possible experience.
There are several reasons why a network performance monitoring tool is essential for latency problems, including:
Continuous Monitoring: Network performance monitoring tools can continuously monitor network latency values, allowing you to detect issues as soon as they arise. This ensures that you are alerted to any latency problems before they impact the user experience.
Real-Time Alerts: Network performance monitoring tools can provide real-time alerts when latency exceeds certain thresholds, ensuring that you can take immediate action to address the issue.
Accurate Diagnostics: Network performance monitoring tools can accurately diagnose the cause of latency problems, allowing you to identify the root cause of the issue and take appropriate tests to address it.
Troubleshooting Assistance: Network performance monitoring tools can assist with troubleshooting by providing detailed information on network latency patterns and trends. This information can help you identify potential sources of latency problems and take corrective action.
Performance Optimization: Network performance monitoring tools can help you optimize network performance by identifying areas of the network where latency is occurring. With this information, you can make adjustments to network routing, increase bandwidth, and reduce congestion, improving overall network performance.
SLA Compliance: Network performance monitoring tools can help ensure that you are meeting your service level agreements (SLAs) for network latency. By monitoring latency values, you can ensure that you are meeting your SLAs and avoid any penalties for non-compliance.
In summary, a network performance monitoring tool is essential for latency problems because it provides continuous monitoring, real-time alerts, accurate diagnostics, troubleshooting assistance, performance optimization, and service or Internet SLA compliance. These features help ensure that your network is running smoothly and that your users have the best possible experience.
If you're dealing with latency issues on your network, it's important to test latency accurately to understand the extent of the problem. Latency issues can lead to slower response times, but how can you determine the severity of the problem?
One of the most precise ways to test latency is to use a Synthetic Network Performance Monitoring Software, such as Obkio. This software continuously tests latency by using Network Monitoring Agents in key network locations, simulating network traffic with synthetic traffic, and sending packets every 500ms (the round trip time it takes for data to travel). By doing this, Obkio can catch latency issues affecting VoIP (VoIP latency), UC applications, and more.
The first step to effectively testing your network latency is deploying a reliable Network Performance Monitoring (NPM) tool like Obkio. Obkio simplifies the process of monitoring latency by providing a quick and seamless deployment process, making it accessible even for users with minimal technical expertise.
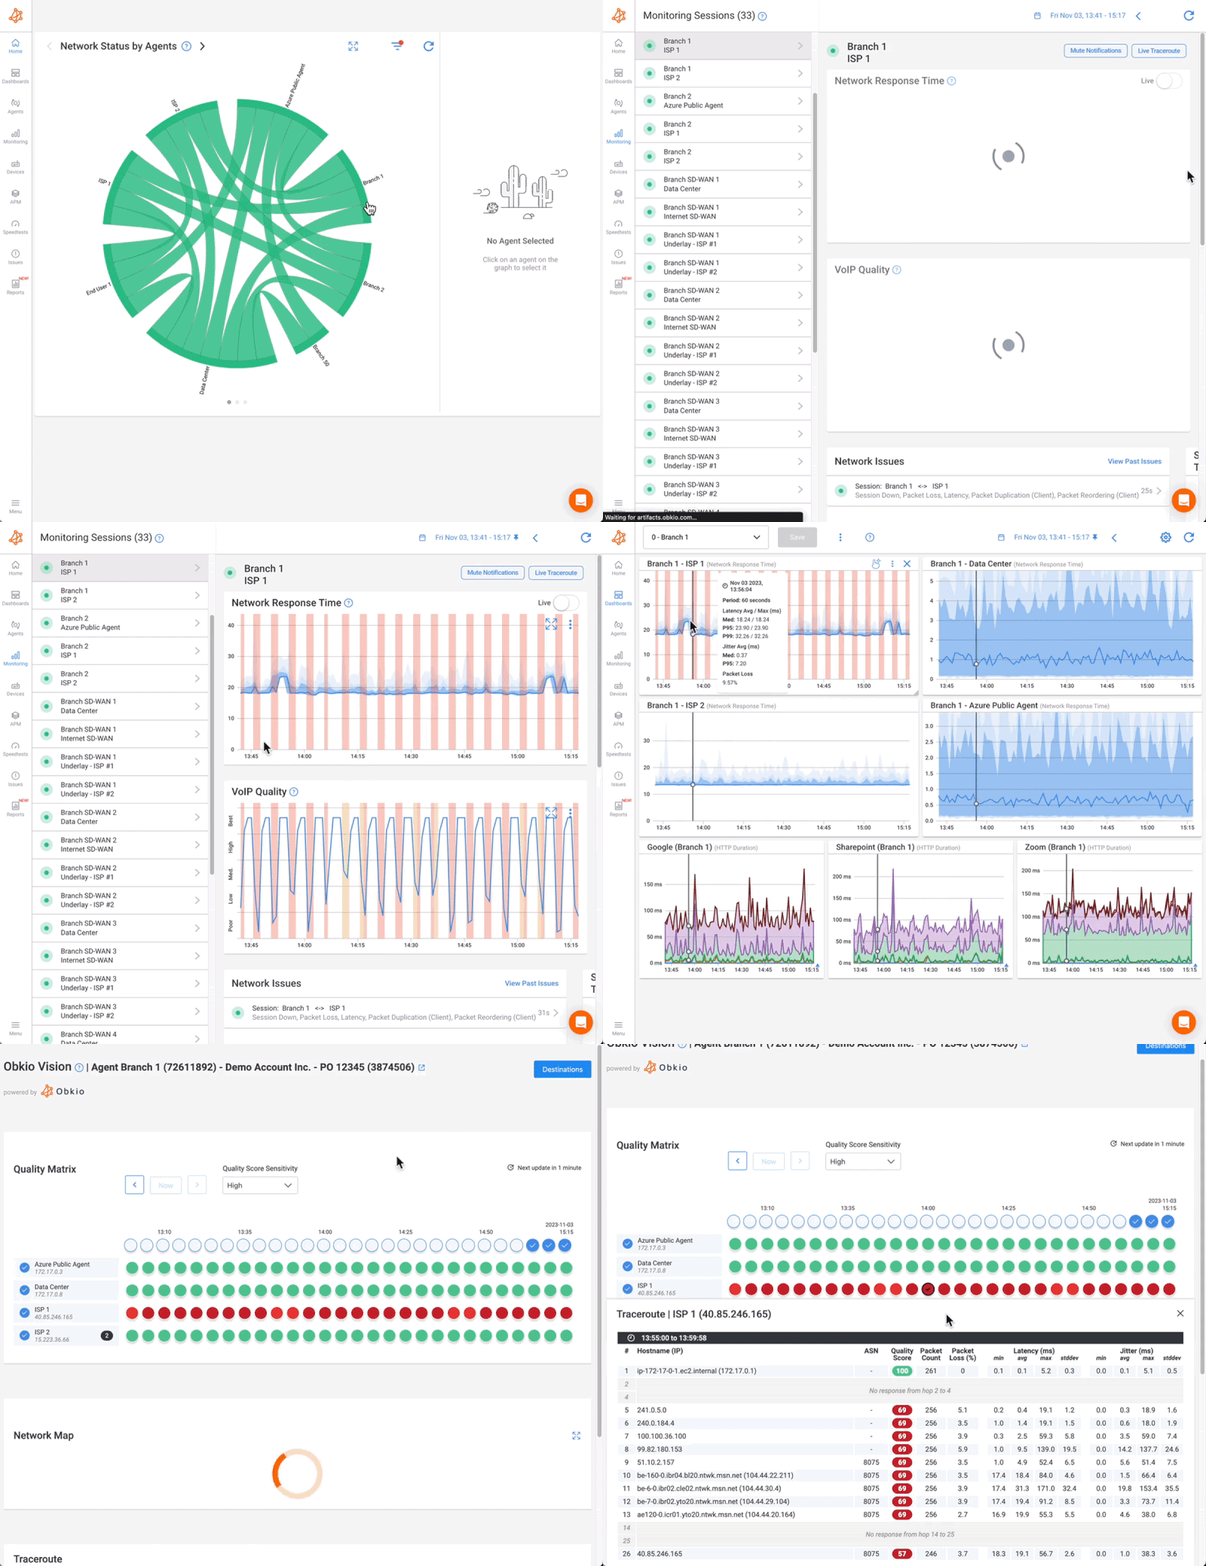
A well-deployed monitoring tool ensures accurate, consistent, and actionable insights into your network's performance. Without this initial step, it's impossible to gather the detailed metrics needed to identify and troubleshoot latency issues.
Obkio is designed for hassle-free deployment to help you get started quickly:
- Sign Up: Create an account to start Obkio's free 14-day trial
- Install Agents: Deploy monitoring agents in strategic locations within your network, such as on-site, in the cloud, or at remote locations. These agents continuously measure network performance metrics, including latency.
- Connect & Configure: Set up monitoring sessions between agents to simulate real traffic and gain insights into latency across different segments of your network.
- Start Monitoring: Begin receiving real-time data and historical performance trends within minutes.
- User-Friendly Interface: Simple and intuitive setup for users at all technical levels.
- Flexible Deployment Options: Choose from hardware, software, or cloud-based agents based on your network needs.
- No Disruptions: Deploy agents without interrupting your current network operations.
Obkio offers a free trial so you can experience the tool’s capabilities before committing. During the trial period, you can:
- Test network latency and other metrics.
- Identify performance issues affecting critical applications.
- Evaluate how Obkio integrates with your existing network setup.
With Obkio, deploying a Network Performance Monitoring tool is not just the first step—it’s a leap towards improved network performance and reduced latency. Take advantage of the free trial to see the difference for yourself!

If you're experiencing consistent delays or unusual spikes in latency when measuring network performance, these could be indications of significant performance issues that require attention.
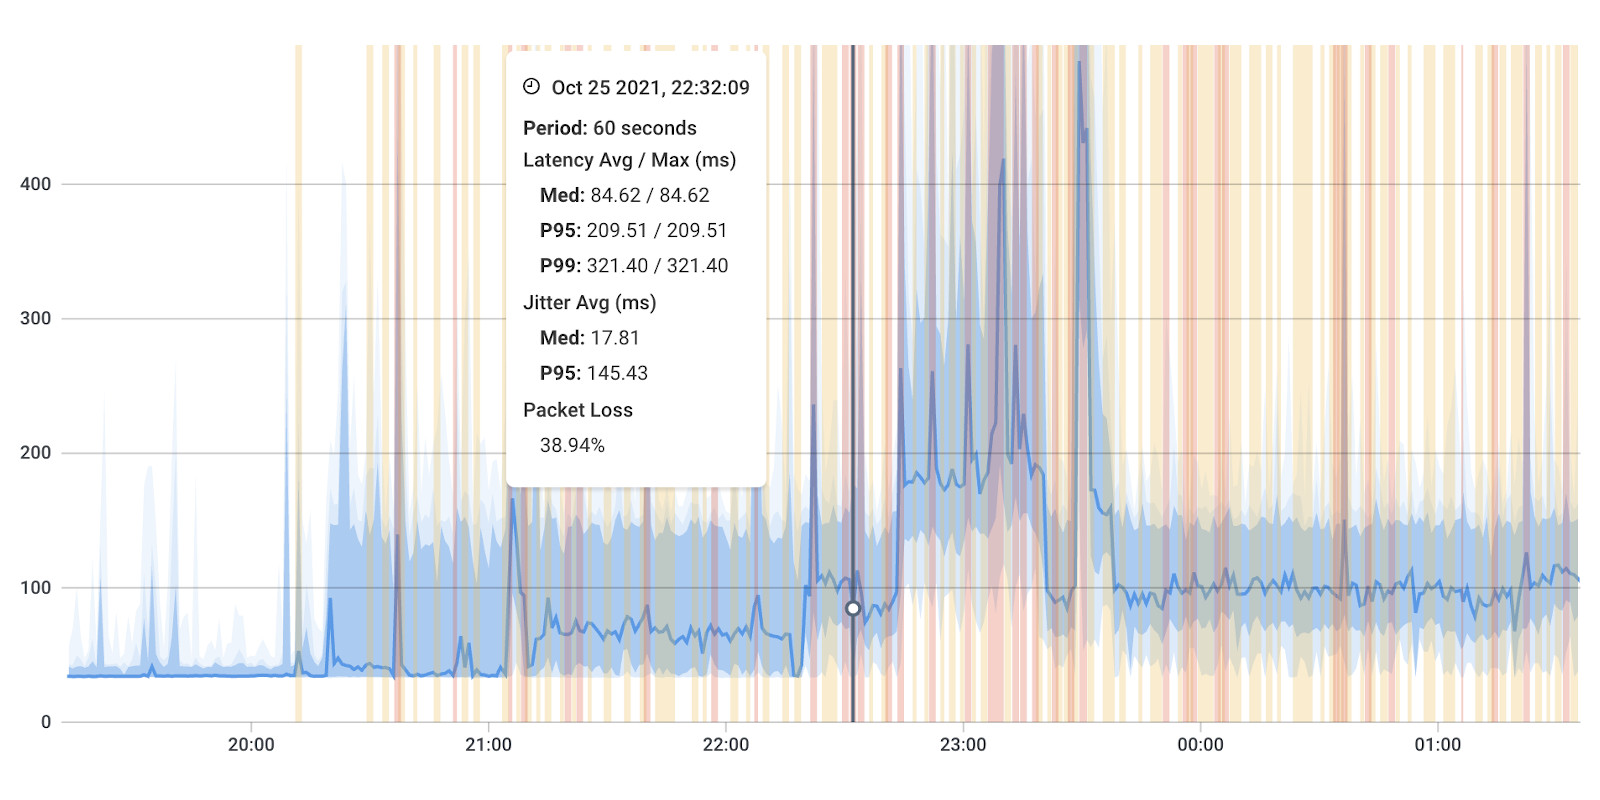
Obkio's Network Monitoring Solution offers a reliable way to test network latency by sending and monitoring data packets through your network every 500ms using Network Monitoring Agents. These Agents continuously test the time it takes for data to travel across your network, allowing you to identify any problematic areas.
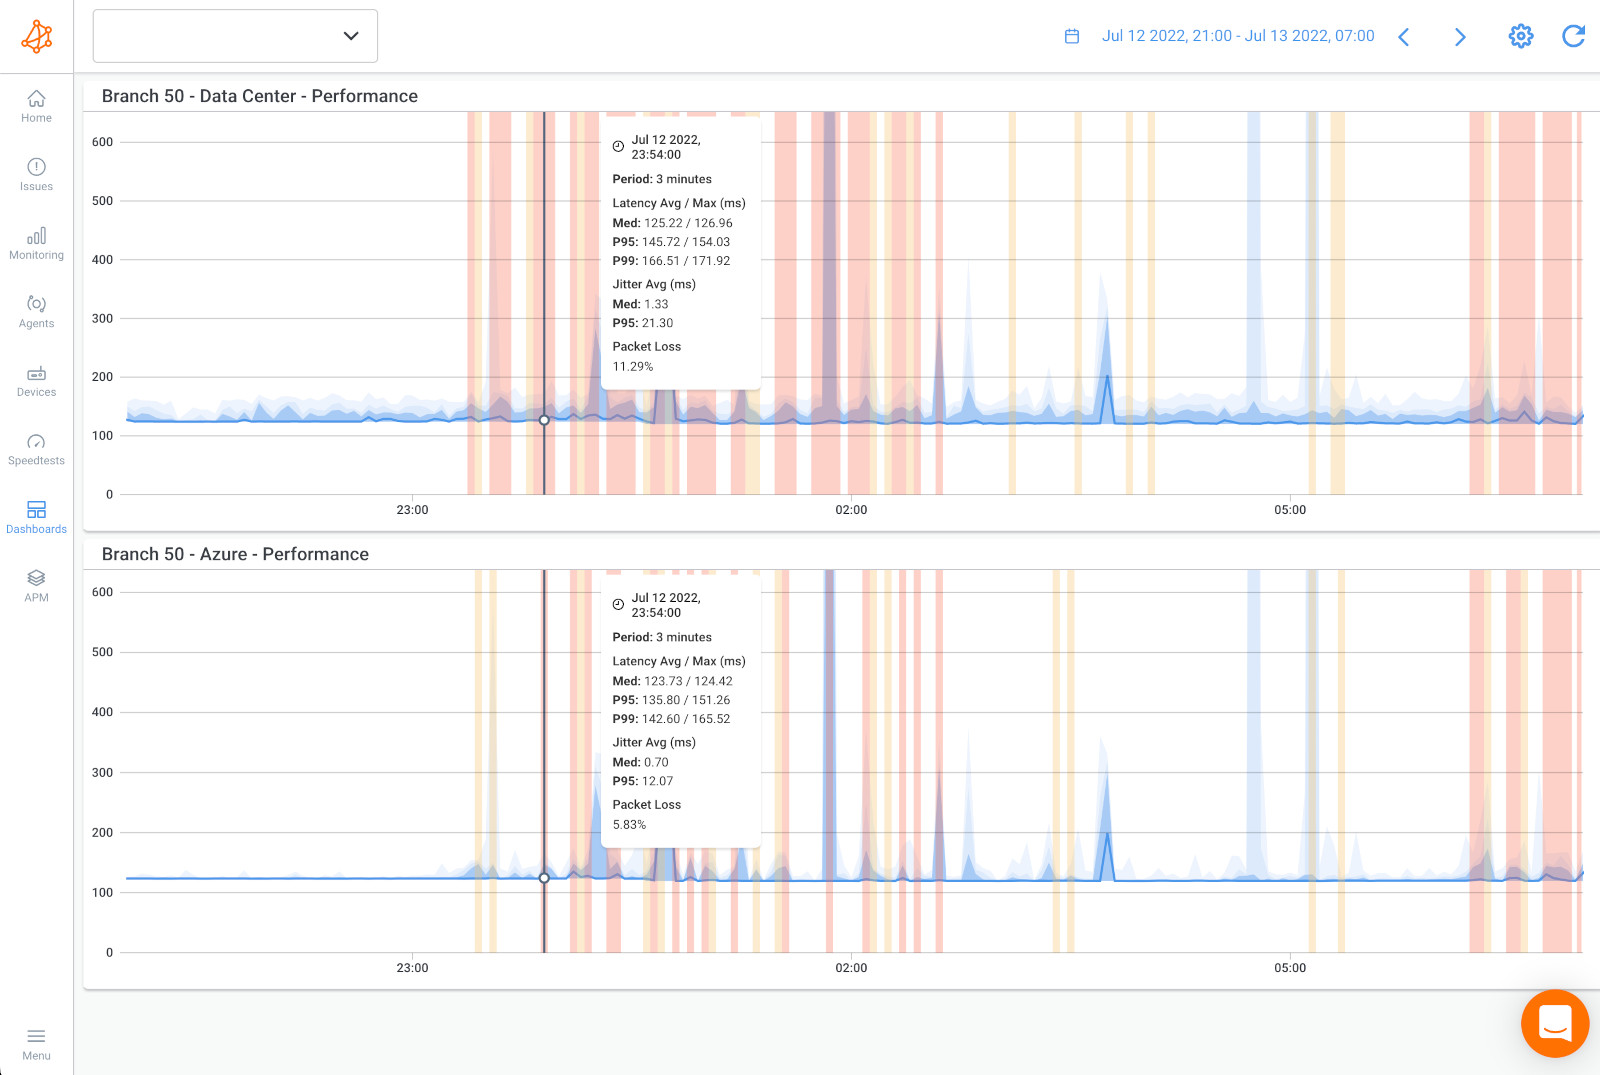
With Obkio, you can even test network latency between your head office and the Microsoft Azure cloud, or between Azure and your data center. This means you can monitor latency in different areas of your network and identify any issues that require attention.
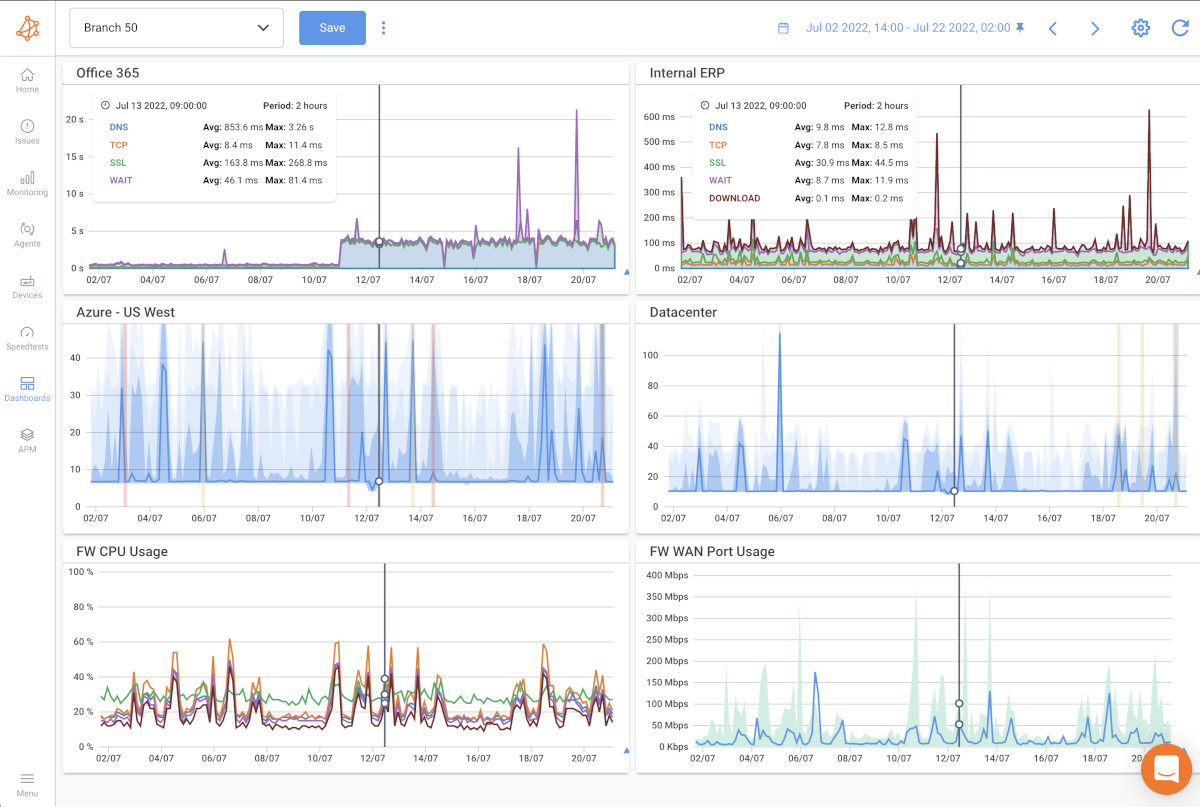
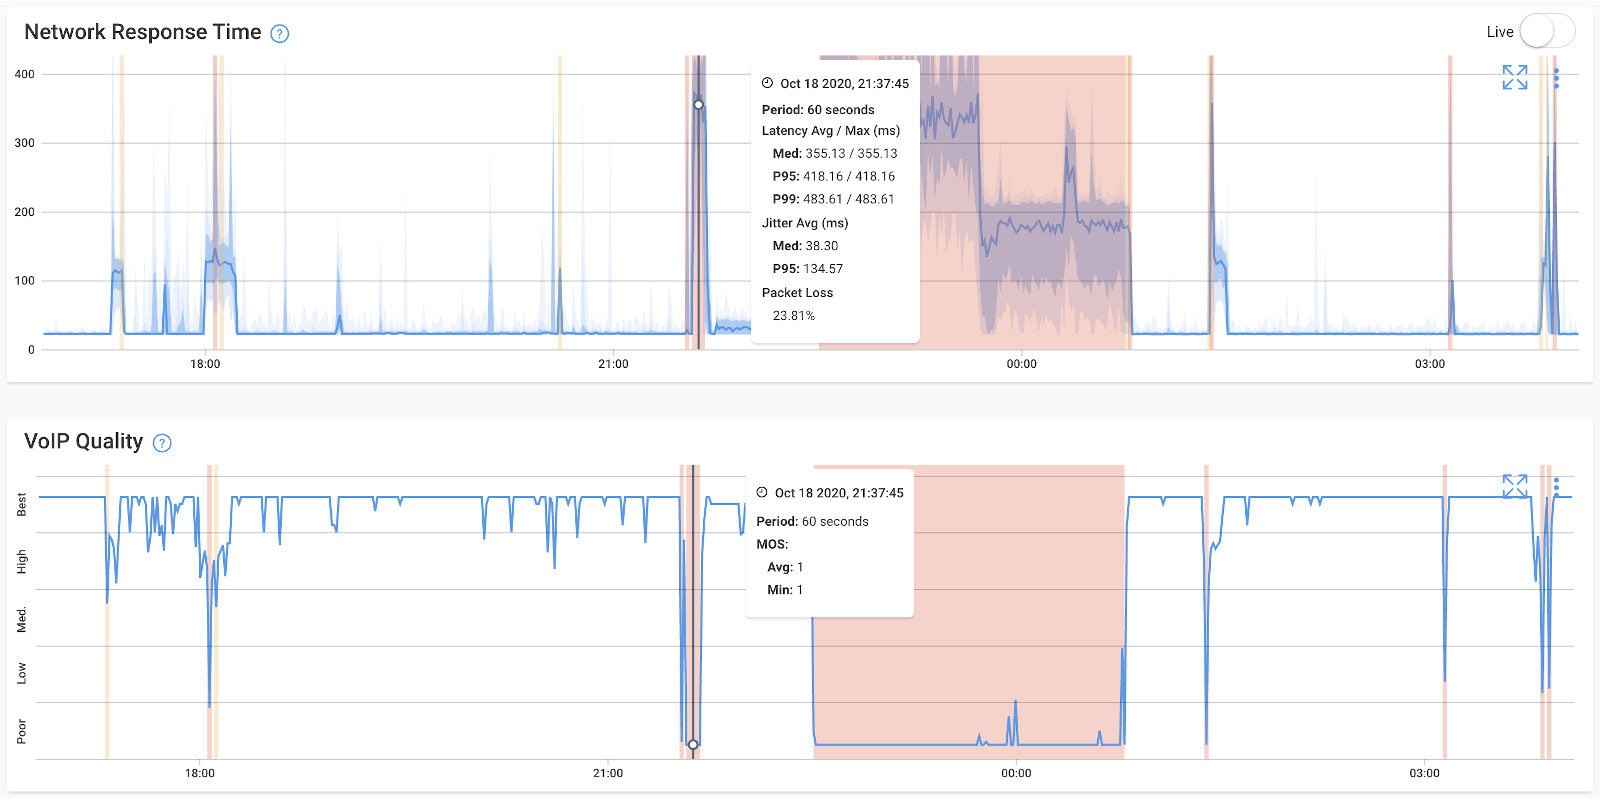
After setting up your Monitoring Agents for network latency monitoring, they will continuously test metrics like latency test and collect data that you can easily view and analyze on Obkio's Network Response Time Graph.
With Obkio, you can test network latency throughout your network with updates every minute. This allows you to identify potential issues and troubleshoot them quickly.
Moreover, Obkio enables you to drill-down to identify the root cause of latency issues, their location, and how many network locations they're affecting.
This helps you to gain a comprehensive understanding of the latency problem and address it accordingly.

Measuring network latency may not sound like the most exciting thing in the world, but trust us, it's crucial to keep your network running smoothly! So let's get down to it - when it comes to latency, there are different levels you need to be aware of to prioritize troubleshooting.
A "good" network latency result is typically anything under 100 milliseconds. That's less time than it takes to snap your fingers! This speed is acceptable for most applications, including web browsing, email, and file transfers.
On the other hand, a "bad" network latency result is typically anything over 100 milliseconds. As latency increases, your user experience can become increasingly frustrating - especially for applications that require real-time data transmission, like video conferencing.
But wait, there's more! A "poor" network latency result is anything over 100 milliseconds. Yikes! That's enough time to make a sandwich while you wait for your data packets to travel from one point to another. High latency can lead to significant user frustration and impaired application performance.
Of course, acceptable latency results can vary depending on the specific application or industry. For example, financial trading platforms may require extremely low latency, with acceptable or good latency rates at less than 10 milliseconds.
In general, network administrators aim to keep latency as low as possible to ensure optimal network performance and user experience. They can achieve this by optimizing network routing, increasing bandwidth, and reducing congestion on the network.
Discover the importance of network response time and how Obkio's Network Monitoring tool facilitates network response time monitoring & optimization.
Learn more

Network latency, or the delay in the transmission of data between two devices over a network, can be caused by a variety of factors. Here are some of the most common causes of network latency:
Distance: The farther data has to travel between two devices, the longer it takes to reach its destination, resulting in higher latency.
Network congestion: When there is heavy network traffic, data packets can get delayed or lost, leading to higher latency.
Network equipment: Outdated or improperly configured routers, switches, and other network equipment can contribute to latency issues.
Bandwidth limitations: When the available bandwidth of a network is insufficient to handle the amount of data being transmitted, latency can increase.
Protocol overhead: Certain network protocols, such as TCP/IP, require additional data to be transmitted with each packet, which can contribute to latency.
Wireless interference: In wireless networks, interference from other devices or environmental factors (such as walls or other obstacles) can cause data packets to be delayed or lost, leading to higher latency.
Processing delays: Network devices such as routers and switches may need time to process and route data packets, which can add to latency.
By identifying the root causes of network latency, IT professionals can take steps to address these issues and improve the performance of their networks.
Identifying the root causes of network latency is crucial to improving the performance and reliability of your network. However, pinpointing the source of latency can be a complex and time-consuming process.
In this section, we will outline several steps that IT professionals can take to find the root causes of network latency.
By conducting a thorough audit of your network infrastructure, using monitoring tools to analyze network traffic, and testing latency with diagnostic tools, you can gain valuable insights into where latency is occurring and take steps to address these issues.
To find the root causes of network latency, you can take several steps, including:
Conducting a network audit: A thorough audit of your network infrastructure can help identify outdated equipment, improper configurations, or other issues that may be contributing to latency.
Using network monitoring tools: Network monitoring software can provide real-time data on network performance, including latency metrics. This can help you identify patterns and trends that may indicate the cause of latency issues.
Testing network components: Testing individual network components such as routers, switches, and cables can help pinpoint where latency is occurring.
Analyzing network traffic: Examining network traffic patterns can help identify where congestion is occurring, which can contribute to latency.
Testing latency with diagnostic tools: There are a variety of network diagnostic tools available that can test network latency and help identify where delays are occurring.
Once you have identified the root causes of network latency, you can take steps to address these issues. This may involve upgrading equipment, optimizing network configurations, or implementing traffic management techniques to reduce congestion. Regular monitoring and testing can help ensure that your network remains optimized for optimal performance.
It's time to talk about one of the most important things in the world of networking - latency! And trust me, it's not just a fancy word that tech geeks use to sound cool. It's actually a crucial metric that can affect the user experience.
So, why should you care about testing latency? Let me count the ways:
Keep an Eye on Your Network Performance: Testing latency helps you understand if data is moving across your network like a well-oiled machine or if it's taking a leisurely stroll. With Obkio, you can stay on top of your latency values and identify any problems affecting data transmission in your network.
Spot Network Issues Before They Get Out of Hand: Testing latency allows you to catch network problems before they turn into a hot mess. Consistent delays or odd spikes in delay time are a red flag that something's not right, so you can take action ASAP.
Create a Baseline for Awesome Performance: Testing network latency lets you compare performance data over time and set a benchmark for optimal performance. Plus, you can see how changes impact your network and make adjustments as needed.
Happy Users = Happy Life: Latency can make or break the user experience of real-time applications. By Testing network latency, you can spot potential issues that could impact your users and take steps to reduce latency and improve application performance.
Optimize Your Network Like a Boss: Testing network latency helps you pinpoint areas where latency is causing problems. With this info, you can optimize network routing, increase bandwidth, and reduce congestion to make your network run like a dream.
Stay SLA Compliant: Service level agreements (SLAs) often include guarantees on network latency. By Testing network latency, you can make sure you're meeting these guarantees and avoid any penalties for non-compliance.
Troubleshoot Like a Pro: When users report issues with application performance, Testing network latency can help you identify if latency is to blame. If it is, you can take steps to reduce latency and get your application back on track.
Plan for the Future: Testing network latency over time lets you spot trends and plan for future capacity requirements. By understanding how network latency changes as traffic increases, you can make sure you're ready to handle whatever the future throws at you.
So there you have it, folks! Regularly Testing network latency is the key to keeping your network healthy and happy. And don't forget, it's not the only metric that matters - Packet Loss and Jitter are important too!
To calculate latency, you need to measure the round-trip time it takes for data packets to travel from one point in the network to another point and back again. Here are the steps to calculate latency:
- Choose two points in the network that you want to measure the latency between. These could be two devices, two network segments, or two different locations on the Internet.
- Send a test packet from one point to the other. The packet should contain a timestamp indicating when it was sent.
- Once the packet reaches the other point, it should be immediately sent back to the original point.
- When the original point receives the packet back, it should compare the current timestamp with the timestamp that was included in the packet. The difference between these two timestamps is the round-trip time.
- Divide the round-trip time by two to get the one-way latency.
For example, if the round-trip time is 100 milliseconds, the one-way latency would be 50 milliseconds.
To get more accurate latency measurements, you can repeat this process multiple times and take an average of the results. You can also use network performance monitoring software, like Obkio, to automate this process and get real-time latency measurements across your entire network.
Let's say you want to measure the latency between your computer and a web server. You start by sending a test packet from your computer to the web server. The packet contains a timestamp indicating the exact time it was sent.
Once the web server receives the packet, it immediately sends it back to your computer. When your computer receives the packet, it compares the current time to the timestamp that was included in the packet to calculate the round-trip time.
Let's say the round-trip time is 120 milliseconds. To get the one-way latency, you would divide this number by two, which gives you 60 milliseconds.
So in this example, the latency between your computer and the web server is 60 milliseconds. If you perform this calculation multiple times and take an average of the results, you can get a more accurate measurement of the latency. Calculating Latency in a Complex Network Architecture: Steps and Tools to Identify and Optimize Latency in Your Network
Calculating latency in a complex network architecture can be a bit more challenging than in a simple network setup. Here are a few steps you can take to calculate latency in a complex network:
- Identify the different components of your network architecture, including routers, switches, firewalls, load balancers, and servers.
- Map out the network paths between different components. This will help you identify the different segments of your network where latency might be introduced.
- Use network performance monitoring software, like Obkio, to measure latency across different segments of your network. This can help you identify which segments are causing the most latency and where you should focus your troubleshooting efforts.
- Use traceroute tools to trace and monitor network paths between two points and identify any network segments where latency might be introduced. Traceroute tools can also help you identify any bottlenecks in your network that might be causing latency.
- Monitor network traffic to identify any congestion or bandwidth issues that might be causing latency. This can help you optimize your network to reduce latency.
By following these steps, you can get a better understanding of the latency in your complex network architecture and take steps to optimize your network and improve performance.
It's worth nothing that although the round-trip time and one-way latency calculation method is the most popular and widely accessible approach for determining network performance across most enterprise use cases, other techniques exist for measuring one-way latency.
These alternatives often involve the use of specialized hardware that is synced with GPS or atomic clocks at both ends of the network connection, providing a higher degree of precision.
However, these methods are typically more complex and costly, and are primarily utilized by telecommunications companies and mobile phone networks.
Regardless of the chosen methodology, it's critical to select a technique that produces accurate results for informed decision-making on network performance while also remaining practical and cost-effective for the enterprise's requirements.
If you're looking for a more accurate and automated way of testing network latency, look no further than Obkio's Network Monitoring Tool. With Obkio, you can gain precise insights into your network's latency performance with automated tests that provide real-time data and actionable insights. Say goodbye to manual latency testing and hello to streamlined, efficient network monitoring with Obkio.
Put It to the Test: Trying Is the Ultimate Way to Learn!
Networks may be complex. But Obkio makes network monitoring easy. Monitor, measure, pinpoint, troubleshoot, and solve network problems.
- 14-day free trial of all premium features
- Deploy in just 10 minutes
- Monitor performance in all key network locations
- Measure real-time network metrics
- Identify and troubleshoot live network problems

Let's face it, measuring network latency may not be the most exciting thing in the world. But it doesn't have to be all serious and technical!
To lighten the mood, we've compiled some latency jokes that will hopefully make you smile. So sit back, take a break from monitoring your network, and enjoy a good laugh.
- Why did the network administrator go to the doctor? Because they were experiencing latency issues!
- What's the fastest way to get over network latency? Upgrade your internet speed!
- Why did the data packet take a long time to cross the network? Because it stopped for coffee at every router!
- Why do network engineers love low latency? Because it's like winning a race - the faster, the better!
- What do you call a network with high latency? A slowpoke network!
- How do you know if your network is experiencing latency issues? When the loading bar is taking forever to complete and you have time to make a cup of coffee in between!
- Why did the gamer quit playing online? Because their network latency was so high, they kept losing!
- Why did the network administrator break up with their partner? Because they were tired of waiting for packets to arrive!
I hope these jokes brought a smile to your face!


 Obkio Blog


