












 Obkio Blog


 Subscribe
Table of Contents
Table of Contents
A firewall running low on memory rarely fails all at once. It degrades first. Connections drop intermittently, policies take longer to process, and by the time the device becomes unresponsive, the problem has been building for days or weeks.
This article walks through what firewall memory usage actually means, what causes it to climb, how to spot the symptoms early, and how to troubleshoot and fix it before it takes your network down with it.
What Is High Memory Usage on a Firewall? 
High memory usage on a firewall means the RAM consumed by its operating system, session table, inspection engines, and logging processes is approaching the device's total capacity.
A firewall holds a lot in memory at once: the state table tracking every active connection, buffers for logging, the working memory used by deep packet inspection (DPI) and intrusion prevention, and the processes running the OS itself. Memory usage is a measure of how much of that capacity is currently in use, expressed as a percentage of what the device has available.
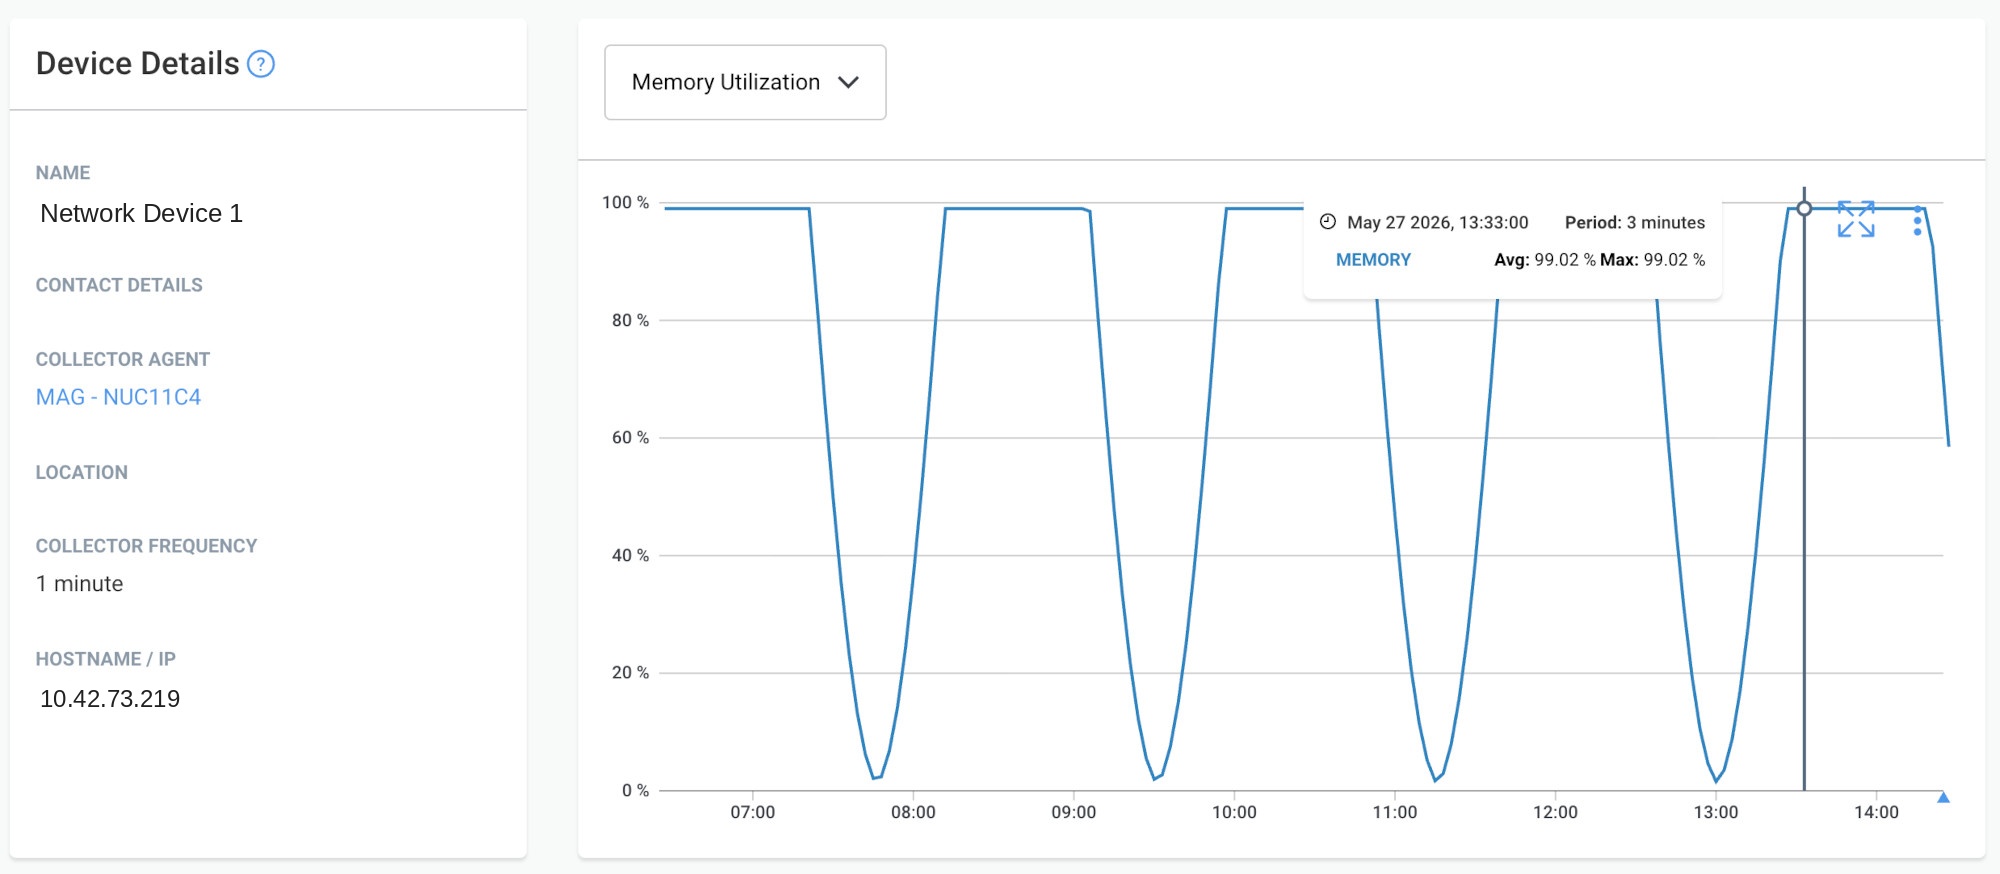
This is different from high CPU usage, and the distinction matters because the fixes aren't the same. CPU usage tells you what the firewall is actively processing right now. Memory usage tells you what it's holding onto: sessions it hasn't closed, logs it hasn't flushed, rules it's caching. A firewall can have plenty of CPU headroom and still choke on memory, because the two resources fail in different ways and for different reasons.
Most firewalls run comfortably somewhere in the 40% to 70% range under normal load. It's not the number itself that signals a problem, it's the trend. A firewall sitting at 75% and holding steady is fine. A firewall climbing from 60% to 90% over a week without a matching increase in traffic is heading toward an outage.

Learn how to monitor RAM/memory utilization on network devices using SNMP. Catch memory exhaustion before it causes outages.
Learn more

What Causes High Memory Usage on a Firewall?
Firewall memory usage climbs when the device holds more sessions, buffers, or inspection data than it has capacity for, or when a software fault prevents it from releasing memory it no longer needs.
Here are the most common causes behind firewall memory exhaustion:
1. Session table growth:
Every active connection occupies a slot in the firewall's state table. A spike in concurrent connections, from a traffic surge, a DDoS attempt, or simply more users than the device was sized for, pushes memory usage up fast.
2. Memory leaks in firmware or software:
Some firmware versions fail to fully release memory after a session closes or a process finishes. The leak is small at first and invisible day to day, but it accumulates until the device runs out of headroom.
3. Deep packet inspection, IPS/IDS, and antivirus scanning:
These features inspect traffic content, not just headers, and that inspection requires memory to buffer and analyze packets. The more security features you enable, the more memory they compete for.
4. Logging verbosity:
Verbose logging keeps more log data in local buffers before it's written or forwarded. On a firewall with limited local storage or memory allocated to logging, this alone can push usage into problem territory.
5. VPN tunnel count and encryption overhead:
Each VPN tunnel maintains its own state and encryption context. A firewall terminating dozens or hundreds of tunnels carries meaningfully more memory overhead than one handling plain traffic.
6. Undersized hardware for current traffic load:
This is the root cause behind most of the others. A firewall sized for a smaller network, or for traffic levels from a few years ago, simply doesn't have the memory ceiling to keep up as usage grows.
Why does firewall memory keep increasing even when traffic looks normal? In most cases, it's one of two things: a slow leak that has nothing to do with current traffic, or a session table that isn't releasing closed connections fast enough. Both point to the same next step, which is watching the trend over time rather than a single reading.
What Are the Symptoms of Firewall Memory Exhaustion?
A firewall running out of memory shows up as intermittent packet loss, slower policy processing, and eventually a device that stops responding to management access, well before it fully crashes.
The symptoms build gradually, which is exactly why they're easy to dismiss as "the network being slow" rather than a firewall problem:
- Intermittent packet loss or connection drops under load: The firewall starts dropping packets when memory pressure peaks, often during busy periods, then appears to recover.
- Slower policy and rule processing: With less memory to work with, the firewall takes longer to evaluate rules against traffic, adding latency that's hard to pin down to a single cause.
- Unresponsive management access: In advanced cases, the device becomes difficult or impossible to reach via its management interface, which is usually the clearest sign that memory exhaustion has become critical.
This pattern is exactly what Obkio Insights is built to catch. Insights (now in Beta) is Obkio's automatic network diagnostics engine, and one of the root causes it identifies out of the box is high memory usage on a firewall facing the Internet.
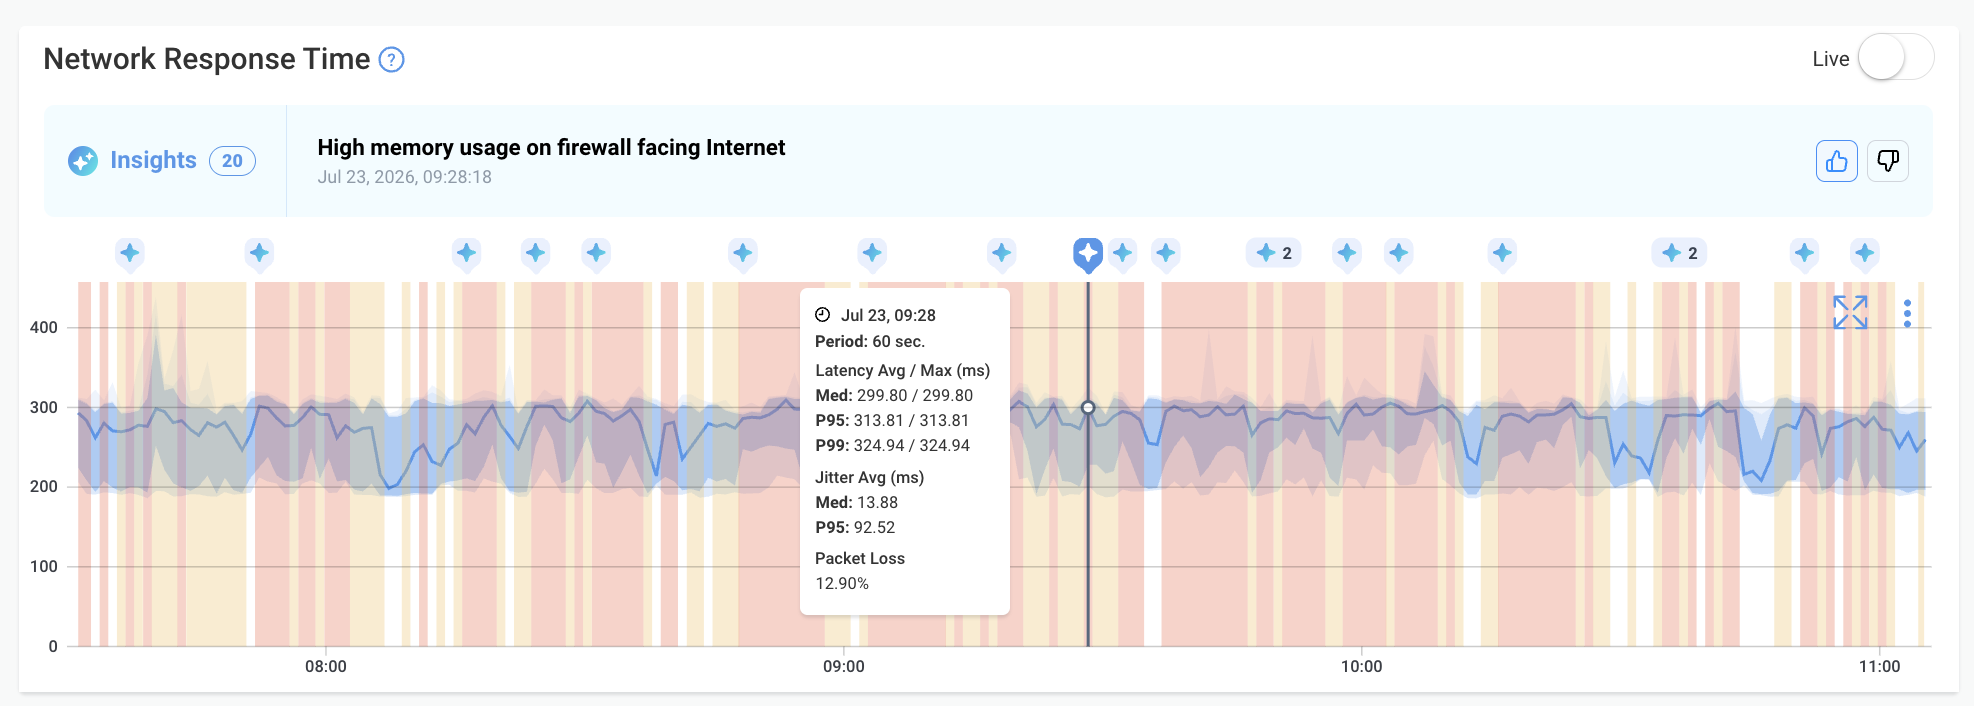
The moment a monitoring session detects degraded network response time or packet loss, Insights correlates that event against your firewall's SNMP metrics from the same window and flags memory as the likely cause, right on the graph, with no manual digging required.

How Do You Check Firewall Memory Usage?
Check current memory usage through your firewall's CLI or dashboard, but rely on SNMP polling over time to actually catch the leak pattern, since a single reading only tells you where memory sits right now.
Most firewall vendors expose memory usage through a CLI command or a built-in dashboard widget. The exact syntax differs by vendor, but the pattern is the same across brands: a status or resource command that returns current memory utilization as a percentage, often alongside CPU and session count.
The problem with checking manually is timing. A memory leak climbs slowly and unevenly. If you happen to check right after a reboot or during a quiet period, everything looks fine, and the leak keeps building unnoticed until it causes an outage.
This is where SNMP polling earns its place. Polling your firewall's memory OID at regular intervals, ideally every 30 to 60 seconds rather than the 5-minute industry standard, builds a trend line instead of a snapshot. A slow leak that would be invisible in a point-in-time check becomes obvious as a steadily climbing line on a graph.

Obkio's Network Device Monitoring polls every 30 seconds, 10 times faster than the industry standard, specifically so short spikes and gradual leaks don't get averaged away between checks.
- 14-day free trial of all premium features
- Deploy in just 10 minutes
- Monitor performance in all key network locations
- Measure real-time network metrics
- Identify and troubleshoot live network problems


How to Troubleshoot High Firewall Memory Usage: Step-by-Step
Confirm the issue is memory and not CPU, identify whether it's a gradual leak or a sudden spike, correlate the timing against sessions and configuration changes, then reduce load or patch the underlying cause.
Firewall Memory Utilization Troubleshooting Step 1: Confirm It's Firewall Memory Usage, Not CPU or Upstream
Before you start tuning memory settings, rule out the alternatives. High CPU usage produces similar symptoms (slow processing, dropped connections) but calls for a completely different fix.
Obkio's Network Device Monitoring pulls both metrics from the same source: a Monitoring Agent deployed inside your network polls your firewall directly over SNMP (v1, v2c, or v3) every 30 seconds, no OID configuration needed, across any brand or model, including Cisco, Fortinet, Palo Alto Networks, SonicWall, and Check Point. That gives you CPU usage, memory utilization, bandwidth utilization, device availability, and interface errors side by side, on the same timeline.
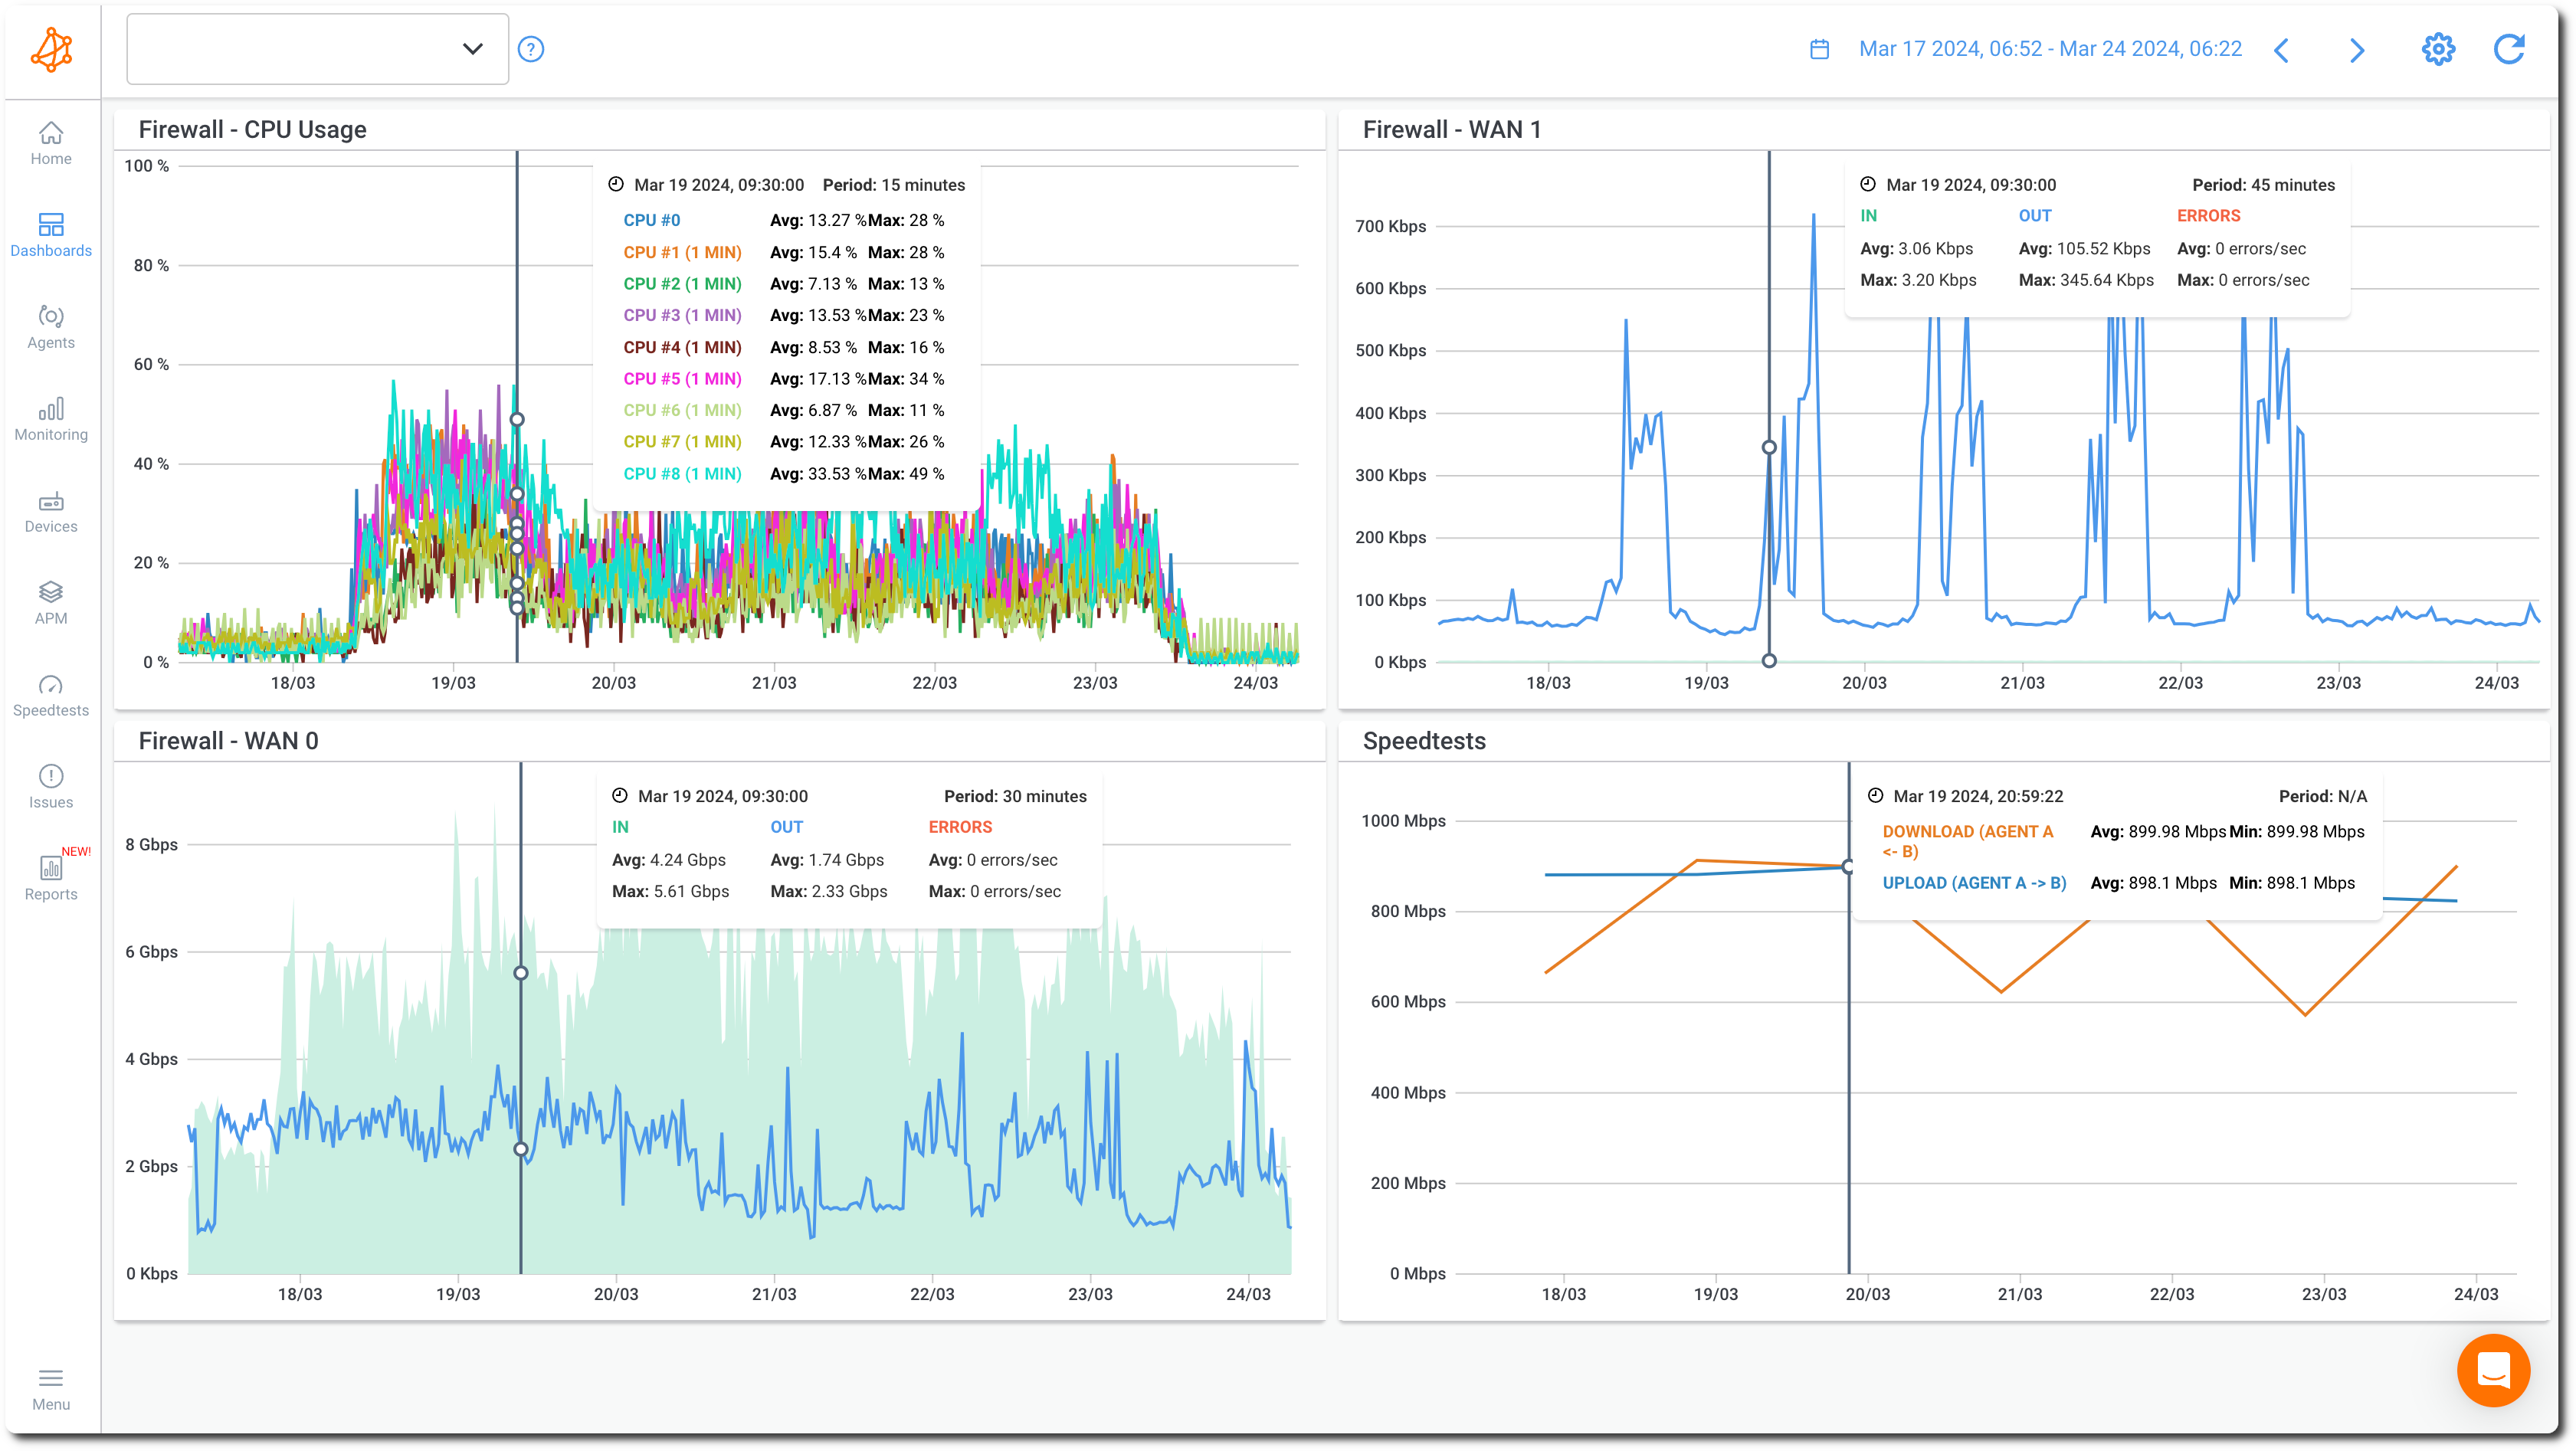
If memory is climbing while CPU stays flat, you're dealing with a memory issue specifically, not a general resource problem.
Firewall Memory Utilization Troubleshooting Step 2: Let Obkio Insights Correlate and Identify the Root Cause
This is the step that used to take a senior engineer an hour of manual data correlation, and Obkio Insights now does it automatically the moment the issue is detected.
Insights is Obkio's automatic network diagnostics engine. It runs in the background on every monitoring session, and it correlates three data sources at once: Network Performance Monitoring (NPM), SNMP Device Monitoring, and Visual Traceroute data, all from the exact time window of the event.
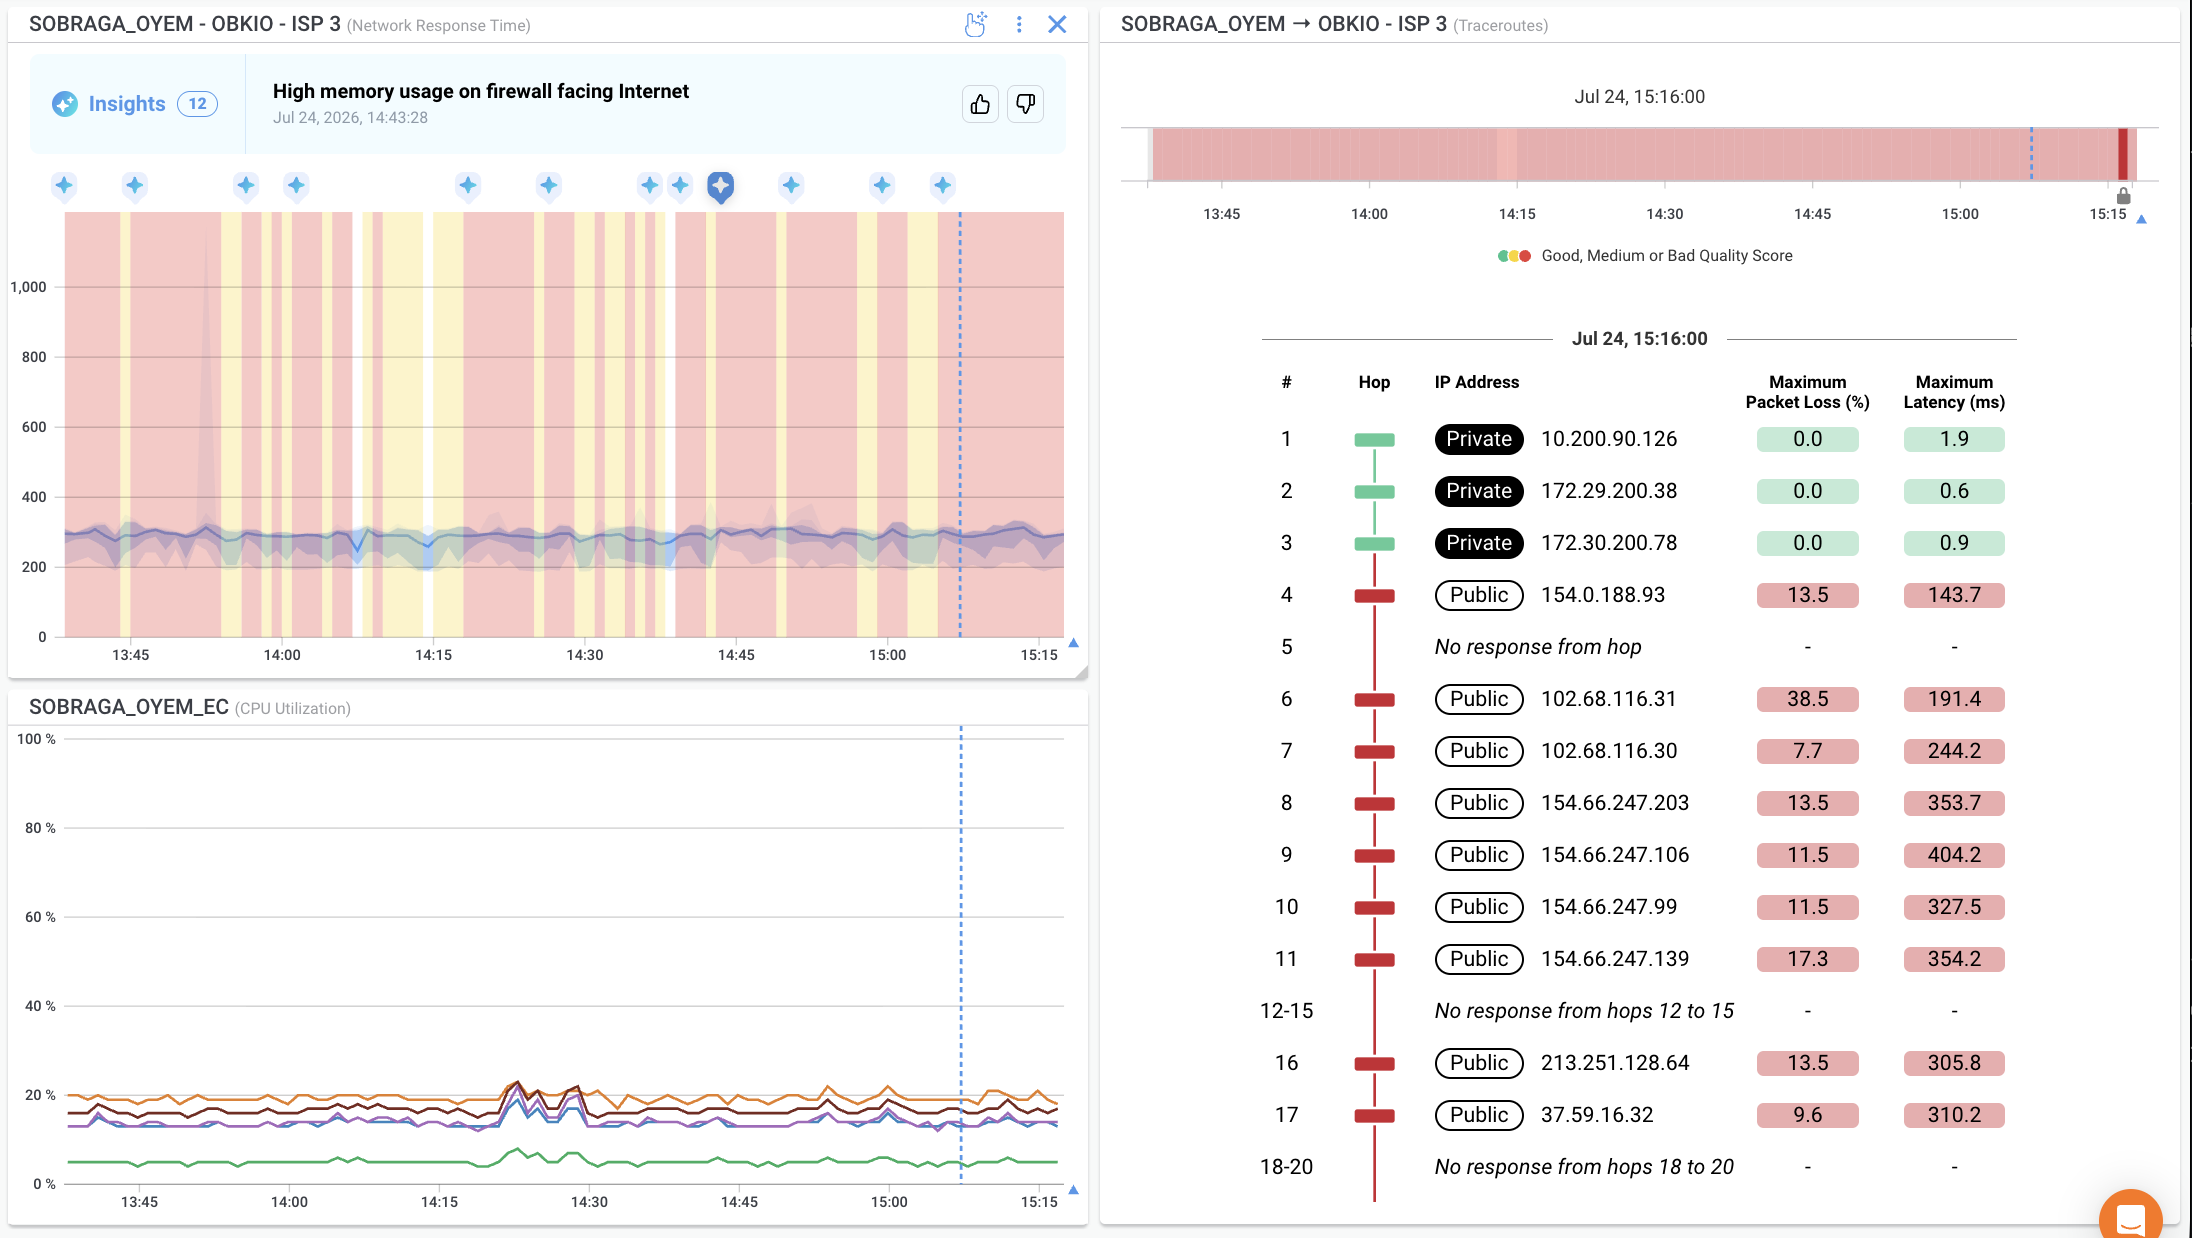
Here's what happens under the hood when a session detects degraded network response time or packet loss on a link behind your firewall:
- It rules out false positives first. Insights checks whether the Network Monitoring Agent had the system resources it needed to run its test properly. If it didn't, the issue is flagged as user-side immediately, so your team doesn't waste time chasing a network problem that isn't real.
- It examines device resource data. Insights pulls CPU, memory, and bandwidth usage from your firewall's SNMP metrics for that same window, looking for the congestion or resource constraint that lines up with the performance drop, and it names the specific device responsible.
- It cross-references traceroute data. In parallel, Insights checks Visual Traceroute data from the same period to rule out (or confirm) an ISP or LAN path issue running alongside the device problem.
The result lands as an Insights card in the Insights tab, and as a marker directly on your Network Response Time graph at the exact moment the event happened. For a memory issue specifically, the card reads something like "High memory usage on firewall facing Internet," which is the exact root cause Insights are built to catch on Internet-facing firewalls today.
One setup note: traceroute-based Insights (LAN and ISP issues) work out of the box with zero configuration. Device-based Insights for memory, CPU, and bandwidth need SNMP Device Monitoring set up first,. Once that's done, memory-related Insights run automatically from then on.
Firewall Memory Utilization Troubleshooting Step 3: Read the Diagnostic Dashboard to Separate a Firewall Memory Leak From a Spike
Click "See what led to this conclusion" on the Insights card, and Obkio opens a diagnostic dashboard built specifically for that event, no digging through separate tools required. It puts Network Response Time, VoIP Quality (MOS), and your firewall's device metrics on the same timeline, with the Insights marker showing exactly where the correlation engine drew its conclusion.
Sitting right above those graphs is Obkio's Network Quality widget, released alongside Insights. It's a colour-coded timeline strip covering your whole monitoring period, Ok, Warning, Error, or Critical, so you can see at a glance exactly when and for how long quality dropped, without reading a single latency or packet loss number.
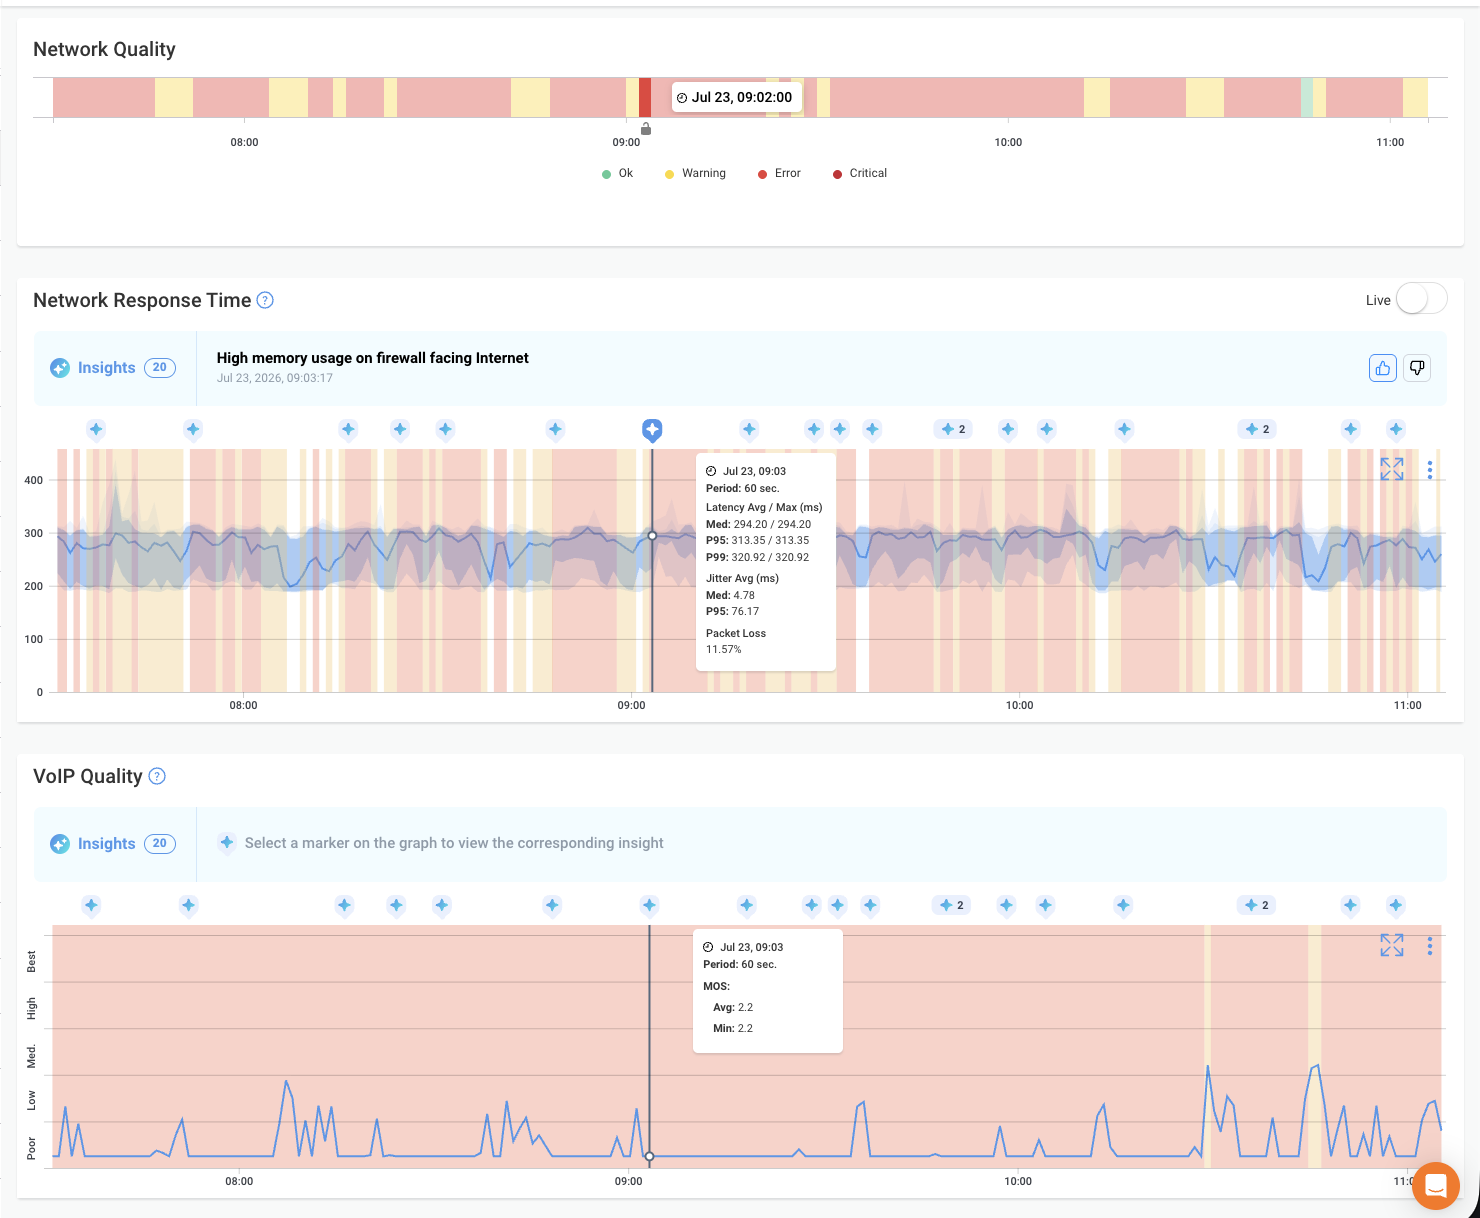
This is where you determine whether you're facing a leak or a spike, and the two look different on the graph. A steady, linear climb across the hours or days leading up to the marker points to a firmware leak that never released memory properly. A sharp, sudden jump tied tightly to the marker points to a session surge, a new VPN tunnel, or a configuration change made around that time. You need to know which one you're dealing with before the next step makes sense.
Firewall Memory Utilization Troubleshooting Step 4: Correlate Against Session Count, VPN, or DPI Changes
If the dashboard points to a spike rather than a slow leak, line it up against what else changed. Did session count jump at that hour? Was a new VPN tunnel or inspection profile added?

Deploying Network Monitoring Agents using Obkio's Sandwich Method, one on the LAN side, one at the firewall edge, one facing the Internet, gives you before-and-after traffic on both sides of the device, so you can see whether the load originated inside your network or arrived from outside it.
Firewall Memory Utilization Troubleshooting Step 5: Check Firewall Firmware Against Known-Issue Advisories
If the pattern points to a leak rather than a load problem, check your firewall vendor's release notes and known-issue advisories for your current firmware version. Memory leaks tied to specific firmware builds are common enough that most vendors document and patch them. This step alone resolves a large share of firewall memory leaks, and it's exactly what tends to be behind resource problems that look mysterious until you check the changelog.
Firewall Memory Utilization Troubleshooting Step 6: Reduce Firewall Memory Load if Hardware Is Undersized
If the device is genuinely undersized for current traffic, buy yourself time by reducing what's competing for memory: lower logging verbosity to what's actually needed, adjust session timeout values so closed connections clear faster, or narrow the scope of DPI to the traffic that actually needs it. These are mitigations, not fixes, but they can stabilize a struggling firewall while you plan a hardware upgrade, and you'll see the effect of each change reflected in the same memory graph within a polling cycle or two.
Firewall Memory Utilization Troubleshooting Step 7: Reboot Firewall as Short-Term Mitigation, Then Reassess
A reboot clears accumulated memory and buys immediate relief. That's fine as an emergency measure. But if memory climbs right back to the same danger zone within days, and Insights flags the same root cause again, the recurrence told you something important: the issue is structural, not transient. Don't treat a recurring need to reboot as the fix. Treat it as confirmation you need to patch firmware, tune configuration, or upgrade hardware.
Case Study: How Granular Polling Caught What a Firewall's Own Dashboard Missed
Station 22, a multi-site beverage distributor, trusted their firewall's built-in CPU reading of 40% for months, until 30-second SNMP polling showed the real number was far higher, and the same detection gap applies directly to memory.
Station 22's remote employees started reporting choppy Microsoft Teams and GoToMeeting calls, along with VPN slowness and disconnections. Their existing monitoring tools showed green across the board, and their firewall's own management GUI reported CPU usage at a comfortable 40 percent. Nothing on paper explained what users were experiencing.

The problem was the paper. That 40% figure came from a monitoring system polling every 5 minutes, an interval wide enough to average real spikes down to something that looks fine. Station 22 deployed Obkio's free trial: a Software Monitoring Agent on-premise, two Public Monitoring Agents in AWS and Microsoft Azure, and SNMP Device Monitoring on their headquarters firewall. Setup took 15 minutes.
Within 48 hours, the data told a different story than the firewall's dashboard had:
- Packet loss climbed alongside bandwidth usage as user activity increased through the day, visible directly in the Obkio app's graph tooltips.
- VoIP quality (MOS) dropped well below acceptable thresholds, matching the choppy call quality users had been reporting.
- Per-core CPU usage on the firewall ran well above the 40 percent shown on its own GUI, once Obkio's 30-second SNMP polling replaced the previous 5-minute interval, a 10x increase in polling frequency that caught spikes the old system had been averaging away.
The root cause turned out to be a known issue tied to their firewall's firmware version, and a firmware update resolved it immediately. This case centred on CPU, not memory, but the detection gap is identical: a device's own dashboard reports an average over a wide polling window, and that average hides exactly the kind of spike or slow climb that causes real problems for users.
The same 30-second SNMP polling that exposed Station 22's hidden CPU ceiling is what catches a firewall memory leak or spike before it becomes an outage, which is precisely why Obkio Insights uses that same granular data to flag high memory usage as a root cause automatically.

Learn how Station 22 solved their network issue from a 15-minute installation to a resolution in 48-hours with Obkio’s Network Performance Monitoring tool.
Learn more
How to Prevent Firewall Memory Issues From Recurring
Preventing recurring firewall memory exhaustion requires watching the trend of memory usage continuously instead of checking in reactively, planning capacity upgrades before you hit the ceiling, and keeping firmware current.
- Monitor continuously, not reactively: A one-time check tells you nothing about the trend that matters. Continuous SNMP polling, correlated against your network's overall performance, catches a slow leak weeks before it becomes an outage.
- Set capacity planning triggers: Decide in advance what memory trend justifies a hardware upgrade versus a configuration tweak. If usage keeps climbing even after firmware patches and config tuning, that's your signal the device itself is undersized for the network it's protecting.
- Keep firmware current: Vendors patch memory leaks regularly. Staying on a current, stable release closes off a meaningful share of the memory problems firewalls run into.
Stop firewall issues from happening under your radar with Obkio.

- 14-day free trial of all premium features
- Deploy in just 10 minutes
- Monitor performance in all key network locations
- Measure real-time network metrics
- Identify and troubleshoot live network problems
FAQs about Firewall High Memory Usage
Why is my firewall using so much RAM?
Usually one of a handful of causes: a growing session table from more concurrent connections than usual, a memory leak in the current firmware version, resource-heavy features like deep packet inspection or antivirus scanning, verbose logging filling local buffers, a high VPN tunnel count, or hardware that was simply undersized for your current traffic in the first place. Check whether the increase is a steady climb (points to a leak) or tied to a specific change like a new VPN tunnel or a newly enabled inspection profile (points to load), since that distinction determines the fix.
Is high firewall memory usage always a problem?
No. Most firewalls run comfortably in the 40 to 70 percent range under normal load. What matters is the trend, not the number. A steady reading isn't a concern. A number that keeps climbing without a matching increase in traffic is.
Can a memory leak be fixed without a reboot?
Sometimes. If the leak is tied to a known firmware bug, a firmware update fixes it without requiring an immediate reboot, though the update process itself typically involves one. If hardware is undersized rather than leaking, reducing load through logging or session timeout adjustments can stabilize memory without a restart.
What's a normal memory utilization range for a firewall?
Most firewalls operate normally between 40 and 70 percent memory utilization, depending on the device, its features, and the traffic it handles. Treat sustained usage above 85 to 90 percent as a warning sign worth investigating, even if the device hasn't shown symptoms yet.
Does VPN traffic increase firewall memory usage?
Yes. Every VPN tunnel maintains its own connection state and encryption context in memory. A firewall terminating a large number of tunnels carries more memory overhead than one handling the same volume of unencrypted traffic, so VPN growth is worth factoring into capacity planning.


