











 Obkio Blog


 Subscribe
Table of Contents
Table of Contents
Most network teams monitor uptime. A lot of them track CPU. Almost none of them consistently monitor memory utilization on routers, firewalls, and switches, and that gap causes more unexplained outages and intermittent issues than most people realize.
High memory on a network device does not look like a memory problem. It looks like packet loss. It looks like a slow application response. It looks like a user complaining that MS Teams calls keep dropping, or that the VPN is unstable, or that "something is weird with the Internet today." You run your tests. Latency looks high. You open a ticket with your ISP. The provider comes back clean. Meanwhile, your firewall is sitting at 92% memory utilization and has been quietly dropping new session requests for hours.
This is the diagnostic blind spot that router memory monitoring and firewall memory utilization tracking are built to close. This article walks through what network device RAM/memory utilization actually is, how it is measured, what happens when it gets too high, and how to monitor it properly using SNMP.
What Is RAM/Memory Utilization on a Network Device? 
RAM utilization on a network device is the percentage of total available memory that the device is actively using to run its processes, maintain its tables, and handle traffic in real time.
Unlike CPU, which spikes and recovers, memory utilization reflects the cumulative load of everything the device is actively managing at any given moment. A device sitting at 90% memory has no headroom left. When traffic volume increases, a new routing peer comes up, or the firewall session table grows from a sudden surge in connections, there is nowhere for that demand to go.
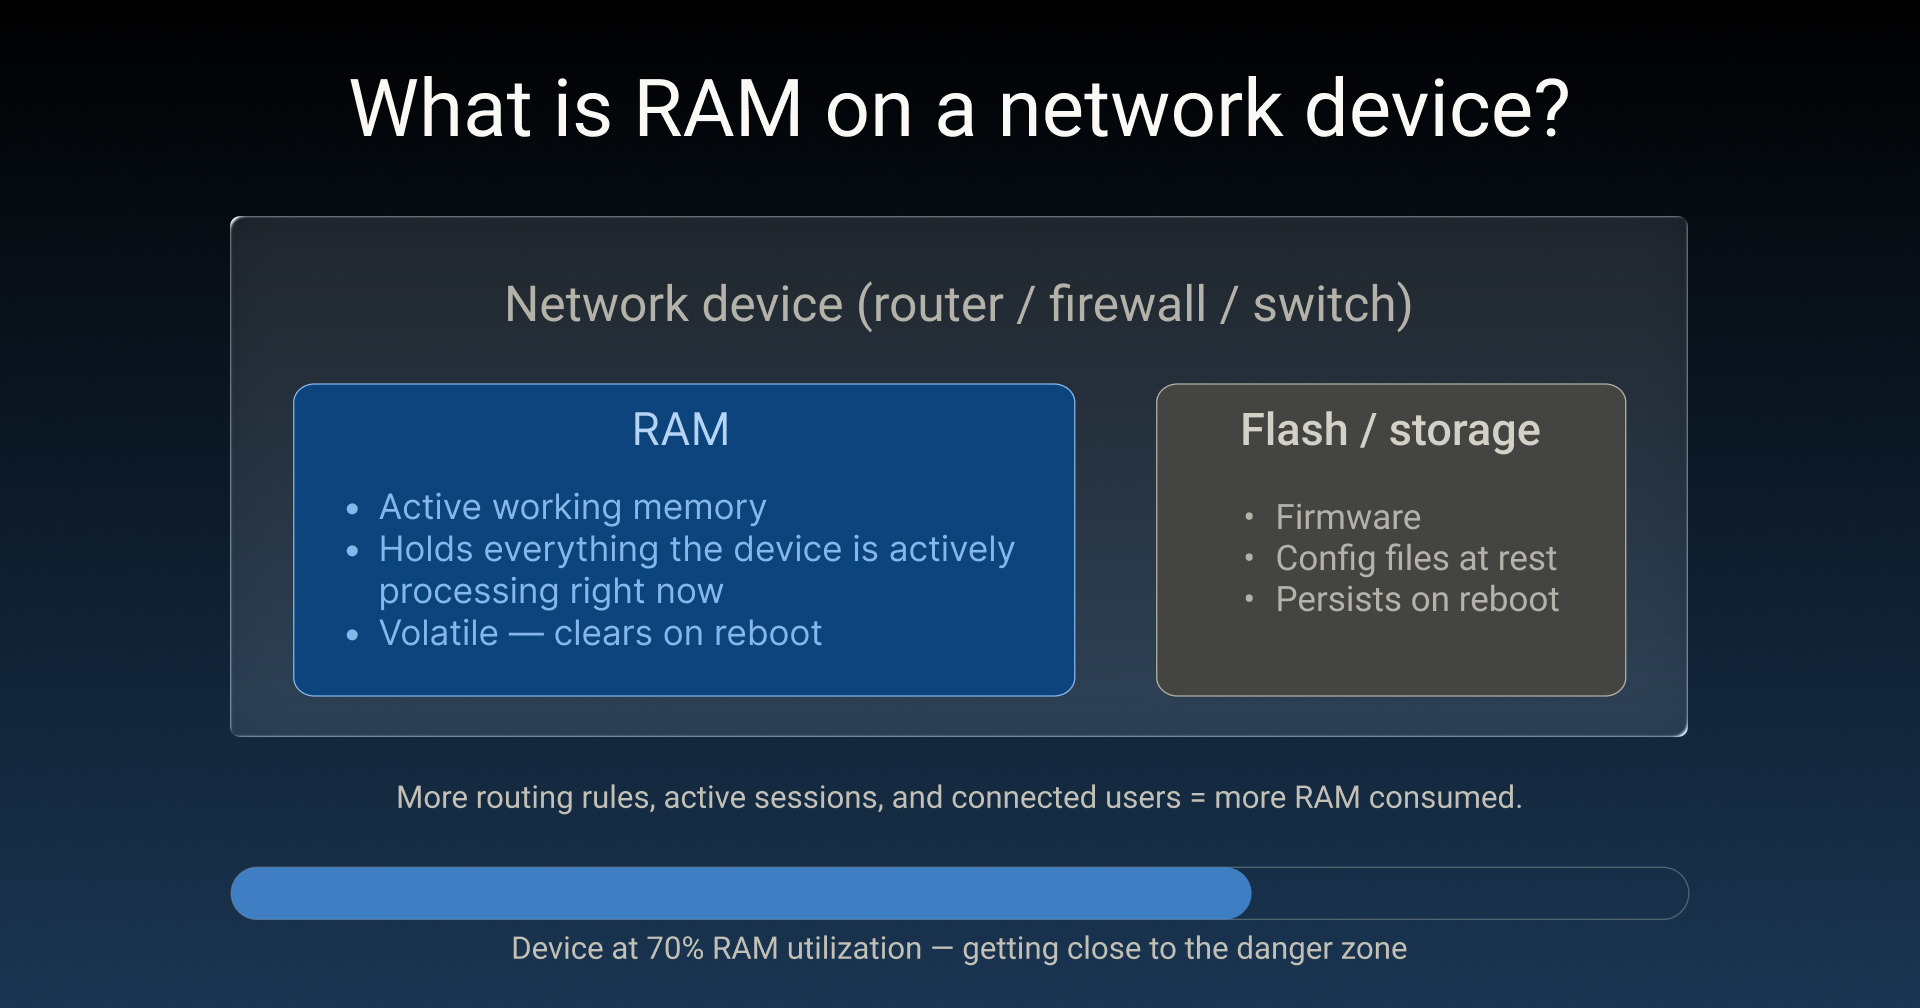
On a router, switch, or firewall, "used memory" is not the same as what you would see on a Linux server. Network device firmware does not aggressively reclaim or cache-swap memory the way a general-purpose OS does. What gets loaded into RAM tends to stay there. That is why memory utilization on network devices tends to climb gradually over time rather than fluctuate up and down the way CPU does. And it is why, once utilization gets high, it often stays high.
What is actually consuming that memory?
On a typical business-grade router or firewall, it is a combination of the device OS and firmware processes, active routing tables (BGP, OSPF, static routes), firewall session tables and connection state, NAT translation tables, ACL and policy rule sets, ARP and MAC address tables, and active management sessions. The more complex your network, the larger each of those tables gets, and the more memory the device needs to hold all of it at once.
How Is Memory Utilization Measured on Network Devices?
The formula is simple:
(Used Memory / Total Memory) x 100 = Memory Utilization %
This is the number your monitoring tool tracks, a single continuously updated percentage that reflects what the device is carrying right now.
The value is retrieved via SNMP. A monitoring agent queries the device at regular intervals using GET requests, targeting the MIB OIDs that store memory data.
Standard OIDs like hrStorageUsed and hrStorageSize from the HOST-RESOURCES-MIB are commonly used for this, though some vendors expose memory data through their own proprietary MIBs. Cisco IOS devices, for example, use OIDs under the ciscoMemoryPoolMIB for more granular memory pool data.
The polling interval matters more than most people think. Most traditional SNMP monitoring tools poll every 5 to 10 minutes. That is long enough to miss a memory spike that caused 3 minutes of session drops before it recovered, or to report an averaged-out value that hides the real peak. At 30-second polling intervals, you see what actually happened.
One important point: the memory utilization percentage tells you the severity and the trend, but it does not tell you which process is consuming the memory. If memory utilization is climbing steadily and you need to find the cause, you will need to log into the device CLI directly.
On Cisco IOS, show processes memory sorted is your starting point. On FortiGate, diagnose sys top gives you process-level memory detail. Monitoring gives you when and the alert. The device itself tells you what.
Not all devices expose memory data via SNMP. This depends on the vendor and which MIBs the device supports. Older or entry-level devices often do not report memory stats via SNMP at all, and the absence of data in your monitoring tool is not an error in that case. It simply means that the network device does not support SNMP memory reporting. Worth verifying during your initial discovery phase before you assume you have full coverage.
Why High Memory Utilization Degrades Network Performance
Memory exhaustion on a network device rarely announces itself clearly. What teams observe are symptoms like intermittent packet drops, sessions that disconnect without explanation, and users reporting slowness that comes and goes.
The device is still up, ping still responds, and nothing looks obviously wrong. The problem is that memory pressure doesn't show up in uptime monitors or basic connectivity checks. By the time it's obvious, the device is already destabilized.
The degradation follows a predictable curve, and each stage has a different failure mode.
- Below 70% Memory Usage: Normal operation. The device has enough headroom to handle traffic bursts, table growth, and management sessions without any issues.
- 70 to 80% Memory Usage: Acceptable but worth watching. The device is under load. No immediate failures, but upward-trending utilization should prompt a review of device load, the size of routing tables, and whether active sessions are growing.
- 80 to 90% Memory Usage: Warning territory. At this range, network device firmware begins prioritizing critical processes and deprioritizing or dropping others. You may start seeing intermittent packet drops, delayed routing convergence, or slow response to management sessions. Firewall session tables may begin refusing new connections when memory cannot accommodate them.
- Above 90% Memory Usage: Critical. The device is at serious risk. Routing instability, dropped sessions, and potential spontaneous reboots all become likely outcomes. Some devices will trigger a watchdog restart when memory exhaustion is detected. That restart will look like a "device went down" event in your monitoring tools unless you are also watching the memory graph.
- At or near 100% Memory Usage: The device becomes unresponsive. Recovery typically requires a hard reboot. You will lose all active sessions.
The RAM utilization behaviour differs by device type:
- On a router, high memory can mean BGP or OSPF routes stop updating or get dropped from the table entirely, which can cause traffic to black-hole or take suboptimal paths.
- On a firewall, a full session table means new connections get refused, which users experience as applications not loading or TCP timeouts.
- On a switch, the MAC address table cannot update properly, and forwarding decisions degrade.
- On a Wi-Fi access point, the client association table fills up, and new devices simply cannot connect.
All of these look like network problems from the user's perspective. None of them will be caught by monitoring uptime and CPU alone. This is exactly why network device memory monitoring needs to be part of your standard monitoring stack.

Unlock the secrets to network device monitoring! From routers to switches, discover insights to monitor core network devices with tools, tips & techniques.
Learn more

How SNMP Memory Monitoring Works
SNMP (Simple Network Management Protocol) is the standard mechanism for querying performance data from network devices. The device exposes a structured set of variables through a MIB (Management Information Base). A monitoring agent sends SNMP GET requests to the device at regular intervals and stores the returned values.
For memory utilization specifically, the key MIB objects are typically hrStorageUsed and hrStorageSize from the RFC-2790 HOST-RESOURCES-MIB for general-purpose memory, or vendor-specific OIDs for more detailed memory pool data. The agent calculates the percentage from the returned raw values and records it as a time-series data point.
SNMP v1 and v2c use community strings for authentication. SNMPv3 adds proper authentication and encryption, which is what you want for any device handling sensitive traffic or sitting in a production environment. Make sure your devices have read-only SNMP access enabled and that your monitoring agent has network-level access to reach them.
One thing to be aware of: SNMP memory monitoring only applies to devices you manage. Your ISP's equipment, monitor router memory usage on the upstream provider, and third-party infrastructure are outside your scope. SNMP device monitoring is a tool for understanding your own network, and it complements external performance monitoring rather than replacing it.

Learn about what SNMP monitoring is & how to use it to monitor performance of networking devices like firewalls, routers, switches and wifi access points.
Learn more
How to Monitor Memory Utilization for Network Devices with Obkio
Obkio's Network Device Monitoring takes a different approach from traditional SNMP monitoring tools. Most legacy tools treat SNMP as a primary alerting mechanism, polling devices and generating an alert every time a metric crosses a threshold. The result is thousands of notifications, most of them false positives or low-priority noise.
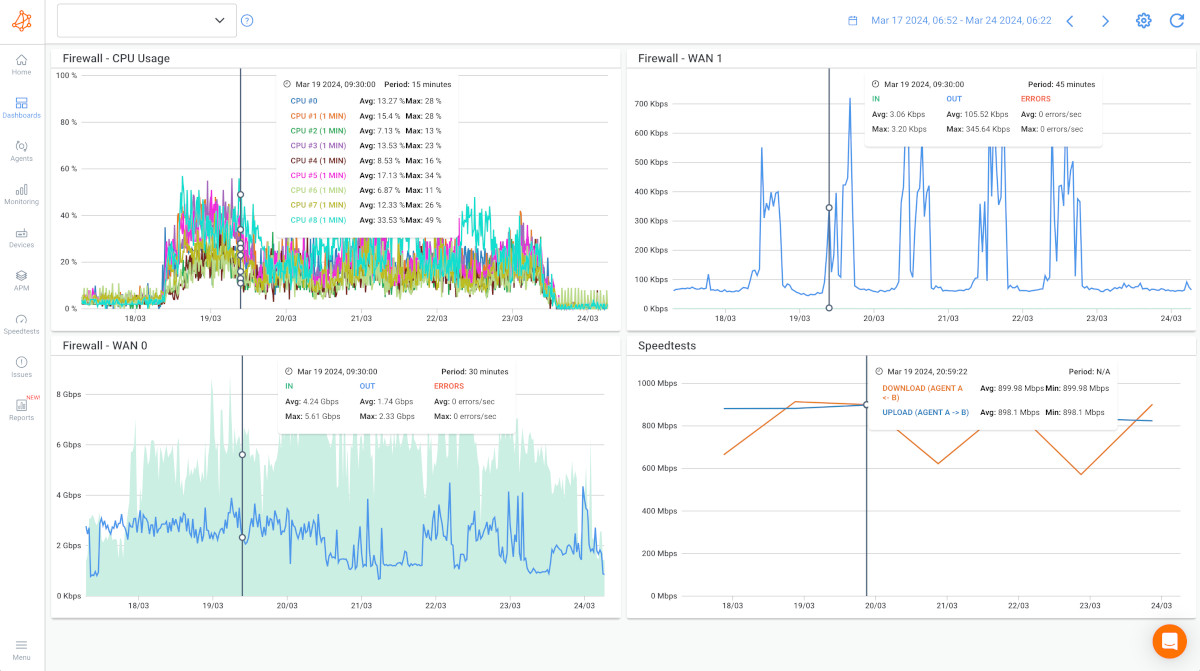
Obkio flips the model. SNMP device monitoring in Obkio is a troubleshooting resource, not an alerting engine. The platform leads with end-to-end network performance monitoring using synthetic traffic between monitoring agents. When actual performance degrades, Obkio alerts you. At that point, the SNMP device metrics, including memory utilization, CPU, bandwidth, and interface errors, give you the context to determine whether the issue is coming from your equipment or from somewhere else in the path. You stop opening ISP service tickets for problems that are sitting inside your own devices.
This approach solves two problems that matter in practice.
- First, it eliminates alert fatigue. You get fewer alerts, but every alert points at something real.
- Second, it answers the first question every network admin asks when performance drops: Is it my gear or my provider?
- Obkio gives you that answer fast by combining SNMP device data with end-to-end performance data in a single view.
No SNMP expertise is required. You add a device, provide the IP and credentials, and Obkio handles the rest. Here is how to get it running for memory utilization monitoring specifically.
- 14-day free trial of all premium features
- Deploy in just 10 minutes
- Monitor performance in all key network locations
- Measure real-time network metrics
- Identify and troubleshoot live network problems
Get started in minutes, for free, with Obkio’s Free Trial.

Step 1: Deploy a Monitoring Agent Near Your Network Devices
Obkio's Network Device Monitoring works through a collector agent, a software agent deployed on a machine with SNMP access to your network devices. This is typically a server or VM on the same network segment as the devices you want to monitor. The agent handles all SNMP polling locally within your network, without requiring VPN tunnels or external access to each device. Obkio manages the agent software and updates automatically.
You deploy one Monitoring Agent per network segment or site. If you have devices across multiple locations, you deploy an agent at each location. The agent at each site polls the devices on that local segment directly, which keeps the polling traffic local and eliminates the latency or complexity of polling devices across WAN links.
Step 2: Add Your Network Devices to Obkio
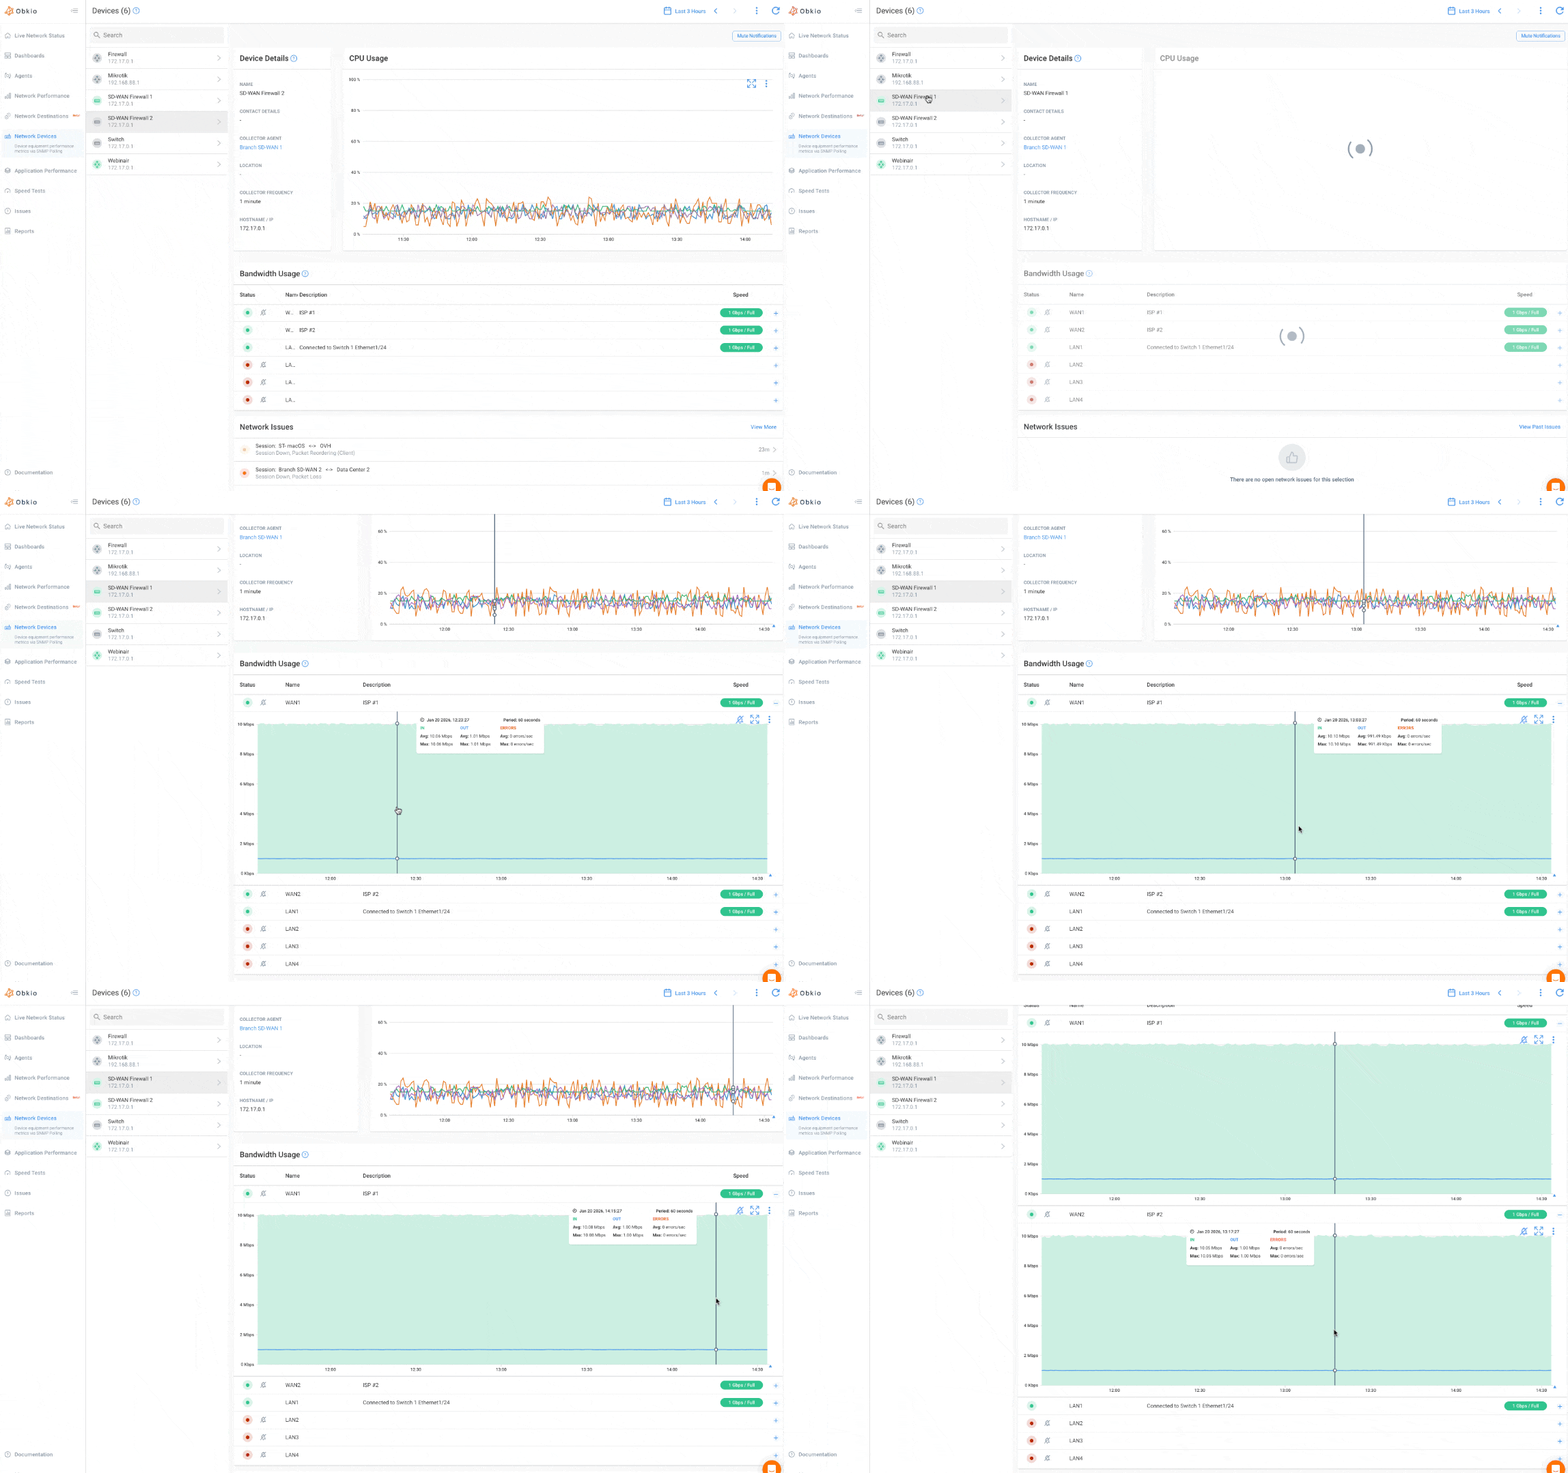
In the Obkio dashboard, you add the network devices you want to monitor. You provide the device IP and SNMP credentials. Obkio supports SNMPv1, v2c, and v3. No manual OID configuration is required. Obkio automatically discovers and collects the available metrics for each device based on what the device reports via SNMP, including memory utilization, CPU usage, bandwidth, interface errors, and device availability.
If you are unsure which SNMP version your device supports, check the device documentation or the SNMP configuration section in the device admin interface. For most enterprise devices, SNMPv2c with a read-only community string is straightforward to configure and gives Obkio everything it needs.
Step 3: The Agent Begins Polling for Memory and CPU Data
Once configured, the agent starts querying each device via SNMP. Obkio polls at either 30-second (Ultra-Fast) or 60-second (Fast) intervals, depending on your plan and polling configuration. That is 10x faster than the industry standard 5-minute polling cycle. Memory utilization uses the same polling interval as CPU, so both metrics are always captured in sync. A memory spike that resolves in 90 seconds will still be visible in your data because the polling cadence is tight enough to catch it.
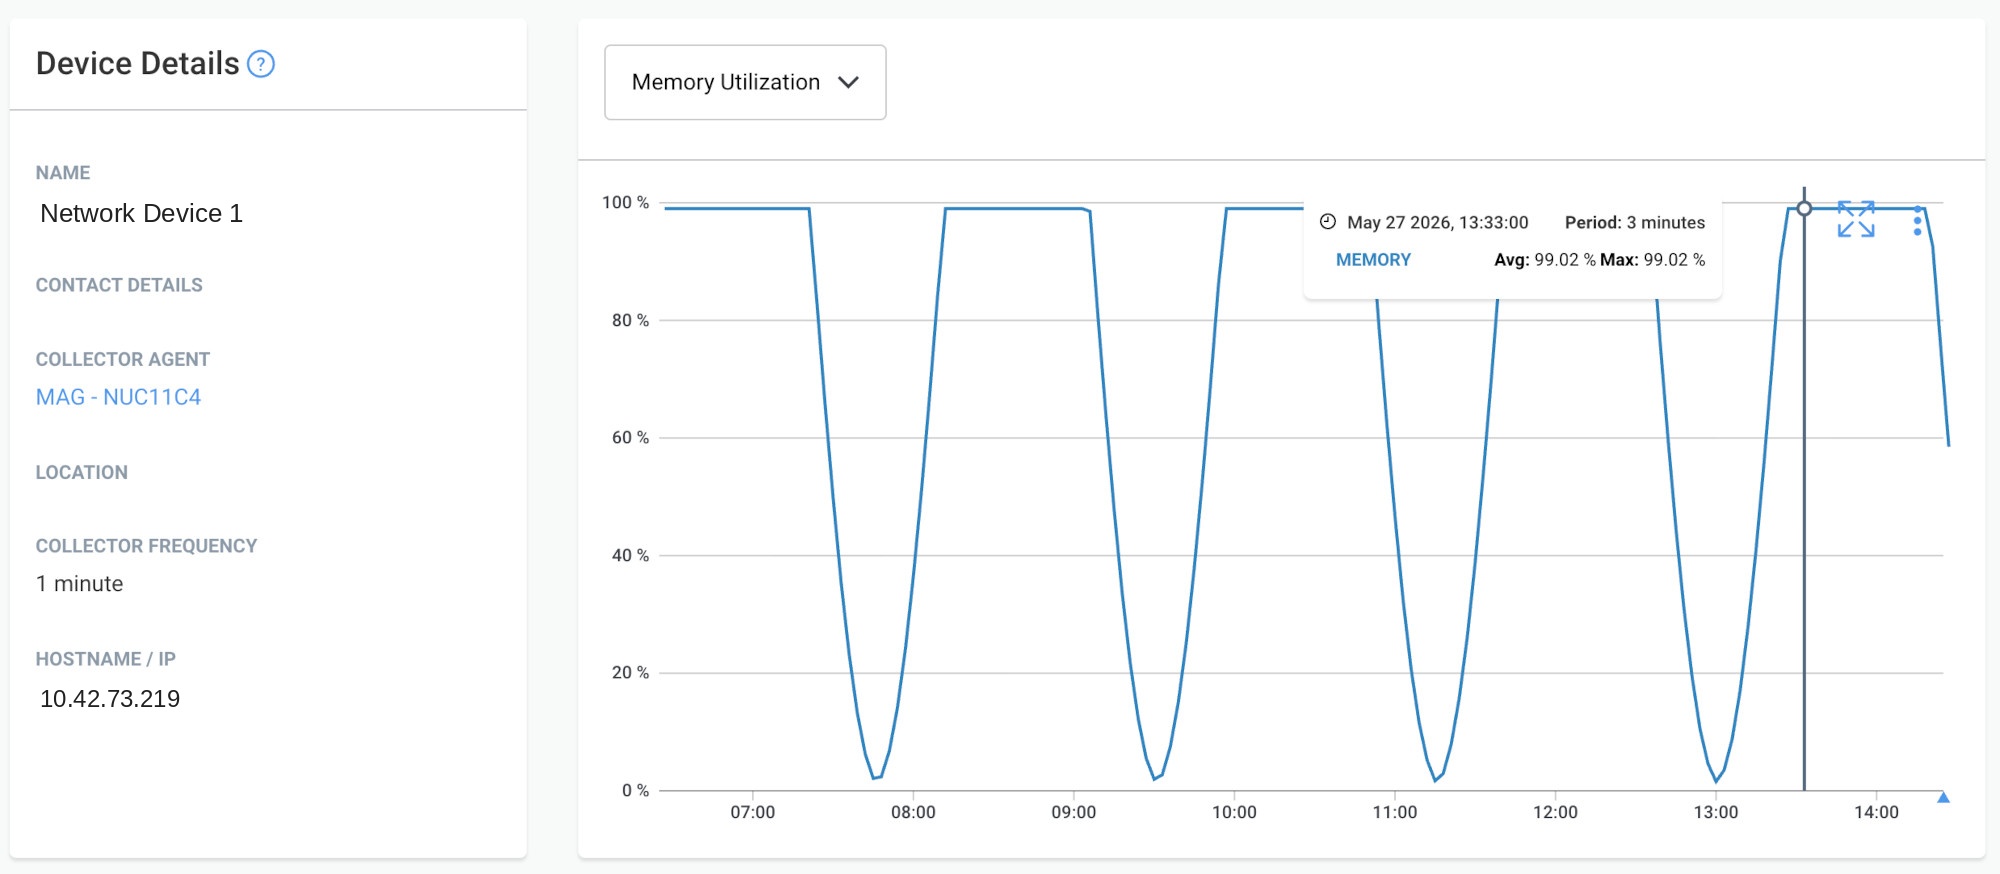
Step 4: View Memory Utilization on the Device Detail Page
Memory usage is displayed as a percentage graph in the Device Metrics section of the device detail page in the Obkio app, directly alongside the CPU usage graph. Both graphs share the same time axis and polling cadence, which makes it straightforward to correlate memory and CPU behaviour when investigating a performance event.
You can zoom into a time range, hover over data points for exact values, and compare the memory and CPU graphs side by side to determine whether a specific incident was driven by CPU saturation, memory exhaustion, or both at the same time.
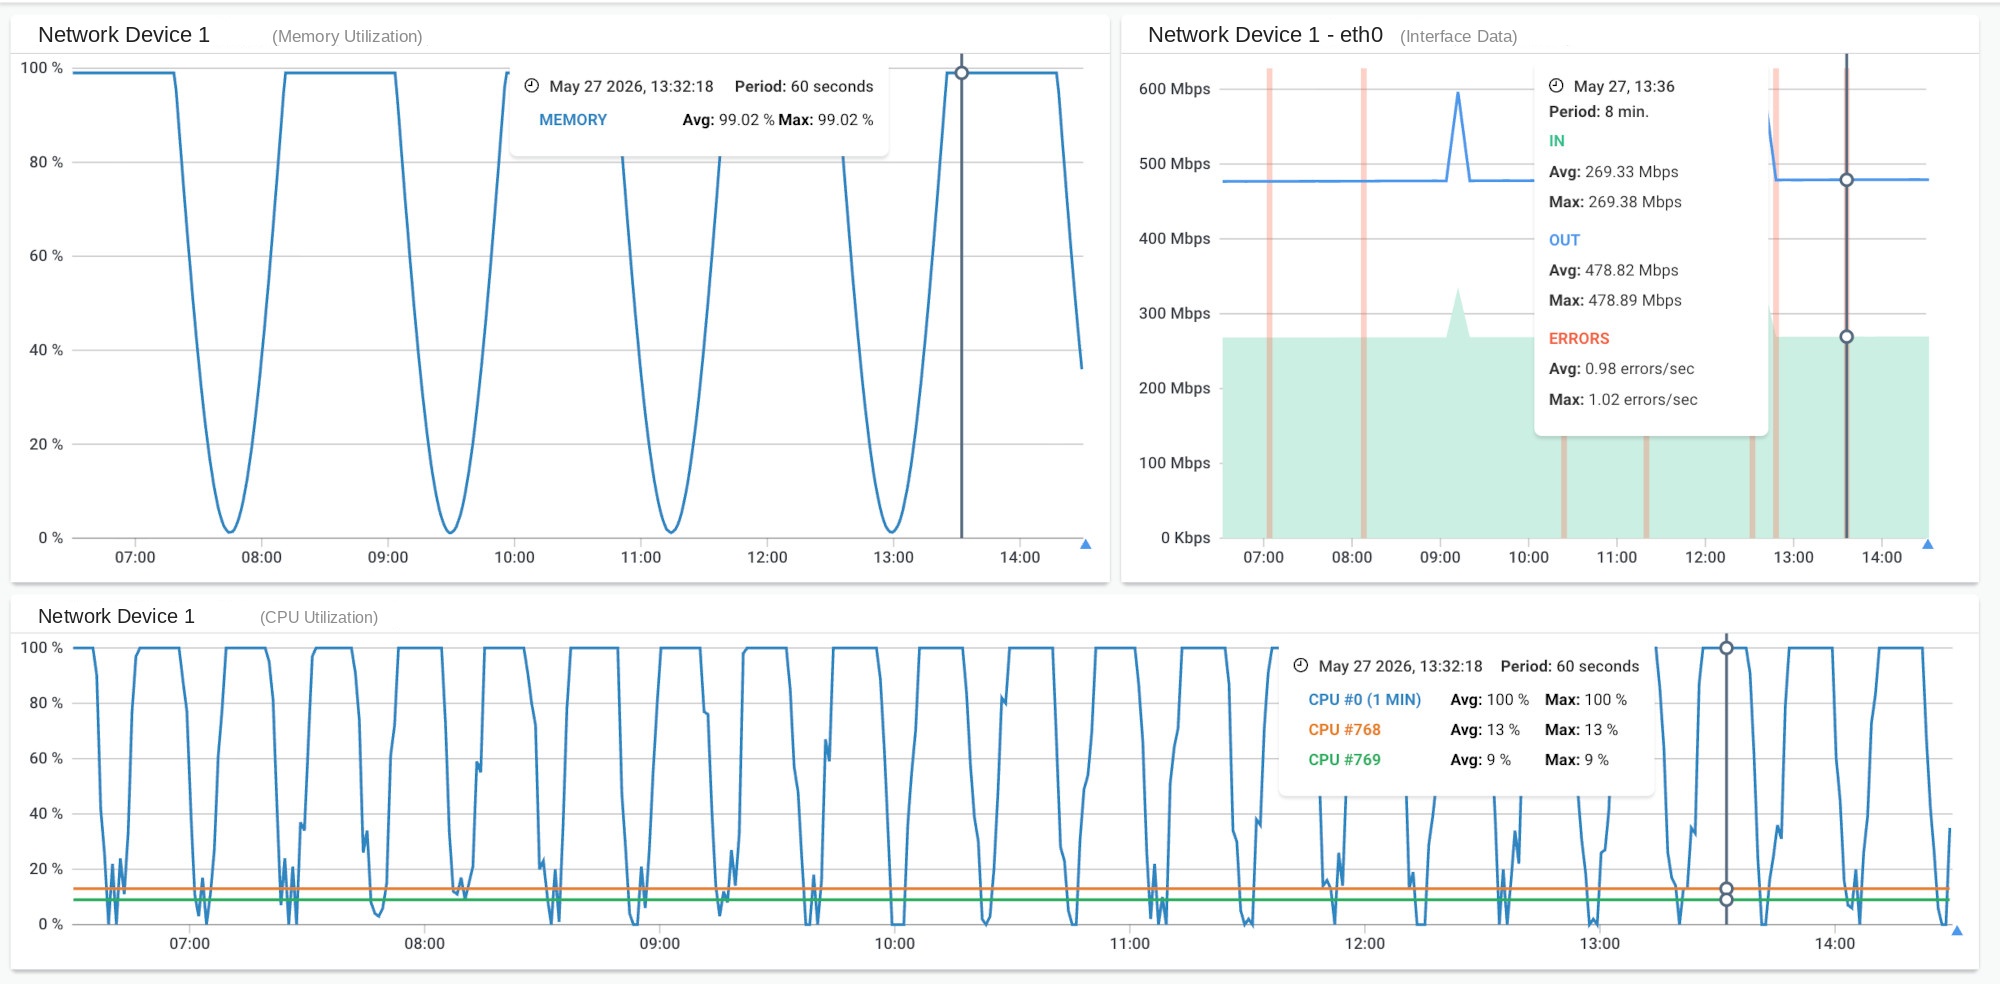
This is where the diagnostic value becomes clear. Instead of guessing whether a reported performance issue was device-related, you pull up the device detail page, look at the memory and CPU graphs for the time window in question, and either see the evidence or rule it out in seconds.
Step 5: Add a Memory Usage Widget to Your Dashboard
For ongoing visibility, you can add a Memory Usage widget to any Obkio dashboard under the Device Metrics widget category. When creating the widget, CPU and memory usage are selectable from a dropdown menu. This makes it practical to build a NOC dashboard or team dashboard that shows device memory status alongside network performance metrics, so your team does not have to navigate to individual device pages to see whether device health is contributing to a current issue.
A Note on Network Devices with No Memory Utilization Data
If a device does not return memory utilization data via SNMP because of vendor MIB limitations, the Memory Usage graph and the dashboard widget will show no data. This is expected behaviour. Obkio continues monitoring all other available metrics for that device. The absence of a memory graph is not an error. It means the device does not support SNMP memory reporting, and you should verify this is the case by checking the device documentation before assuming something is misconfigured.
What are RAM/Memory Utilization Thresholds and Baselines?
Threshold alerting is only useful if your thresholds are grounded in observed baseline behaviour for your specific devices. A threshold set at 80% RAM for a firewall that regularly runs at 75% under normal load is basically a constant alarm. A threshold set at 80% RAM for a device that typically runs at 40% gives you a meaningful signal.
The recommended approach:
- Run memory usage monitoring for 7 to 14 days before setting your alert thresholds.
- Use that window to identify peak memory usage periods, typically business hours, backup windows, and heavy traffic periods like end-of-month reporting or large file transfers.
- Once you have a clear picture of normal operating range, set your warning threshold at approximately 80% and your critical threshold at 90%.
Here is a reference table for memory utilization ranges:
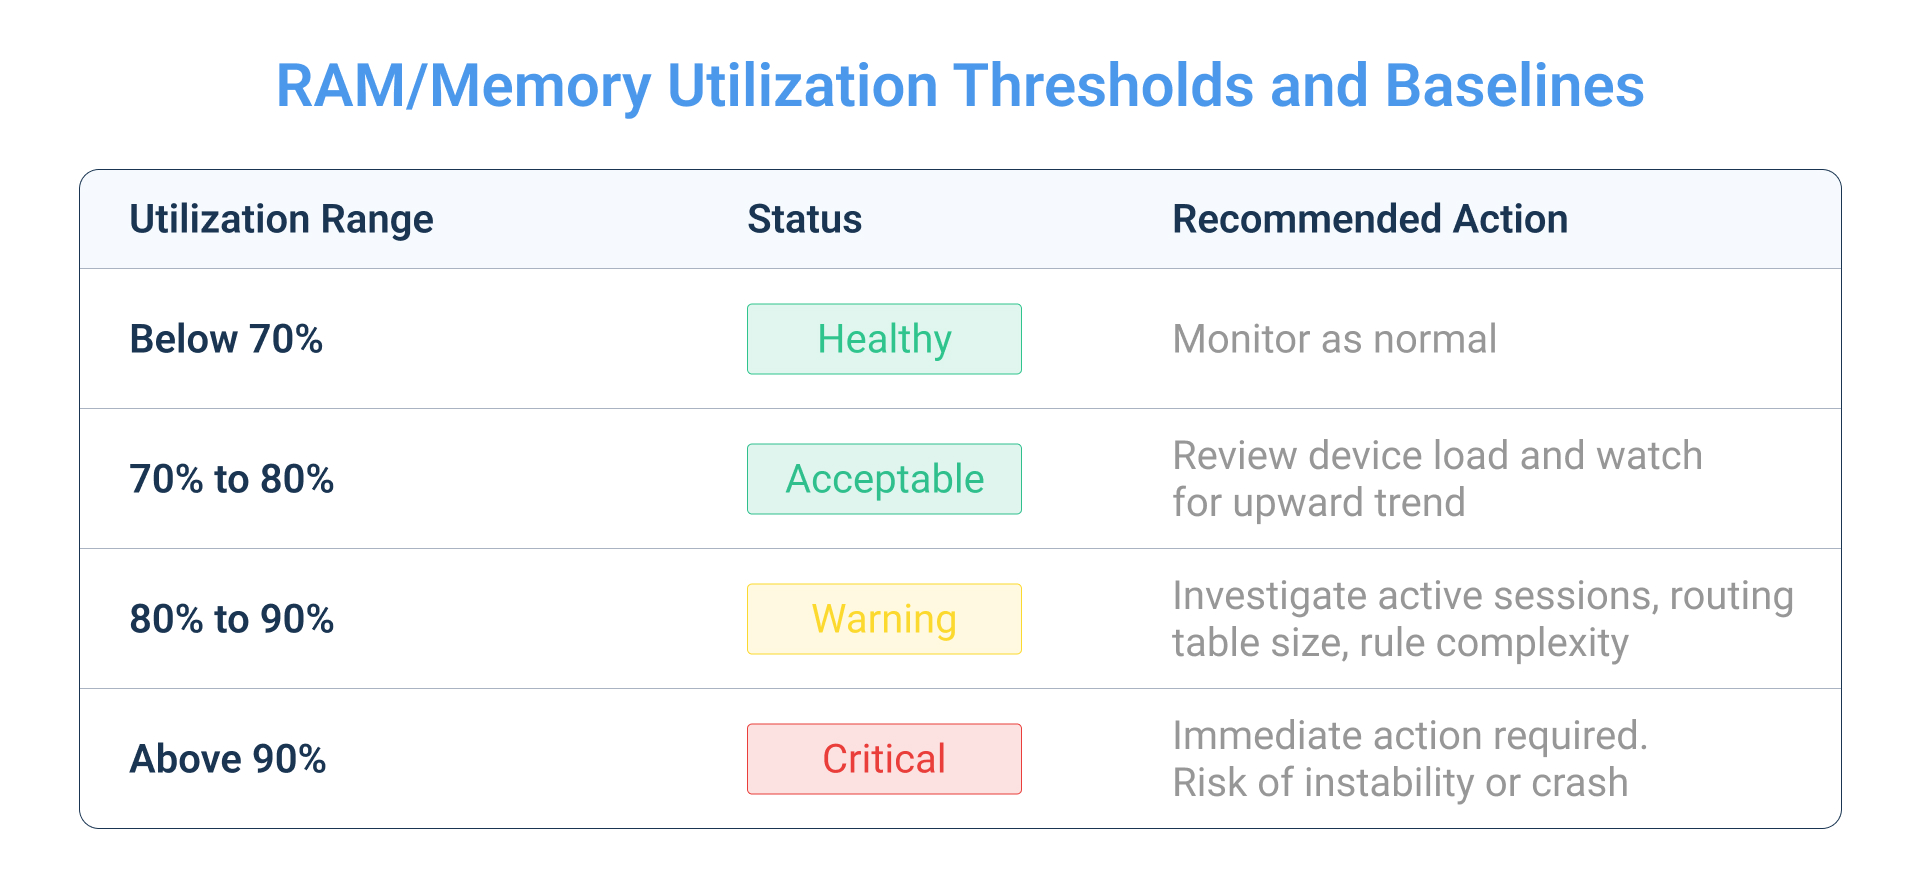
Network device memory utilization below 70% is healthy, 70–80% warrants monitoring for upward trends, 80–90% requires investigation of active sessions and routing tables, and anything above 90% is critical with immediate risk of instability or crash.
For devices that trend upward steadily over weeks, the issue is often growth-related: more users, more firewall rules, a larger BGP routing table, or a growing NAT translation table. The fix is either configuration optimization (pruning unused rules, summarizing routes) or a hardware upgrade. Memory utilization monitoring gives you the data to justify that conversation with management before the device fails during business hours.
Memory Usage vs. CPU Monitoring: Why You Need Both?
CPU spikes are usually visible and transient. A DDoS, a routing convergence event, a firmware bug triggering a process loop, these show up as sharp CPU spikes that often resolve on their own.
Memory exhaustion is a different pattern. It climbs gradually, it stays high, and it often goes unnoticed until something breaks.
The real value of monitoring both metrics together is the diagnostic picture they create:
- High CPU with normal memory typically points to a traffic burst or a process spike. Often self-resolving. Worth watching but not immediately alarming.
- Normal CPU with high memory suggests sustained load, a growing session table, or a memory leak. This one will not self-resolve. It needs investigation.
- Both high simultaneously means the device is under severe stress. Degradation and instability are imminent. Act immediately.
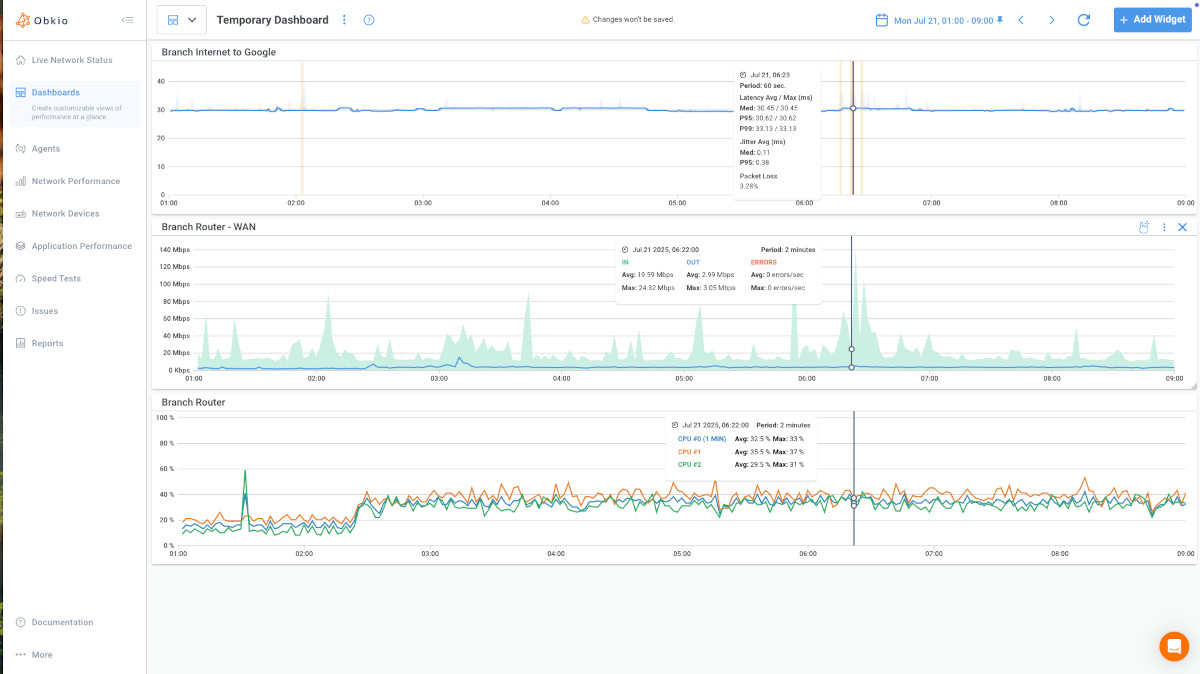
Because Obkio polls memory and CPU on the same interval with no separate configuration, both metrics are always in sync. The side-by-side comparison on the device detail page is reliable because both data points share the same polling timestamp. That alignment matters when you are trying to correlate device behaviour with a specific performance event.
Which Network Devices Support SNMP Memory Monitoring?
Support depends on the vendor and the device's firmware version. Here is the general breakdown from experience:
- Generally supported: Enterprise-grade Cisco (IOS, IOS-XE, ASA), Juniper (Junos), Fortinet (FortiGate), Palo Alto (PAN-OS), Aruba, some Meraki models, and Ubiquiti EdgeRouter series. Most devices in this category expose both CPU and memory via SNMP out of the box, though you may need to enable SNMP and configure credentials first.
- Variable support: Mid-range and SMB-grade switches and routers. Support depends on firmware version and MIB configuration. Some models in this tier expose memory, others do not. Worth verifying with a test query before assuming coverage.
- Typically not supported: Consumer and SOHO-grade devices, some older hardware past end-of-support. These devices either do not implement the relevant MIBs or do not support SNMP at all.
Obkio surfaces the absence of data clearly rather than showing misleading zeros or averaged values. If a device does not return memory data, you see no data, not a flat line at zero. That distinction matters for accurate interpretation.
Frequently Asked Questions: Memory Utilization Monitoring
What is a normal memory utilization for a router or firewall?
Most network devices operate healthily below 70 to 75% memory utilization. Sustained usage above 80% warrants investigation, and above 90% is critical. At that level, the device is at risk of dropping sessions, refusing new connections, or crashing. The baseline varies by device model and workload, which is why running 7 to 14 days of monitoring before setting thresholds gives you more accurate alerting than using generic numbers.
How often should I poll network devices for memory data?
Most SNMP monitoring tools poll every 5 to 10 minutes, which is enough for trending but not for catching short-lived spikes. Obkio supports 30-second (Ultra-Fast) and 60-second (Fast) polling, and memory utilization is polled on the same schedule as the CPU. At 30-second intervals, you have visibility into events that would be averaged away by tools polling every 5 minutes.
Why is my network device showing no memory data in Obkio?
Not all devices expose memory utilization via SNMP. This depends on the vendor and which MIBs the device supports. If a device does not return memory data, the graph and dashboard widget will show no data. This is expected behaviour, not a configuration error. Check the device documentation to confirm whether SNMP memory reporting is supported before troubleshooting further.
Can I monitor memory utilization on a firewall with SNMP?
Yes. Most enterprise firewalls support SNMP memory reporting. Cisco ASA, Fortinet FortiGate, Palo Alto Networks, and Juniper SRX all support it. You need to enable SNMP on the firewall, configure read-only community string access or SNMPv3 credentials, and ensure your monitoring agent has network access to the device on UDP port 161.
What is the difference between monitoring RAM on a network device versus a server?
On a server, the OS manages memory dynamically. It uses available RAM for caching, frees memory when processes terminate, and swaps to disk when physical memory runs low. The memory utilization percentage on a server is a much less urgent signal because the OS is actively managing it. On a network device, there is no equivalent memory management layer. Memory is consumed by routing tables, session tables, NAT entries, and ACL rulesets, and it stays consumed. A sustained high memory utilization on a network device is more immediately concerning than the same number on a server.
What happens if a network device runs out of memory?
The device becomes unstable. At extreme memory exhaustion, it will either begin dropping traffic silently, restart automatically via a watchdog process, or become completely unresponsive and require a hard reboot. Any of these outcomes causes a network outage. That is why sustained memory utilization above 90% is treated as a critical alert rather than a warning.
Conclusion: Close the RAM and Memory Utilization Monitoring Gap
Most teams are flying with partial instrument panels. They know when a device goes down. They can see CPU spikes. But memory utilization, the slow-climbing, stealthy metric that quietly causes intermittent failures and unexplained drops, often gets no dedicated monitoring at all.
Network device memory monitoring fills that gap. It turns an invisible failure mode into a visible trend with thresholds, alerts, and actionable data. When something breaks, you stop guessing whether the device is contributing to the problem. You pull up the memory graph and either see the answer or rule it out.
Obkio's Network Device Monitoring collects memory and CPU utilization via SNMP at 30-second or 60-second polling intervals, displays both as percentage graphs in the Device Metrics section of the device detail page, and lets you add Memory Usage widgets to any dashboard for at-a-glance visibility. It works alongside Obkio's end-to-end network performance monitoring, so you can correlate device metrics with actual network quality data and determine exactly where an issue is coming from.
Start your free 14-day trial and add memory monitoring to your network visibility stack. No credit card required.

- 14-day free trial of all premium features
- Deploy in just 10 minutes
- Monitor performance in all key network locations
- Measure real-time network metrics
- Identify and troubleshoot live network problems
Get started in minutes, for free, with Obkio’s Free Trial.

