Table of Contents
Table of Contents
SaaS (Software as a Service) monitoring refers to the process of continuously tracking and analyzing the performance of SaaS applications in order to ensure their reliability, availability, and optimal performance.
SaaS monitoring involves collecting and analyzing data on various metrics, such as response times, uptime, error rates, user activity, and system resource usage, among others. This data is used to detect and diagnose issues, identify potential bottlenecks or areas of improvement, and optimize the performance and user experience of the SaaS application.
SaaS monitoring is crucial for businesses that rely on SaaS applications, as it helps them ensure that their users have a smooth and reliable experience while using the application, and also enables them to proactively identify and resolve issues before they affect users. Effective SaaS monitoring can lead to improved customer satisfaction, increased revenue, and reduced downtime and associated costs.
Not every SaaS monitoring solution can answer someone's needs as different organizations may have different requirements and priorities for their SaaS applications. Some monitoring solutions may be better suited for certain use cases or industries, while others may not provide the necessary features or integrations.
To determine if a monitoring solution can meet your needs, it's important to consider factors such as the type of SaaS application you are monitoring, whether it's on-premise or cloud-based, the level of performance and reliability you require, the presence of a service level agreement (SLA), and any user complaints or issues that have been reported.
It's also important to consider the specific metrics and features that are important to you, such as response time, uptime, error rates, user experience, and data security. By understanding your needs and priorities, you can select a monitoring solution that provides the right level of visibility and control for your SaaS applications.
There are some key differences to consider when monitoring your own SaaS application as opposed to monitoring a third-party SaaS solution that you use.
When monitoring your own SaaS application, you have more control over the environment and infrastructure, which can make it easier to configure and customize monitoring tools to fit your specific needs. You can also integrate monitoring into the development process and implement continuous monitoring to catch issues early on.
On the other hand, monitoring a third-party SaaS solution can be more challenging as you may have limited visibility into the underlying infrastructure and dependencies. You may need to rely on APIs or log data provided by the vendor to monitor the application, which may not always provide the level of detail or flexibility that you need.
Additionally, monitoring your own SaaS application requires you to consider factors such as data privacy, compliance, and security, as you are responsible for protecting user data and ensuring regulatory compliance.
Overall, monitoring your own SaaS application requires a more hands-on approach and a deeper understanding of the application architecture and infrastructure, but it also provides greater control and flexibility in monitoring and optimizing performance.
SaaS monitoring is a critical component of delivering a reliable and high-performing SaaS application. By tracking key performance metrics and proactively identifying and addressing issues, businesses can ensure that their application delivers an optimal user experience, minimizes downtime and associated costs, and can scale to meet growing demand.

In this section, we will explore the importance of SaaS monitoring in more detail, including how it enables businesses to ensure optimal performance, enhance user experience, reduce downtime and costs, and improve scalability and network capacity planning.
Whether you are a SaaS provider or a business that relies on SaaS applications, understanding the importance of SaaS monitoring is essential for delivering a high-quality service that meets the needs of your customers.
SaaS monitoring is crucial for several reasons:
- Ensuring optimal performance: SaaS applications are typically delivered over the internet, which makes their performance vulnerable to a range of factors, such as network latency, bandwidth issues, and server overload. SaaS monitoring enables businesses to track key performance metrics and proactively identify and address issues that can impact the user experience and overall performance of the application.
- Enhancing user experience: SaaS monitoring enables businesses to identify and resolve issues that can impact the user experience, such as slow page load times, frequent errors, or unresponsive features. By ensuring optimal performance, SaaS monitoring can help businesses provide a seamless and satisfying user experience, which can lead to increased user engagement and retention.
- Reducing downtime and associated costs: SaaS monitoring can help businesses detect and resolve issues before they cause significant downtime, which can result in lost revenue and reputational damage. By identifying and addressing issues proactively, SaaS monitoring can help businesses avoid costly downtime and associated recovery costs.
- Improving scalability and capacity planning: SaaS monitoring can provide valuable insights into how the application is being used and how resources are being consumed. This information can help businesses plan for future growth and ensure that the application can handle increasing demand without experiencing performance issues.
In summary, SaaS monitoring is important because it helps businesses ensure optimal performance, enhance user experience, reduce downtime and associated costs, and improve scalability and capacity planning. By continuously monitoring SaaS applications, businesses can ensure that they are delivering a reliable, high-quality service that meets the needs of their customers.
The results of a recent survey on SAP performance issues highlight the significant impact that software performance can have on business operations. These findings underscore the importance of software monitoring for businesses, as proactive monitoring can help identify and resolve performance issues before they impact users and the bottom line._
While some lucky individuals claim to never have performance issues, the majority of respondents in a recent survey reported frequent incidents with software performance. According to the survey, one-third of respondents reported one or two incidents per month, 35% reported three to five incidents, 14% experience between five and 15 incidents, and 8% experience performance incidents almost daily.
The impact of these incidents on business operations is significant, with 46% of respondents citing a deterioration in customer satisfaction, 38% reporting loss of productivity within corporate IT, 33% reporting loss of non-IT employee productivity, 22% reporting lost revenue, and 12% reporting penalties for missing SLAs.
Identifying the root cause of a network bottleneck is no easy feat, as reported by the majority of survey respondents. It can take hours (46% of respondents), days (22%), or weeks (8%) to identify the cause of a typical software performance issue. Only 22% of respondents were able to identify a problem in just minutes, while a lucky 2% were able to do so in seconds.
Fixing performance issues is a manual effort for 53% of respondents. Alternatively, respondents use performance monitoring tools (36%), third-party diagnostic tools (17%), or other methods (6%).
Overall, the majority of respondents (62%) expressed dissatisfaction with their current approach to fixing software performance issues.
Whether you are an administrator, consultant, network admin or end-user, this guide will help you identify and resolve performance issues and ensure that your system runs smoothly and efficiently.
Strategies for proactive SaaS performance monitoring involve taking a proactive approach to identify and address potential performance issues before they impact users. Some strategies to consider include:
- Set clear performance benchmarks: Establish clear performance benchmarks for each key metric to monitor and track against over time.
- Monitor application usage: Continuously monitor how the application is being used to identify potential performance issues and optimize resource allocation.
- Conduct regular load testing: Conduct regular load testing to simulate user traffic and identify potential bottlenecks or performance issues.
- Monitor third-party services: Monitor third-party services used in the SaaS application to ensure they are not impacting performance.
- Use synthetic monitoring: Use synthetic monitoring to simulate user behavior and proactively identify potential issues before they impact users.
- Implement real-time alerts: Implement real-time network monitoring alerts to notify IT teams of potential performance issues and enable rapid response times.
- Conduct root cause analysis: Conduct root cause analysis of performance issues to identify the underlying cause and take steps to prevent recurrence.
By implementing these strategies, businesses can take a proactive approach to SaaS performance monitoring and optimize the performance of their applications to meet the needs of their users.
To effectively monitor the performance of a SaaS application, it is essential to track and analyze a range of performance metrics. These metrics provide valuable insights into the health of the application, and enable businesses to identify and resolve issues that can impact the user experience and overall performance of the application.
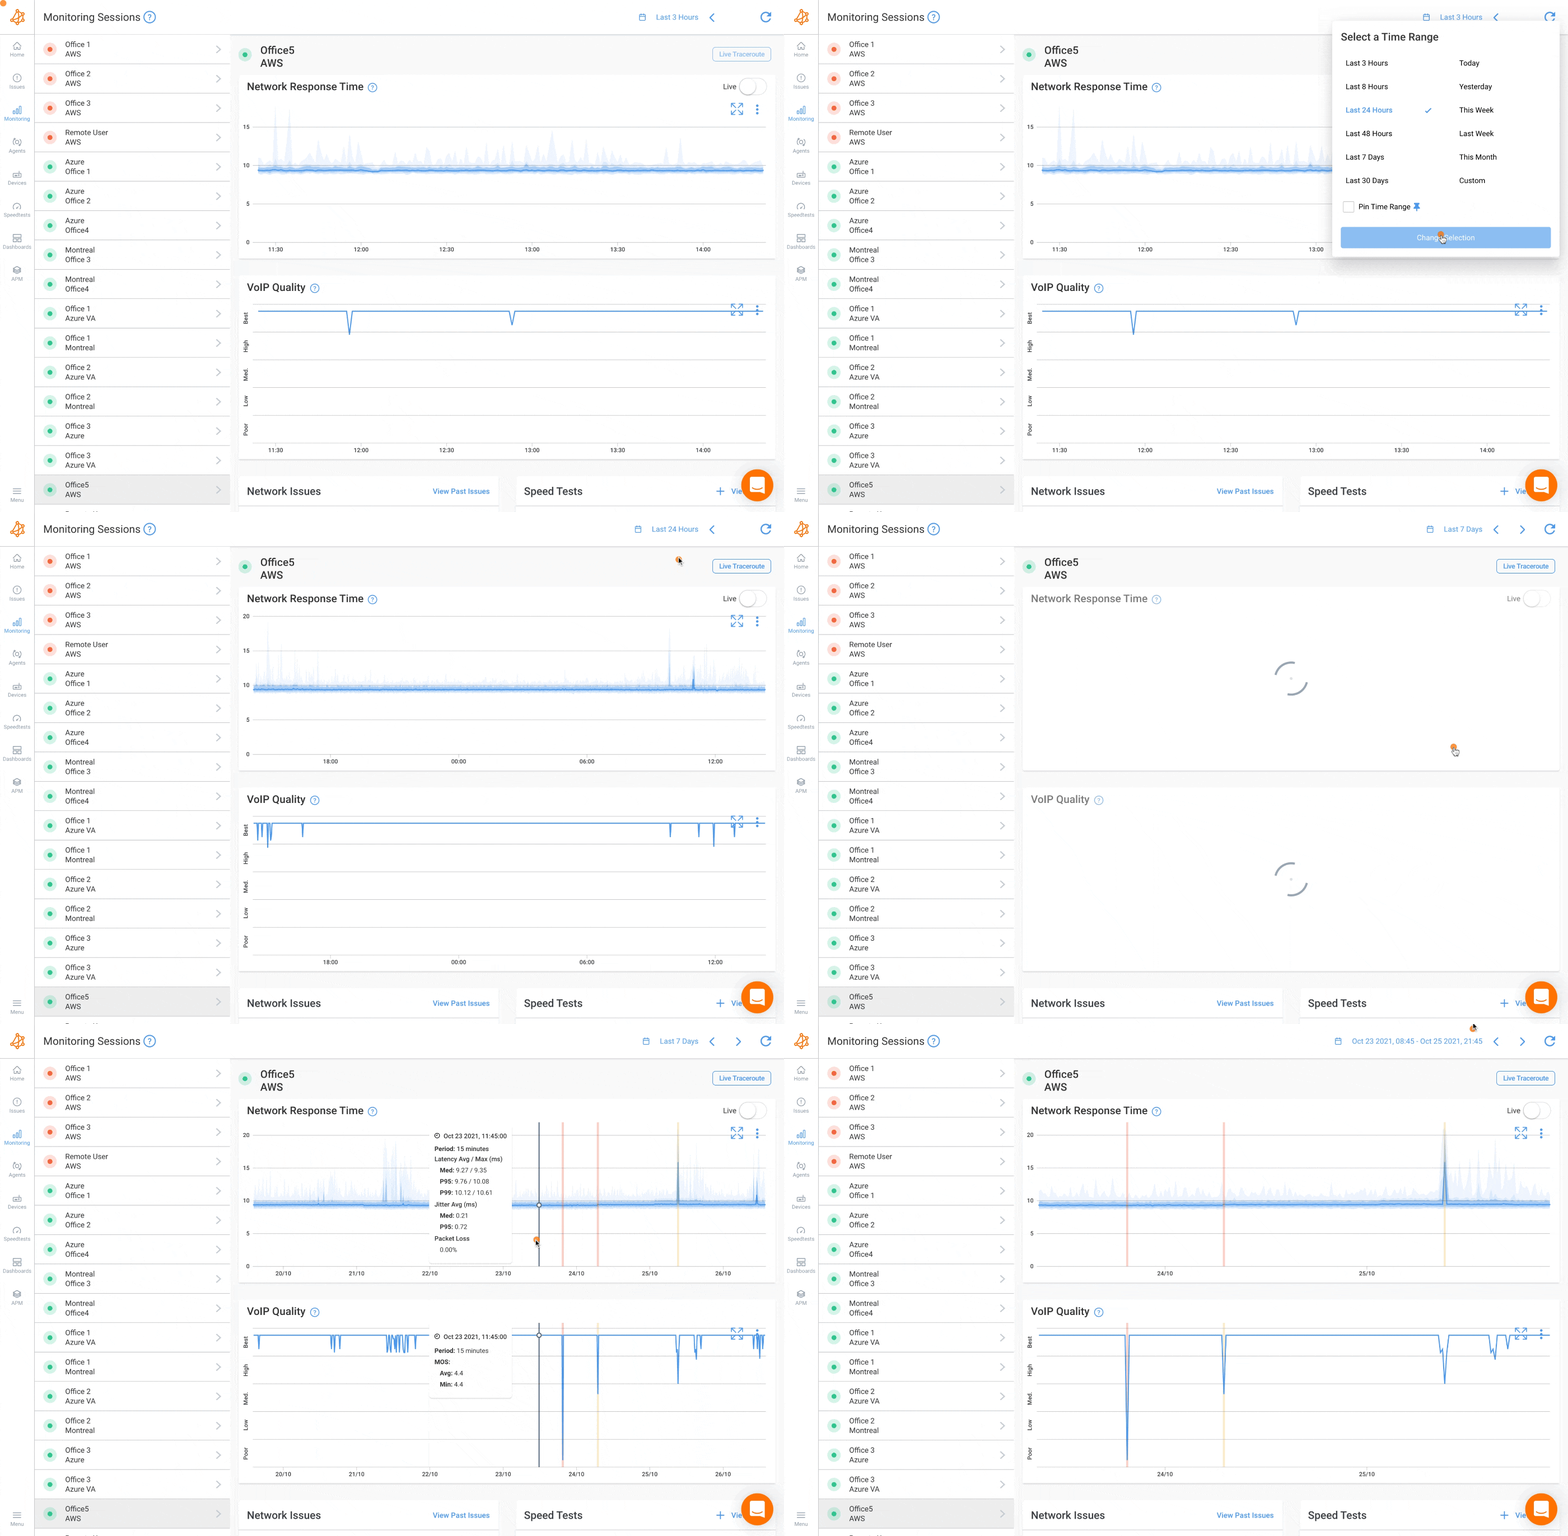
In this section, we will discuss some of the key SaaS performance metrics to monitor, and provide tips for setting benchmarks and tracking performance over time. By monitoring these metrics, businesses can ensure that their SaaS application is delivering the best possible user experience, and identify opportunities for optimization and improvement.
Here is a list of top SaaS performance metrics to monitor, along with some examples:
- Response Time: The time it takes for the application to respond to a user request. For example, the time it takes for a page to load after a user clicks a button.
- Uptime: The percentage of time that the application is available and accessible to users. For example, if the application is down for 30 minutes out of a 24-hour period, the uptime would be 99.8%.
- Error Rate: The percentage of user requests that result in an error or failure. For example, if 2% of user requests result in an error, the error rate would be 2%.
- Throughput: The number of user requests that the application can handle per unit of time. For example, the number of requests per second or per minute.
- Load Time: The time it takes for a web page to fully load and be displayed to the user. For example, the time it takes for all images, scripts, and content to be loaded.
- Time to First Byte (TTFB): The time it takes for the server to send the first byte of data in response to a user request. For example, the time it takes for the server to send the HTML code of a web page.
- Database Performance: Metrics related to the performance of the database used by the application, such as response time, query time, and throughput.
- Network Latency: The time it takes for data to travel between the user's device and the application's servers. For example, the time it takes for a user request to reach the server and for the server's response to reach the user's device.
By monitoring these metrics, businesses can gain valuable insights into the performance of their SaaS application and identify areas for improvement. It is important to set benchmarks for each metric and track performance over time to ensure that the application is delivering optimal performance and meeting user expectations.
Setting benchmarks for SaaS performance involves establishing targets or thresholds for key performance metrics and tracking performance against these benchmarks over time.

Here are some steps to follow when setting benchmarks for SaaS performance:
- Identify key performance metrics: Determine which metrics are most important for measuring the performance of your SaaS application. These may include response time, uptime, error rate, throughput, load time, and others, depending on the specific needs of your application.
- Establish baseline performance: Before setting benchmarks, establish a network baseline for each performance metric by measuring current performance. This baseline can be used to track progress over time and identify areas for improvement.
- Set realistic benchmarks: Benchmarks should be challenging but achievable. Consider factors such as the complexity of your application, the needs of your users, and industry benchmarks when setting targets for each performance metric.
- Monitor performance over time: Continuously monitor performance against benchmarks over time to track progress and identify areas for improvement. Use monitoring tools and techniques to identify performance issues and take proactive steps to address them.
- Adjust benchmarks as needed: As the needs of your application and users change over time, it may be necessary to adjust benchmarks accordingly. Continuously evaluate performance metrics and adjust benchmarks as needed to ensure that they remain relevant and achievable.
By following these steps, businesses can establish clear benchmarks for SaaS performance and track progress over time.
This can help ensure that the application is meeting the needs of users and delivering optimal performance.
To ensure that a SaaS application delivers optimal performance, it is essential to set benchmarks for key performance metrics and track progress over time. By establishing clear targets and monitoring performance against these benchmarks, businesses can identify areas for improvement and ensure that the application meets the needs of its users.
In this section, we will explore how to create a benchmark plan for SaaS performance metrics, including examples for each metric.
Whether you are a SaaS provider or a business that relies on SaaS applications, creating a benchmark plan can help you optimize performance and enhance the user experience.
Here is a sample benchmark plan for SaaS performance metrics:
- Metric: Response Time
- Target: < 3 seconds
- Baseline: 4.5 seconds
- Example: Measure the time it takes for a web page to load after a user clicks a button or link. Set a target of 3 seconds or less for this metric, and track performance over time to ensure that response time stays within this range.
- Metric: Uptime
- Target: > 99%
- Baseline: 95%
- Example: Track the percentage of time that the application is available and accessible to users. Set a target of 99% uptime or higher, and track performance over time to ensure that downtime stays within acceptable limits.
- Metric: Error Rate
- Target: < 2%
- Baseline: 5%
- Example: Track the percentage of user requests that result in an error or failure. Set a target of 2% error rate or lower, and track performance over time to ensure that error rates stay within acceptable limits.
- Metric: Throughput
- Target: > 100 requests per minute
- Baseline: 50 requests per minute
- Example: Track the number of user requests that the application can handle per unit of time. Set a target of 100 requests per minute or higher, and track performance over time to ensure that throughput stays within acceptable limits.
- Metric: Load Time
- Target: < 5 seconds
- Baseline: 7 seconds
- Example: Measure the time it takes for a web page to fully load and be displayed to the user. Set a target of 5 seconds or less for this metric, and track performance over time to ensure that load times stay within this range.
- Metric: Time to First Byte (TTFB)
- Target: < 500 ms
- Baseline: 750 ms
- Example: Measure the time it takes for the server to send the first byte of data in response to a user request. Set a target of 500 ms or less for this metric, and track performance over time to ensure that TTFB stays within this range.
- Metric: Database Performance
- Target: < 1 second per query
- Baseline: 2 seconds per query
- Example: Measure metrics related to the performance of the database used by the application, such as response time and query time. Set a target of 1 second per query or less, and track performance over time to ensure that database performance stays within acceptable limits.
- Metric: Network Latency
- Target: < 100 ms
- Baseline: 150 ms
- Example: Measure the time it takes for data to travel between the user's device and the application's servers. Set a target of 100 ms or less for this metric, and track performance over time to ensure that network latency stays within acceptable limits.
By setting clear targets for each of these SaaS performance metrics, businesses can establish benchmarks that reflect the needs of their users and the requirements of their application. Continuously monitoring performance against these benchmarks and making adjustments as needed can help ensure that the SaaS application delivers optimal performance and meets the needs of its users.
SaaS applications are only as good as their performance. To ensure optimal performance and deliver a seamless user experience, businesses need to monitor their SaaS applications continuously. This is where SaaS performance monitoring tools come into play. In this article, we will explore the top SaaS performance monitoring tools, compare their features, and provide pros and cons of each tool.
Selecting the right SaaS performance monitoring tool is crucial for ensuring optimal performance and delivering a seamless user experience. However, with so many tools available on the market, it can be challenging to choose the right one for your business. In this section, we will explore the key factors to consider when selecting a SaaS performance monitoring tool. By understanding these factors, businesses can make an informed decision and choose a tool that meets their specific needs and budget.
There are several different types of SaaS performance monitoring software available, including:
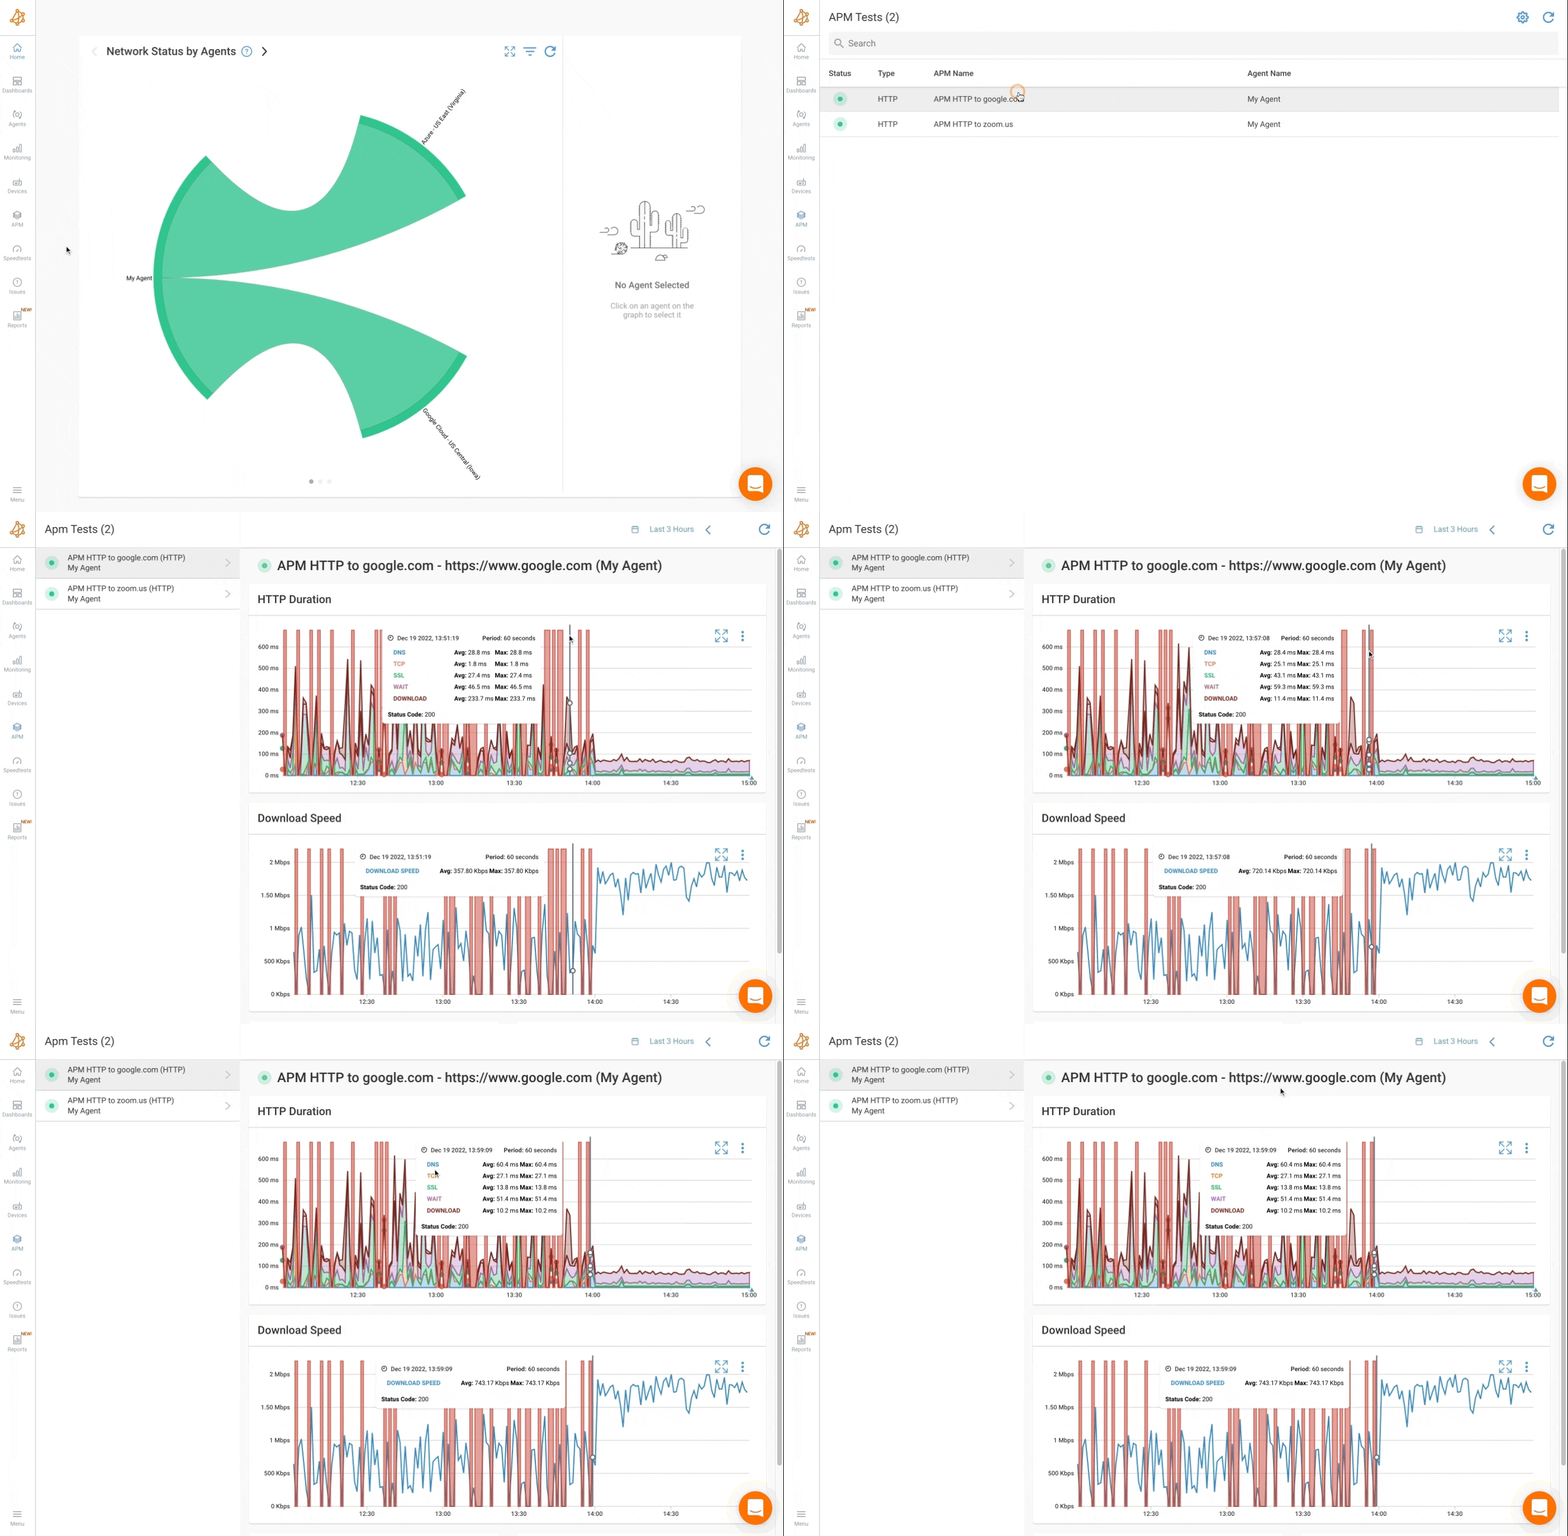
Application Performance Management (APM) tools: APM tools provide end-to-end monitoring of SaaS applications, from the front-end user experience to the back-end infrastructure. They can help businesses identify performance bottlenecks and troubleshoot issues in real-time.
Discover APM for HTTP URLs: Enhance web app performance, troubleshoot issues & delight users with powerful monitoring solutions.
Learn more

Infrastructure Monitoring tools: Infrastructure monitoring tools focus on the underlying infrastructure that supports SaaS applications, including servers, networks, and databases. They can help businesses identify performance issues and optimize infrastructure resources.
Network Performance Monitoring (NPM) tools: NPM tools provide visibility into the performance of networks that support SaaS applications, including latency, packet loss, and throughput. They can help businesses troubleshoot network issues and ensure that the application is performing optimally.
Log Management tools: Log management tools aggregate and analyze log data from SaaS applications and infrastructure. They can help businesses identify and troubleshoot issues by providing insights into system behavior and performance.
Real User Monitoring (RUM) tools:
RUM tools capture and analyze user interactions with SaaS applications, providing insights into user behavior and the user experience. They can help businesses optimize the application to meet user needs and enhance the user experience.
Synthetic Monitoring tools: Synthetic monitoring tools simulate user interactions with SaaS applications to test performance and identify issues. They can help businesses proactively identify and address performance issues before they impact users.
By using a combination of these different types of SaaS performance monitoring software, businesses can gain comprehensive visibility into the performance of their SaaS applications and infrastructure.
This can help them identify issues quickly, troubleshoot problems, and optimize performance to deliver a seamless user experience.
SaaS applications have become increasingly important for businesses, but monitoring their performance can be a challenge. To ensure that SaaS applications are performing optimally, businesses need to use performance monitoring tools that provide real-time visibility into application performance.
In this section, we have provided an overview of the top 10 SaaS performance monitoring tools, including Obkio, Datadog, New Relic, AppDynamics, SolarWinds AppOptics, Site24x7, Dynatrace, LogicMonitor, Pingdom, and Stackify.
These tools offer businesses a wide range of capabilities to monitor and optimize the performance of their SaaS applications, including APM, infrastructure monitoring, log management, end-user monitoring, network performance monitoring, and more.
As mentioned earlier, there are many SaaS monitoring solutions available in the market, and each solution is designed to address different scenarios and needs.
For instance, some solutions like New Relic and Datadog are ideal for complex application performance monitoring, while others like Obkio focus on monitoring SaaS availability, SLA Monitoring and user experience. There are also solutions like AppDynamics and Dynatrace that specialize in end-to-end monitoring of cloud-native applications and infrastructure. For monitoring mobile applications, Flutter performance monitoring tools and techniques, such as UXCam, Flutter DevTools, and Firebase Crashlytics can help you track, analyze, and improve the stability of your network.
Additionally, some monitoring solutions are better suited for on-premise environments, while others are tailored for 100% cloud-based deployments. It's important to evaluate the features, integrations, and pricing of each solution before selecting one that fits your organization's specific needs and requirements.
By selecting the right SaaS performance monitoring tool, businesses can ensure that their applications are delivering a seamless user experience and meeting the needs of their customers.
Here's an overview of ten best SaaS performance monitoring tools.
1. Obkio: Obkio is a cloud-based network performance monitoring tool that provides real-time visibility into the performance of SaaS application networks. It offers a wide range of monitoring capabilities, including network performance monitoring, bandwidth monitoring, and packet loss monitoring. Obkio is designed to be easy to use and requires no additional hardware or software.
Don't let your SaaS slow down your business!
Sign up for Obkio's Free Trial today to proactively monitor and detect SaaS issues in your network, improve your network performance, and ensure a better user experience.
- 14-day free trial of all premium features
- Deploy in just 10 minutes
- Monitor performance in all key network locations
- Measure real-time network metrics
- Identify and troubleshoot live network problems

2. Datadog: Datadog is a cloud-based monitoring platform that provides real-time visibility into the performance of SaaS applications. It offers comprehensive monitoring capabilities, including application performance monitoring (APM), infrastructure monitoring, and log management. Datadog supports multiple programming languages, including Python, Java, Ruby, and Node.js, and integrates with over 400 technologies and services.
3. New Relic: New Relic is another cloud-based monitoring platform that provides comprehensive monitoring of SaaS applications. It offers a wide range of monitoring capabilities, including APM, infrastructure monitoring, and mobile monitoring. New Relic supports multiple programming languages, including Java, .NET, Node.js, PHP, and Python.
4. AppDynamics: AppDynamics is an application performance management platform that provides real-time visibility into the performance of SaaS applications. It offers a wide range of monitoring capabilities, including APM, infrastructure monitoring, and end-user monitoring. AppDynamics supports multiple programming languages, including Java, .NET, Node.js, PHP, and Python.
5. SolarWinds AppOptics: SolarWinds AppOptics is a cloud-based monitoring platform that offers real-time visibility into the performance of SaaS applications. It provides a wide range of monitoring capabilities, including APM, infrastructure monitoring, and log management. SolarWinds AppOptics supports multiple programming languages, including Java, .NET, Node.js, PHP, and Python.
6. Site24x7: Site24x7 is a cloud-based monitoring platform that provides comprehensive monitoring of SaaS applications. It offers a wide range of monitoring capabilities, including APM, infrastructure monitoring, and end-user monitoring. Site24x7 supports multiple programming languages, including Java, .NET, Node.js, PHP, and Python.
7. Dynatrace: Dynatrace is an application performance management platform that provides real-time visibility into the performance of SaaS applications. It offers a wide range of monitoring capabilities, including APM, infrastructure monitoring, and end-user monitoring. Dynatrace supports multiple programming languages, including Java, .NET, Node.js, PHP, and Python.
8. LogicMonitor: LogicMonitor is a cloud-based monitoring platform that offers comprehensive monitoring of SaaS applications. It provides a wide range of monitoring capabilities, including APM, infrastructure monitoring, and log management. LogicMonitor supports multiple programming languages, including Java, .NET, Node.js, PHP, and Python.
9. Pingdom: Pingdom is a cloud-based monitoring platform that provides real-time visibility into the performance of SaaS applications. It offers a wide range of monitoring capabilities, including uptime monitoring, page speed monitoring, and transaction monitoring. Pingdom supports multiple programming languages, including Java, .NET, Node.js, PHP, and Python.
10. Stackify: Stackify is an application performance management platform that provides real-time visibility into the performance of SaaS applications. It offers a wide range of monitoring capabilities, including APM, infrastructure monitoring, and log management. Stackify supports multiple programming languages, including Java, .NET, Node.js, PHP, and Python.
11.CloudEagle: CloudEagle is a SaaS-based application management and monitoring platform that can integrate with internal SSO, finance, and HRIS systems and provide complete visibility on SaaS application performance, including usage, spend, license, and vendor information. CloudEagle supports multiple programming languages, including Java, Node.js, Python, and React.Js.
In summary, these ten SaaS performance monitoring tools offer businesses a wide range of capabilities to monitor and optimize the performance of their SaaS applications.
Selecting the right SaaS performance monitoring software is crucial for ensuring optimal application performance and meeting the needs of users. With so many options available, it can be challenging to determine which software is the best fit for your organization. To make the selection process easier, we have outlined some key criteria to consider when selecting a SaaS performance monitoring software.
These criteria include ease of use, compatibility, scalability, integration, real-time monitoring, customization, reporting and analytics, support and documentation, price and licensing, and reviews and ratings. By evaluating SaaS performance monitoring software based on these criteria, businesses can select a tool that meets their specific needs and provides the insights required to optimize the performance of their SaaS applications.
Here are some criteria to consider when selecting a SaaS performance monitoring software:
Ease of use: The software should be easy to install, set up, and use. It should also provide an intuitive user interface and clear reporting to make it easy to interpret and act on the data.
Compatibility: The software should be compatible with the operating system, database, and programming languages used in the SaaS application.
Scalability: The software should be able to handle the scale of the SaaS application and support growth over time.
Integration: The software should integrate with other tools and services used in the SaaS environment to provide a comprehensive view of application performance.
Real-time monitoring: The software should provide real-time monitoring and alerting capabilities to help identify and address issues before they impact users.
Customization: The software should offer customization options to tailor monitoring to the specific needs of the SaaS application.
Reporting and analytics: The software should provide detailed reporting and analytics capabilities to help identify trends, track performance against benchmarks, and identify areas for improvement.
Support and documentation: The software should come with comprehensive documentation and provide support options in case of any issues.
Price and licensing: The software should be priced reasonably and offer flexible licensing options to match the needs of the SaaS application.
Reviews and ratings: The software should have positive reviews and ratings from other users and industry experts.
By considering these criteria, businesses can select a SaaS performance monitoring software that meets their specific needs and provides valuable insights to optimize the performance of their SaaS applications.
In conclusion, optimizing SaaS performance monitoring is crucial for businesses to ensure the optimal performance of their applications, enhance user experience, reduce downtime and associated costs, and improve scalability and capacity planning. By selecting the right monitoring tools, establishing benchmarks, implementing proactive monitoring strategies, and continuously evaluating and optimizing performance, businesses can ensure that they are delivering a reliable, high-quality service that meets the needs of their customers.
If you're looking to get started with SaaS performance monitoring, Obkio is a great place to begin. With its comprehensive network performance monitoring capabilities and user-friendly interface, Obkio can help you monitor your SaaS application's performance and optimize its operation to ensure optimal performance. Try Obkio for free today and learn more about how it can help you take your SaaS performance monitoring to the next level.
Sources:


 Obkio Blog


