Table of Contents
Table of Contents
Had enough of wading through alternative listings that leave you scratching your head? We feel your frustration! It's downright exasperating when recommendations are based on review counts, random algorithms, or pay-per-click schemes. We've all seen it: a behemoth software editor inexplicably crowned as the top alternative to a network performance monitoring software, despite having zero shared features. It's enough to make you question the sanity of it all!
That's precisely why we've taken matters into our own hands. We've embarked on a mission to create a listing that actually makes sense. Get ready for a breath of fresh air as we unveil alternatives that have been meticulously curated to align with the essential features and capabilities you're seeking. No more confusion or misleading rankings. It's time to cut through the noise and present you with alternatives that genuinely cater to your network performance monitoring needs.
So, buckle up and prepare for a thrilling ride as we showcase a thoughtfully crafted selection of alternatives that make perfect sense. Empowered with this newfound clarity, you can confidently make informed decisions and find the ideal match for your specific requirements. Say farewell to perplexing listings, and let's plunge into a world of alternatives that truly make sense!
Kentik is a cloud-based network analytics platform that helps organizations monitor and optimize their network performance and security. It offers a wide range of features, including real-time network traffic analysis, deep packet inspection, and data visualization tools that allow users to gain insights into their network traffic and troubleshoot issues quickly.
Kentik is designed to help network administrators and engineers understand how their networks are performing, identify potential problems, and make informed decisions to improve network efficiency and security. Its powerful analytics engine can process huge amounts of data from various sources, including routers, switches, and other network devices, to provide a comprehensive view of network traffic and behavior.
So when we're thinking of Kentik alternatives, we're looking at solutions with similar feature-sets, goals, and capabilities.
The market for network performance monitoring tools has undergone a substantial surge in recent years, with a broad range of software solutions available to cater to the varied needs of businesses.
1. Pure Network Performance Monitoring Tools
One category of Kentik alternatives is pure network performance monitoring tools. These advanced tools are designed to collect and analyze multiple network performance metrics, including latency, packet loss, throughput, jitter and network topology, and. The result is real-time insights into network performance that help identify potential bottlenecks and assist IT teams in troubleshooting intermittent network issues. With their cloud-based architecture, these tools are an excellent choice for businesses that operate on cloud-based infrastructures.
2. Traditional Network Monitoring Tools
Another category of Kentik alternatives is traditional network monitoring tools that gather data from network devices such as routers, switches, and firewalls to analyze network traffic and provide valuable insights into network health and performance. These tools can identify potential security threats and anomalies, aiding IT teams in troubleshooting network issues. However, unlike pure network performance monitoring tools, traditional network monitoring tools may require on-premises hardware.
3. Open-Source Network Monitoring Tools
Open-source network monitoring tools are free and open-source software designed for network monitoring and analysis. They offer various features, including network discovery, protocol analysis, device monitoring, and bandwidth monitoring, making them a cost-effective option for businesses with budget constraints.
4. All-in-One IT Monitoring Software
Finally, all-in-one IT monitoring software provide an extensive suite of tools that enable IT teams to monitor and manage their entire IT infrastructure from a single platform. These comprehensive tools include network monitoring, server monitoring, application monitoring, log monitoring, and security monitoring, making them an all-encompassing solution for businesses.
In conclusion, businesses have an extensive range of Kentik alternatives to choose from, each with its unique features and benefits. The key to selecting the right tool is to identify the specific requirements of the business and choose a tool that meets those requirements. Whether it be pure cloud-based network performance monitoring tools, traditional network monitoring tools, open-source network monitoring tools, or all-in-one IT software editors, selecting the right solution can help businesses streamline their network performance monitoring and achieve their business objectives.
In this article, we will examine some of the top alternatives to Kentik, a leading network performance monitoring platform that enables businesses to monitor their network performance. Our discussion will encompass a range of alternatives, including pure options such as Obkio, Catchpoint, AppNeta, and ThousandEyes, as well as IT platforms like Solarwinds or PRTG. Whether you seek a more affordable option or a platform with different features, we've got you covered.
Our motivation for creating this article is due to our observation that many Kentik alternative listings can be confusing and include software that does not match the required features. We aim to provide a comprehensive review that is both informative and user-friendly. So, let's delve into some of the best alternatives to Kentik.


This section presents a list of 12 network performance monitoring software that can serve as alternatives to Kentik. These alternatives were chosen based on their ability to offer similar or matching features and functionalities to Kentik, making them suitable options for organizations that are looking for alternatives.
Network performance monitoring software helps organizations to monitor and analyze network performance metrics, including network latency, bandwidth utilization, and packet loss, among others. Kentik is one of the leading network performance monitoring tools, but due to various reasons such as cost, compatibility issues, or specific feature requirements, organizations may seek alternatives.
The software listed in this section were selected based on their ability to provide similar or matching features to Kentik, including network visibility, monitoring of cloud-based applications, real-time network performance analysis, and network troubleshooting capabilities, among others. These software are viable options for organizations that are looking for alternatives to Kentik and want to maintain the same level of network performance monitoring functionalities.
Obkio Network Performance Monitoring tool is a simple Network Monitoring and Troubleshooting SaaS solution designed to monitor end-to-end network performance from the end user perspective, and to fulfil the need within the industry for a solution that simplifies network monitoring for all network types. Obkio leverages Network Monitoring Agents and synthetic traffic to continuously identify the causes of intermittent VoIP, video, and applications slowdown in seconds - and identify the data you need to troubleshoot and ultimately improve the end-user experience.
Obkio's Network Performance Monitoring (NPM) tool and Kentik, while both addressing network monitoring needs, have different strengths and use cases. Here are some points of comparison that highlight how Obkio's NPM tool can be considered an alternative to Kentik:

Focus on Synthetic Traffic: Obkio's NPM tool specializes in synthetic traffic simulation, providing organizations with the capability to emulate user behavior within the network. This allows for proactive monitoring of the end-user experience by generating controlled traffic to assess network performance.
SNMP and Device Monitoring: Obkio's NPM tool includes SNMP (Simple Network Management Protocol) support and network device monitoring features, allowing organizations to gather detailed performance metrics from network devices. This provides additional insights into the health and performance of routers, switches, and other devices.
Ease of Deployment: Obkio is known for its easy and quick deployment. The lightweight agents and cloud-based architecture facilitate a streamlined setup process, making it accessible for organizations seeking a straightforward implementation.
User-Friendly Interface: Obkio offers a user-friendly interface that provides intuitive dashboards and reports. The platform is designed to be accessible to a broad range of users, including IT administrators and network professionals.
Holistic Network Performance Monitoring: Both Obkio and Kentik aim to provide a holistic view of network performance. While Kentik emphasizes flow-based analysis and network visibility, Obkio complements this with its synthetic traffic generation and end-user experience monitoring.
Cost-Effective Solution: Obkio positions itself as a cost-effective network performance monitoring solution, suitable for organizations of various sizes. Its pricing model, which may be based on the number of agents required, offers flexibility and scalability.
In fact, you can use Obkio's Price Calculator to build your custom plan, and get a customized quote that you can use for your business' budgetting and planning needs.

Learn more here : https://obkio.com/pricing/
Free Trial: https://obkio.com/signup/
While both tools offer comprehensive network performance monitoring, the choice between Obkio's NPM tool and Kentik would depend on specific organizational requirements, preferences, and the emphasis placed on synthetic traffic monitoring and ease of deployment. It's recommended to evaluate each tool based on your unique needs and trial periods to determine the best fit for your network monitoring objectives.
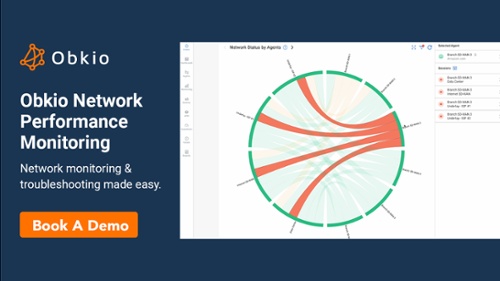
Obkio’s App Interface:
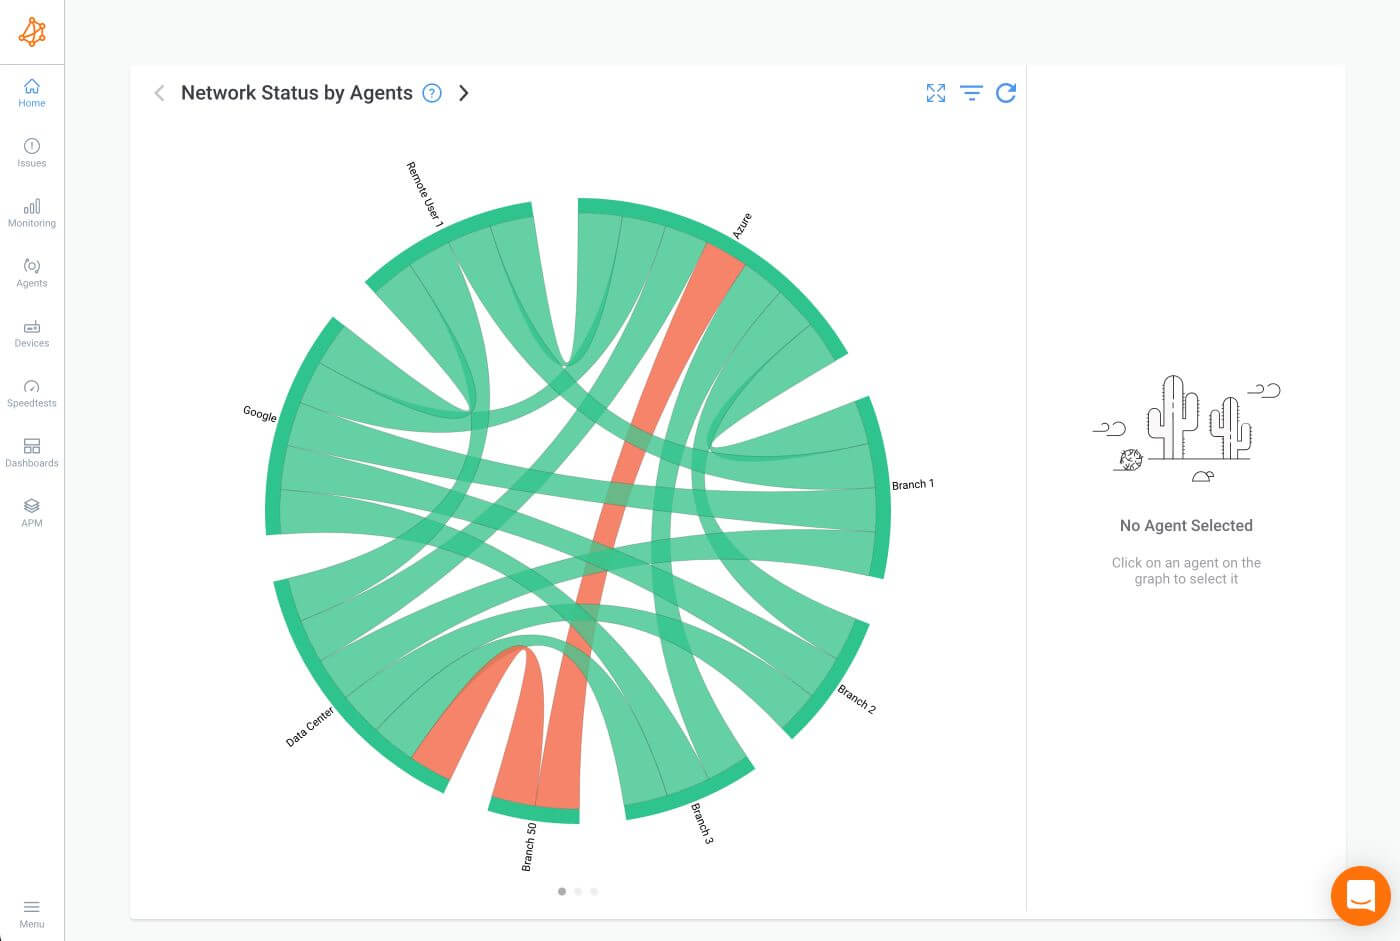
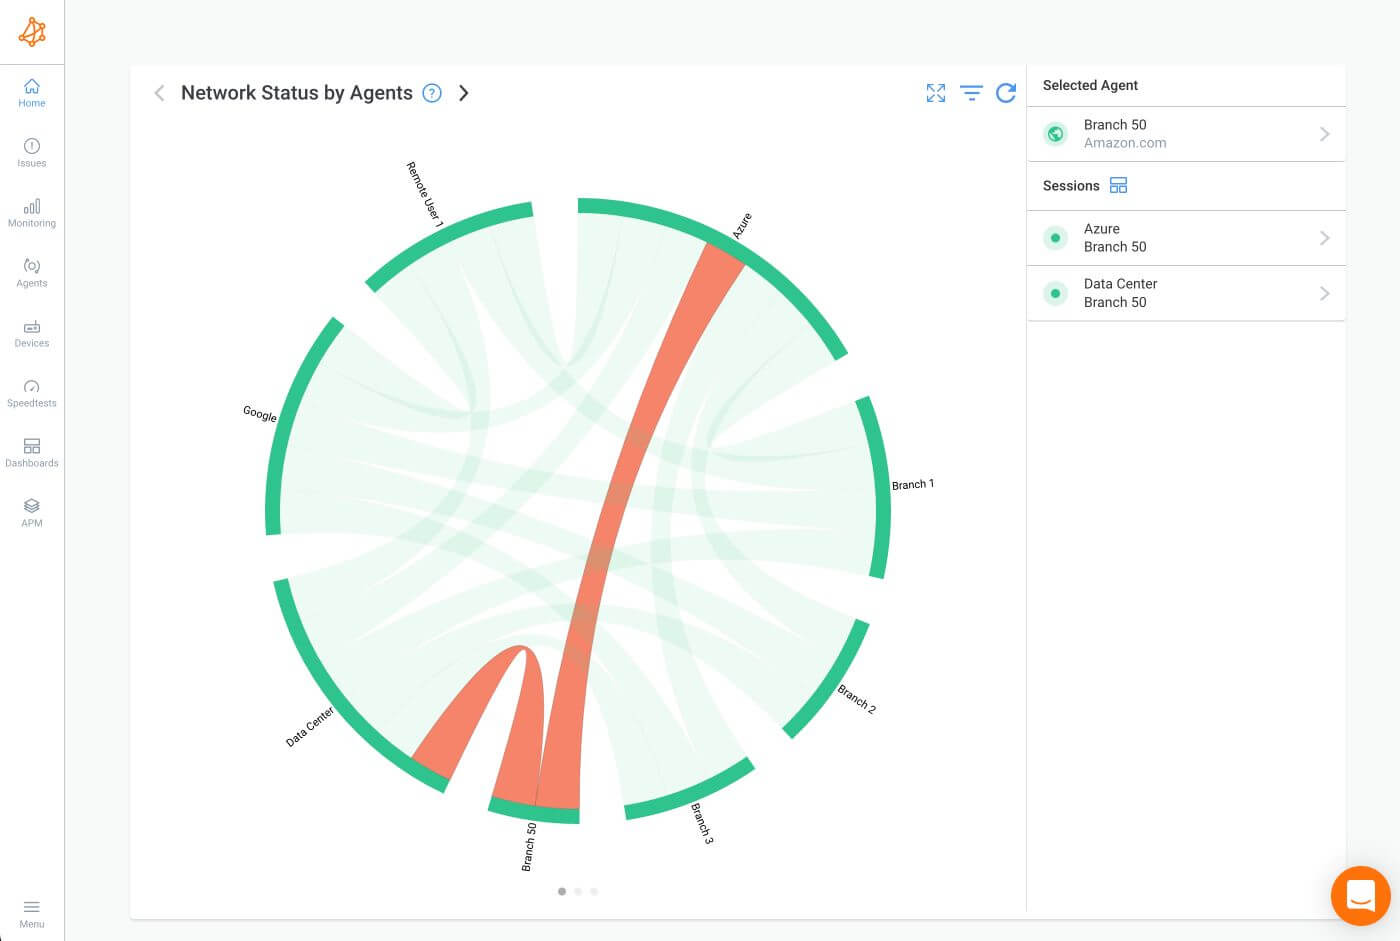
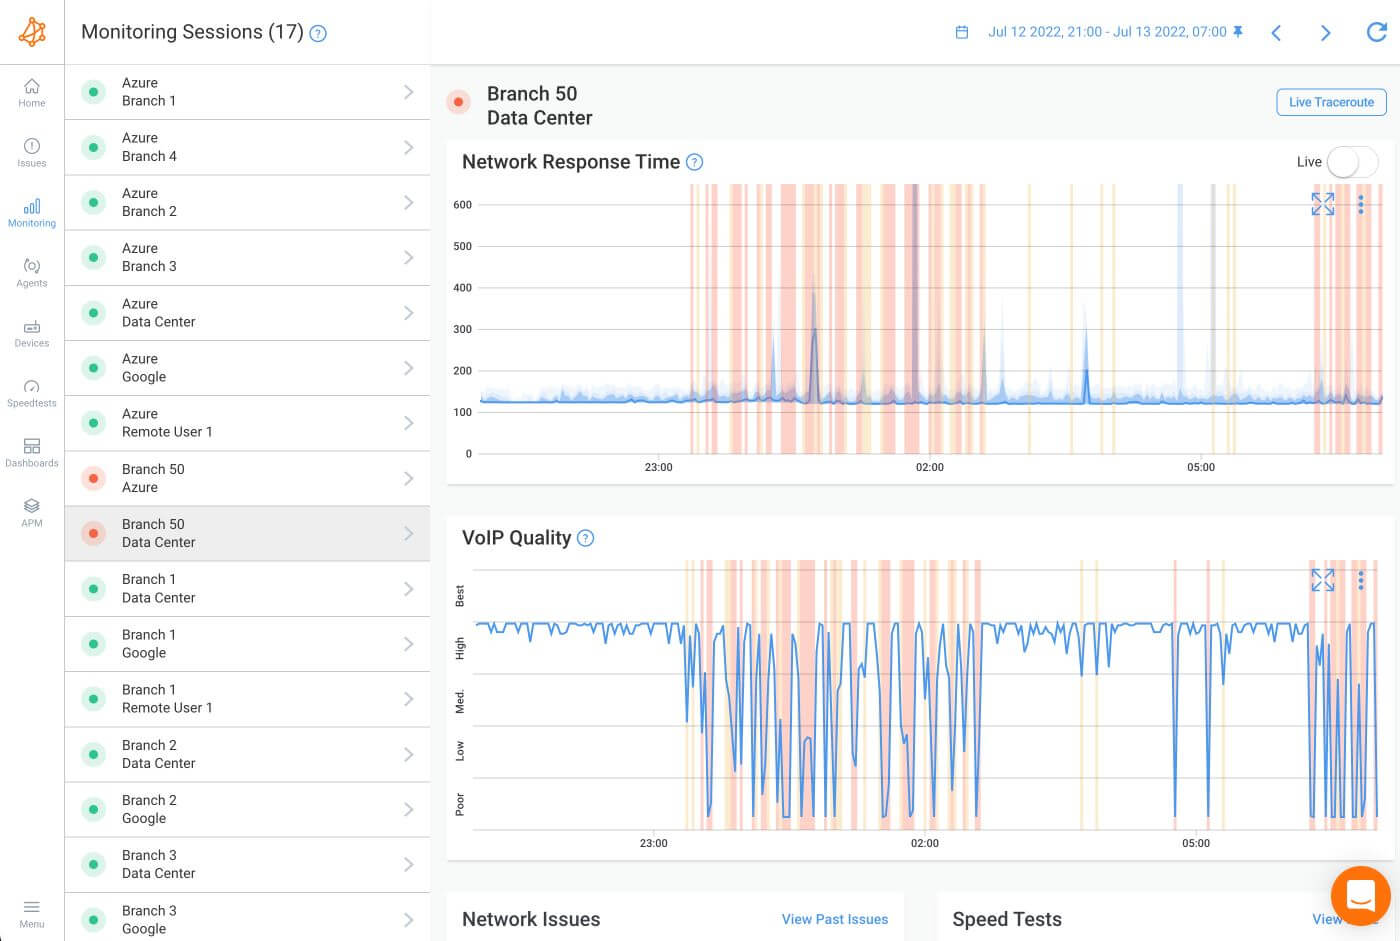

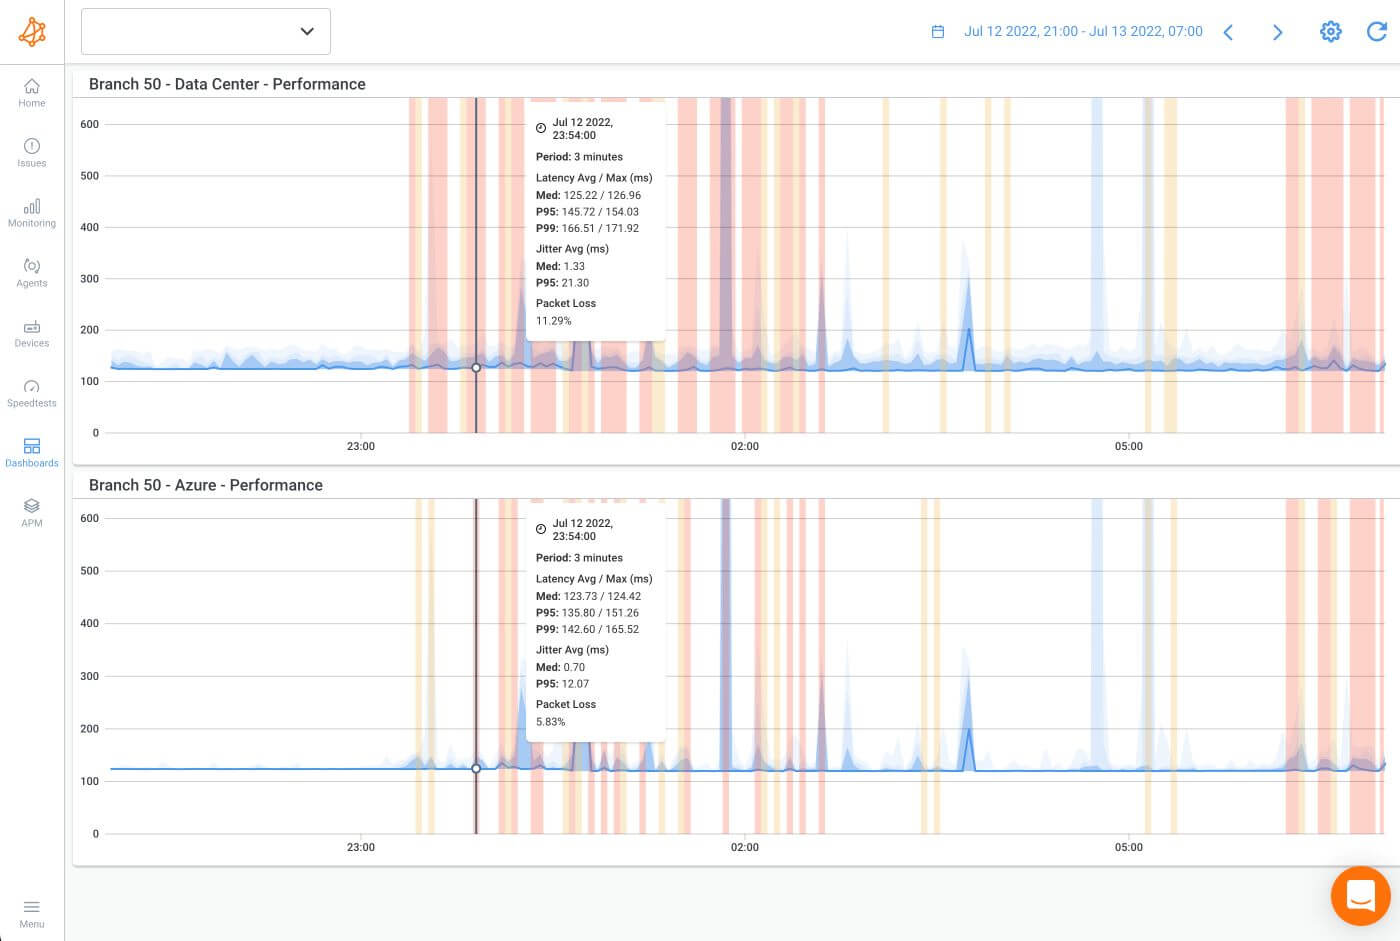
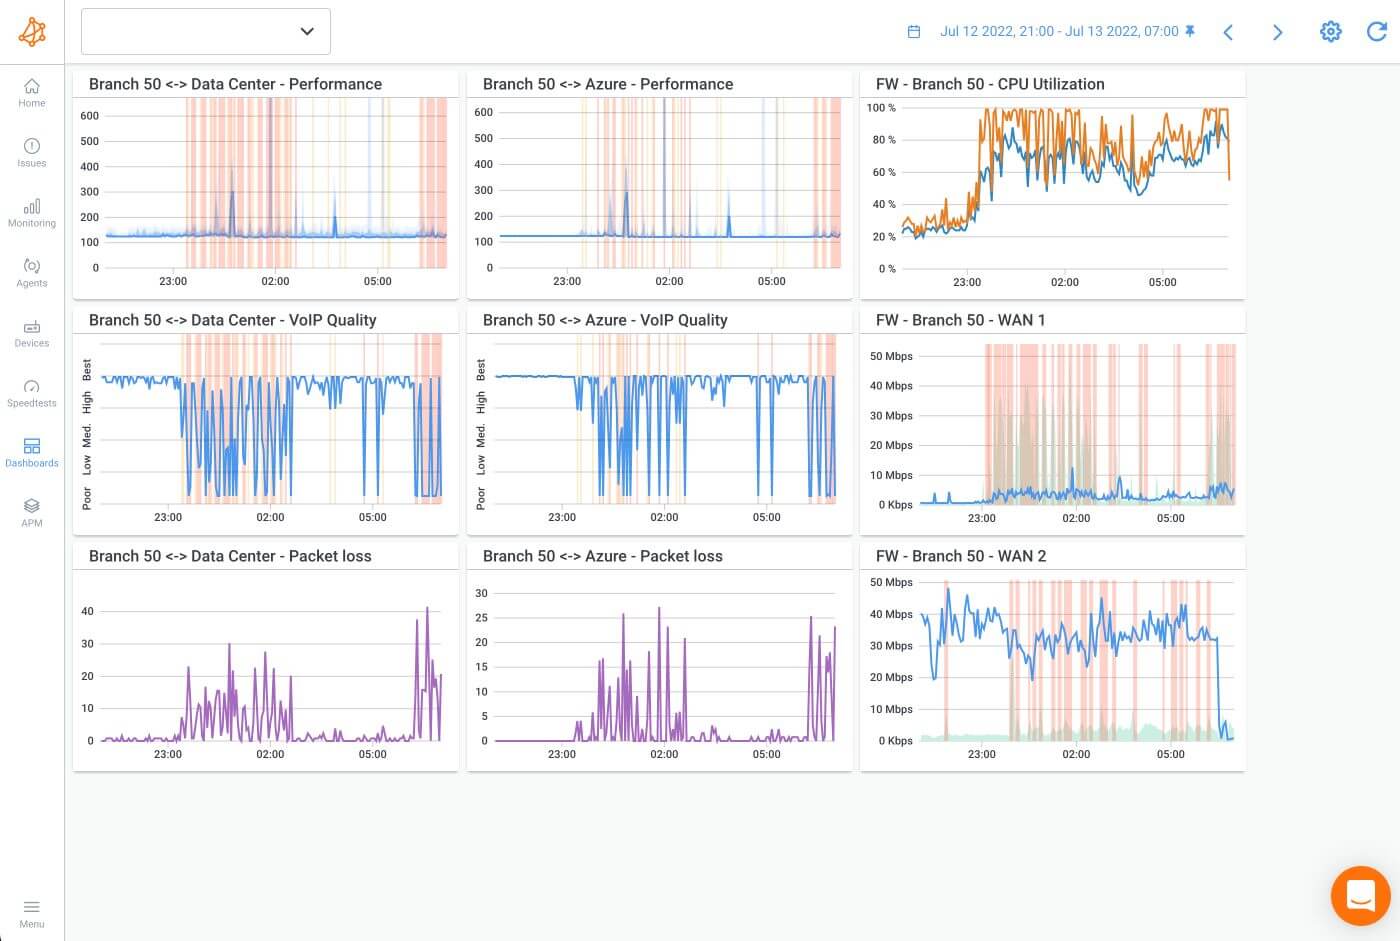
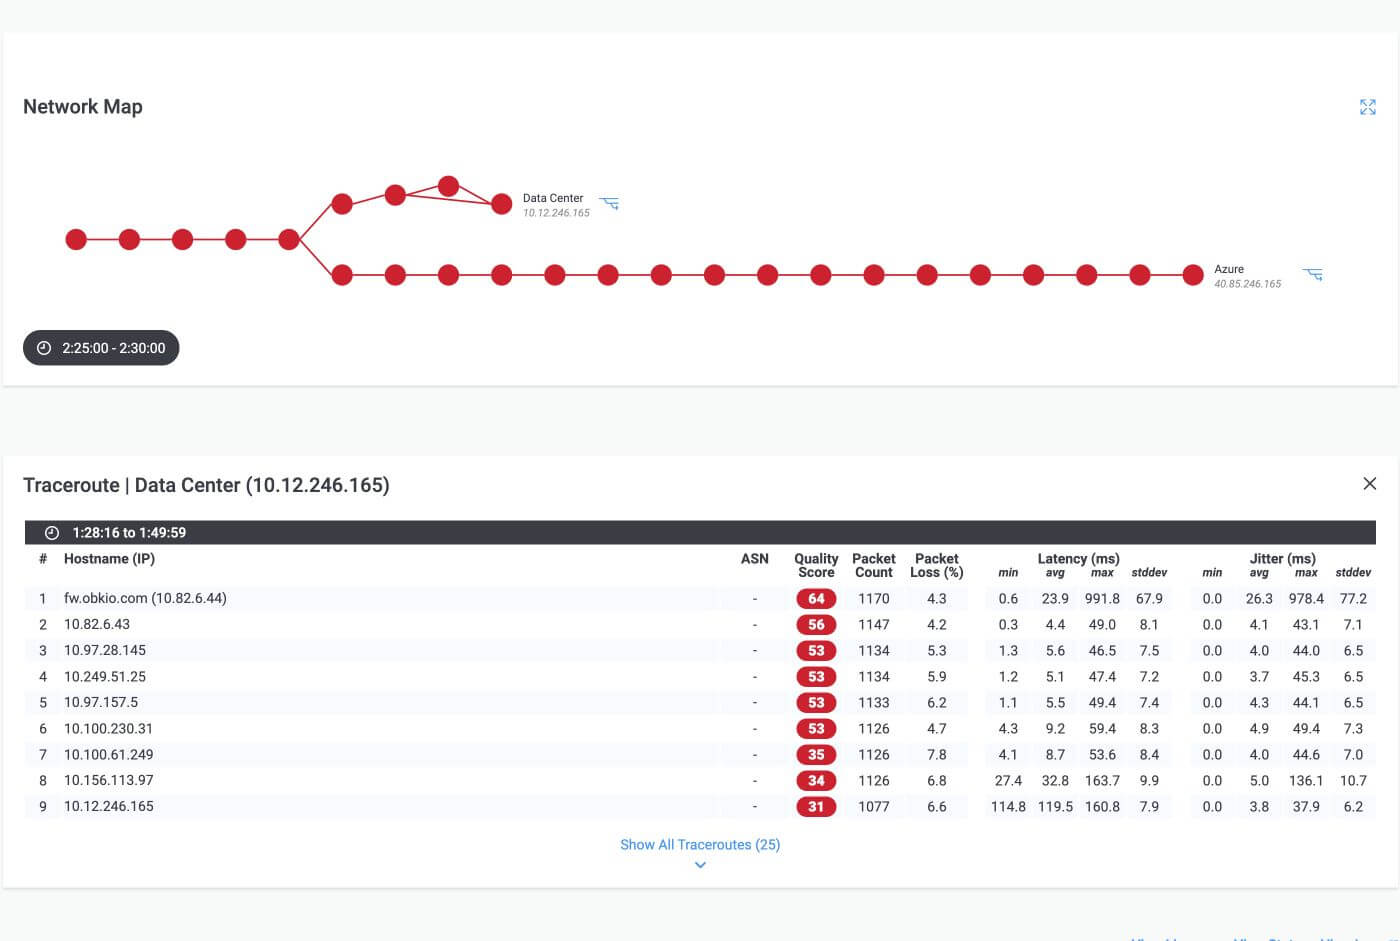
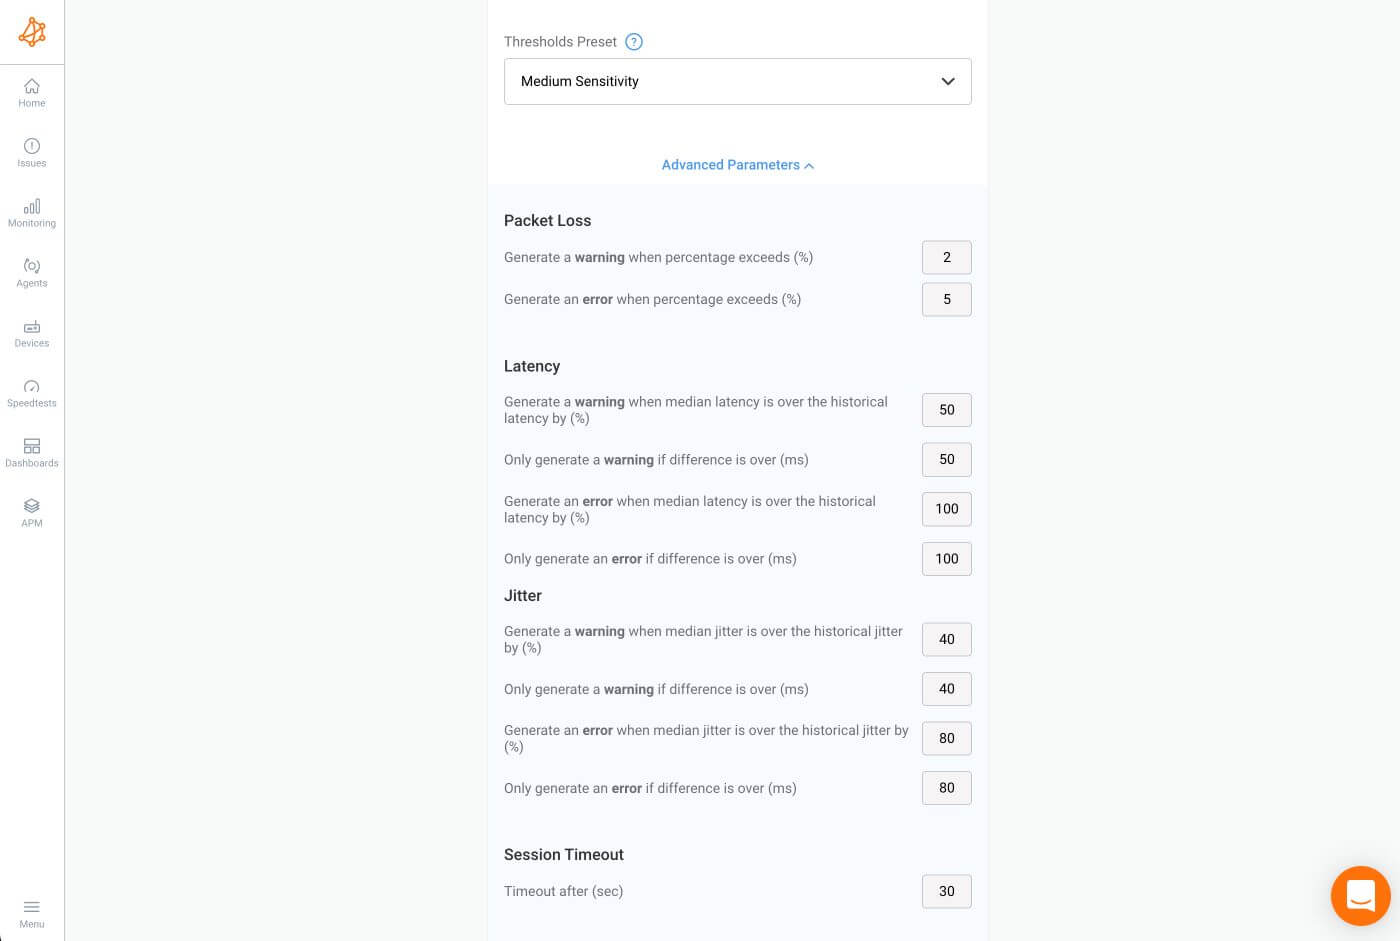
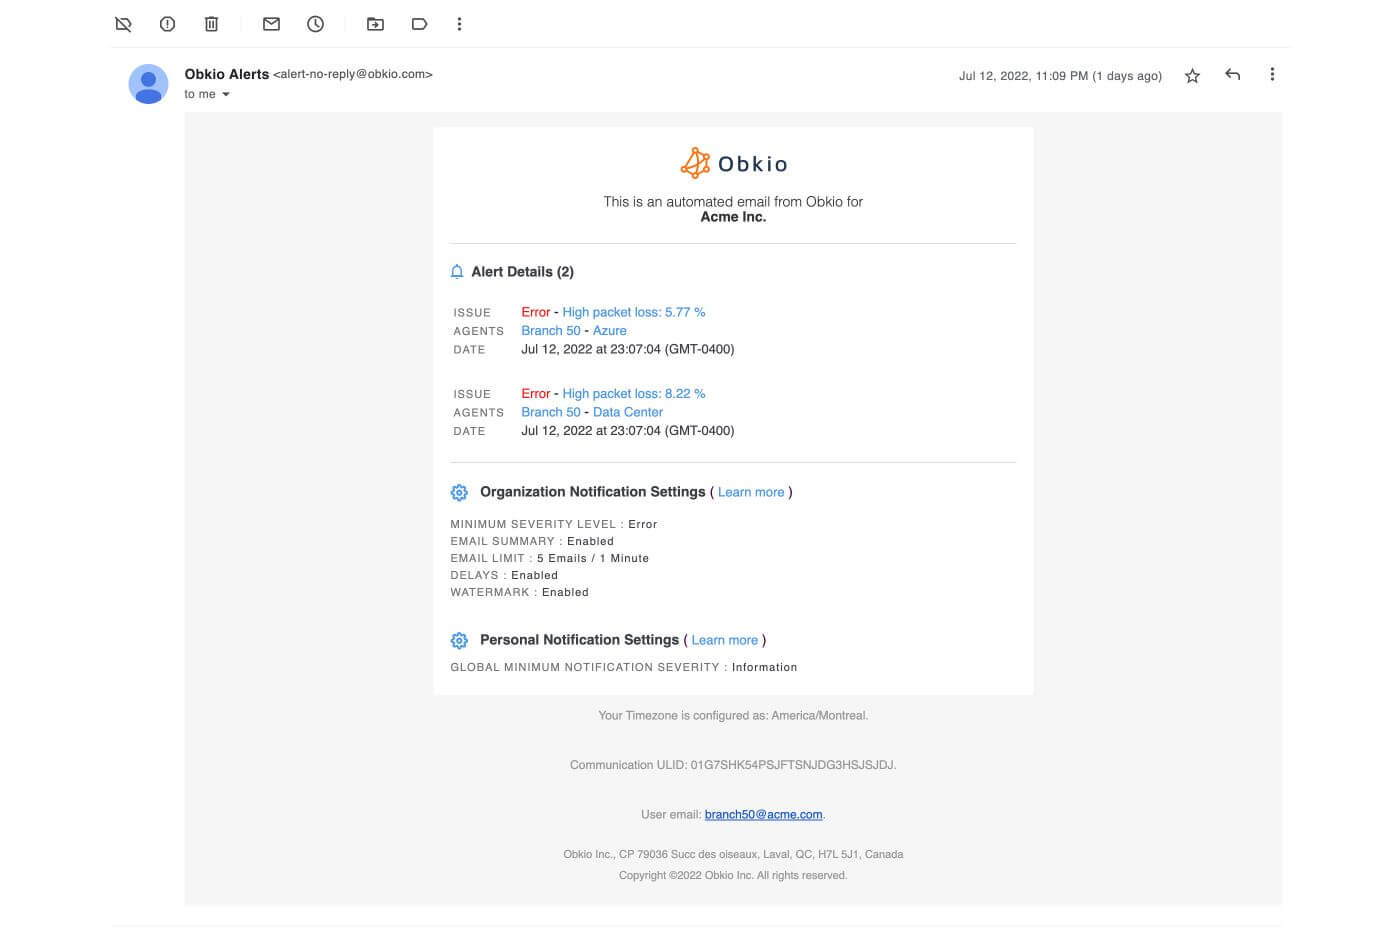
If you're interested in seeing Obkio's network monitoring platform in action, a detailed demo is available below to guide you through their app.
For a more personalized demo or working session, you can book a one-on-one demo with Obkio's Network Pros! Talk about your enterprise's use case, get network troubleshooting help, and learn about the features you need.
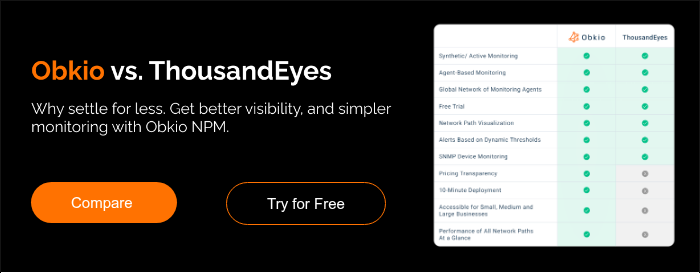
See how Obkio's Network Monitoring tool stands up against Kentik as the #1 Kentik Alternative.

ThousandEyes is a cloud-based network performance monitoring tool that offers real-time monitoring and analytics for network performance, application performance, and user experience. While Kentik emphasizes flow-based analysis and on-premises network visibility, ThousandEyes stands out for its global network testing, synthetic monitoring capabilities, and in-depth insights into the end-user experience.
Additionally, ThousandEyes places a notable emphasis on security insights, making it a robust choice for organizations with diverse needs, particularly those requiring detailed visibility into external networks, cloud services, and global internet performance.
ThousandEyes App:

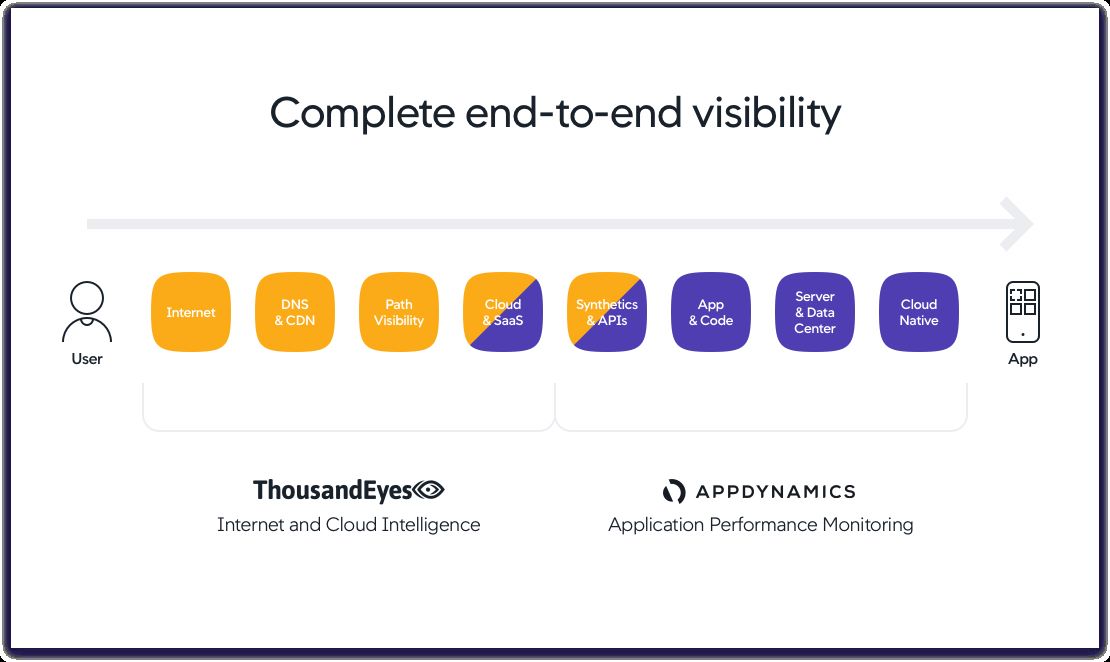
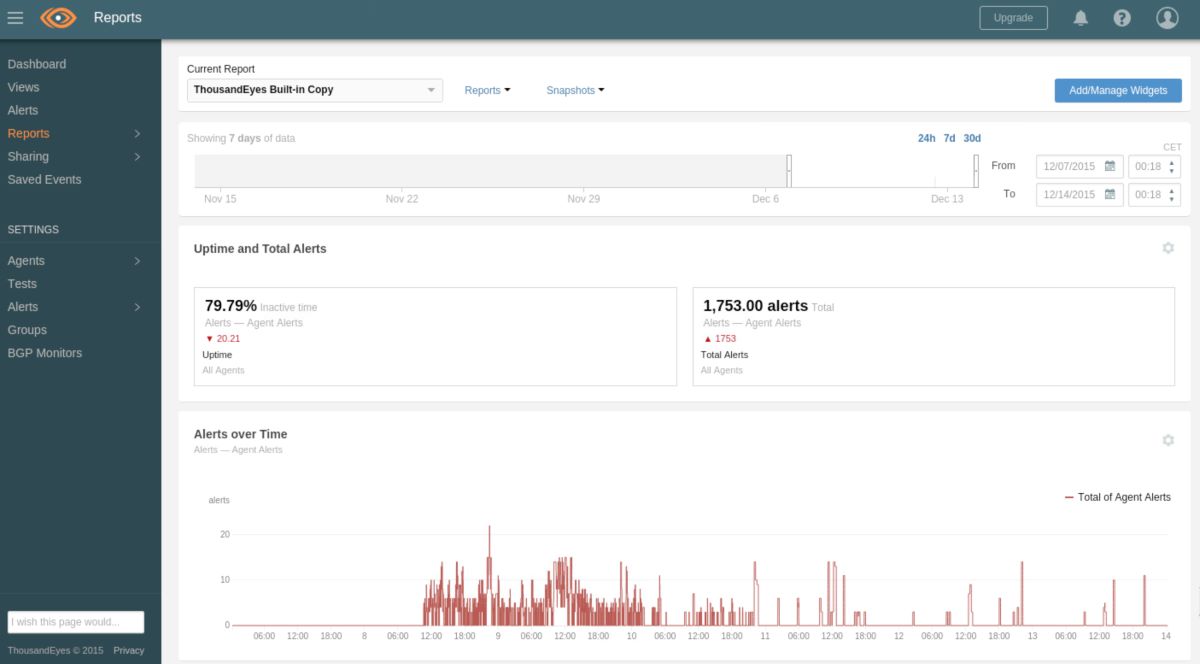
See how Obkio's Network Monitoring tool stands up against ThousandEyes as the best ThousandEyes Alternative.
Catchpoint is a cloud-based network and digital experience monitoring platform that provides real-time monitoring and analytics for network performance, web performance, and user experience. Catchpoint serves as a potential alternative to Kentik, with a distinct emphasis on user experience monitoring and global performance analysis. Its focus on application performance monitoring (APM) and extensive capabilities in assessing user experience make it suitable for organizations prioritizing web performance optimization.
While Kentik excels in flow-based analysis and network visibility, Catchpoint stands out for its emphasis on user-centric performance analytics and a widespread global monitoring network. The choice between the two depends on specific organizational priorities, whether centered on network traffic insights (Kentik) or user experience and application performance (Catchpoint).
Catchpoint App:
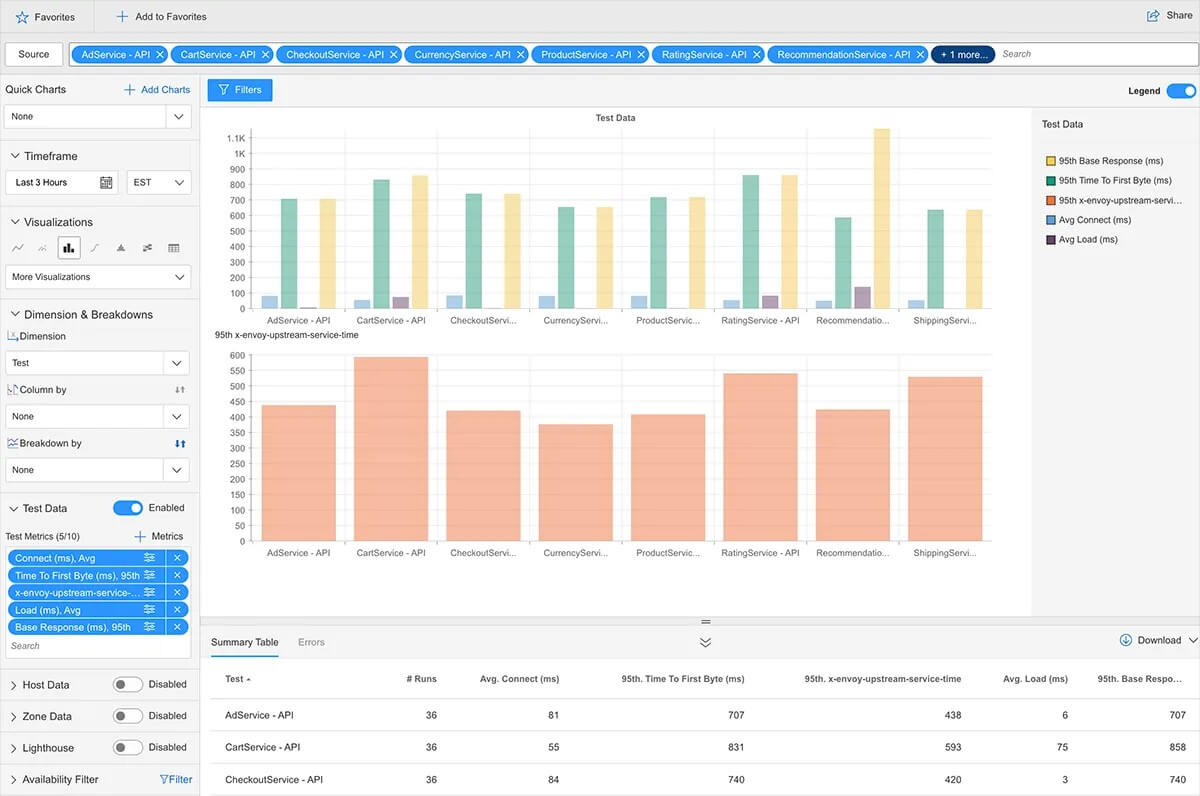
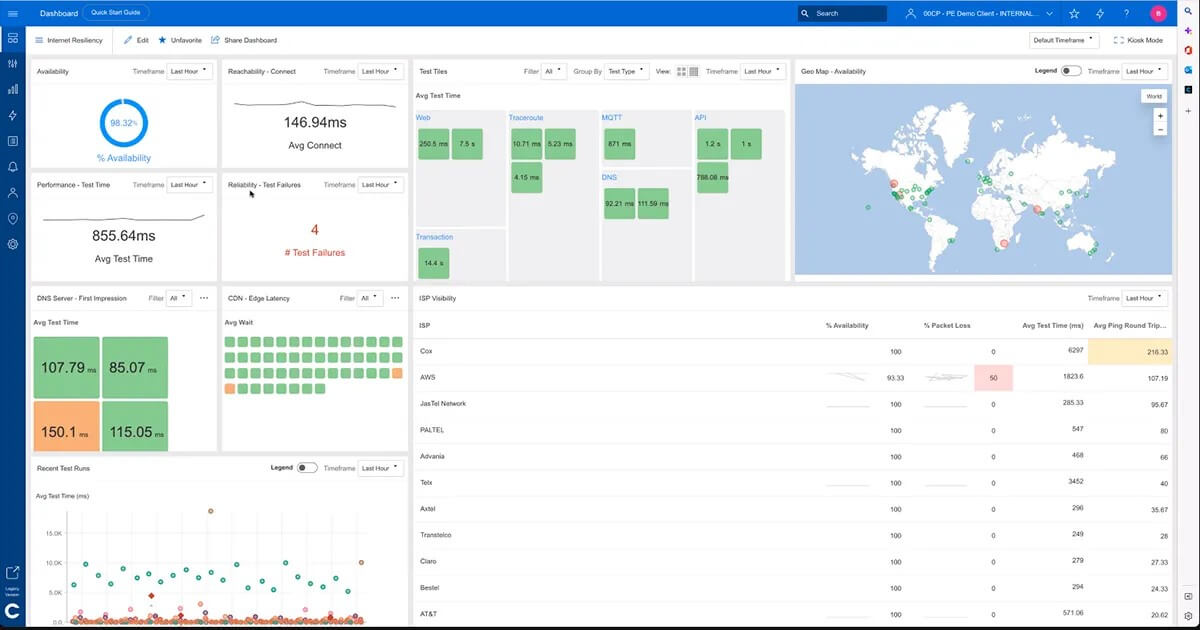
Experience the power of the Catchpoint platform in action! This demo provides an overview of Catchpoint's real-time visibility into global monitoring networks and its various platform dashboards. You'll discover how monitoring teams can leverage Catchpoint to perform synthetic tests, analyze real-time user data, and monitor full network performance to optimize the user experience.

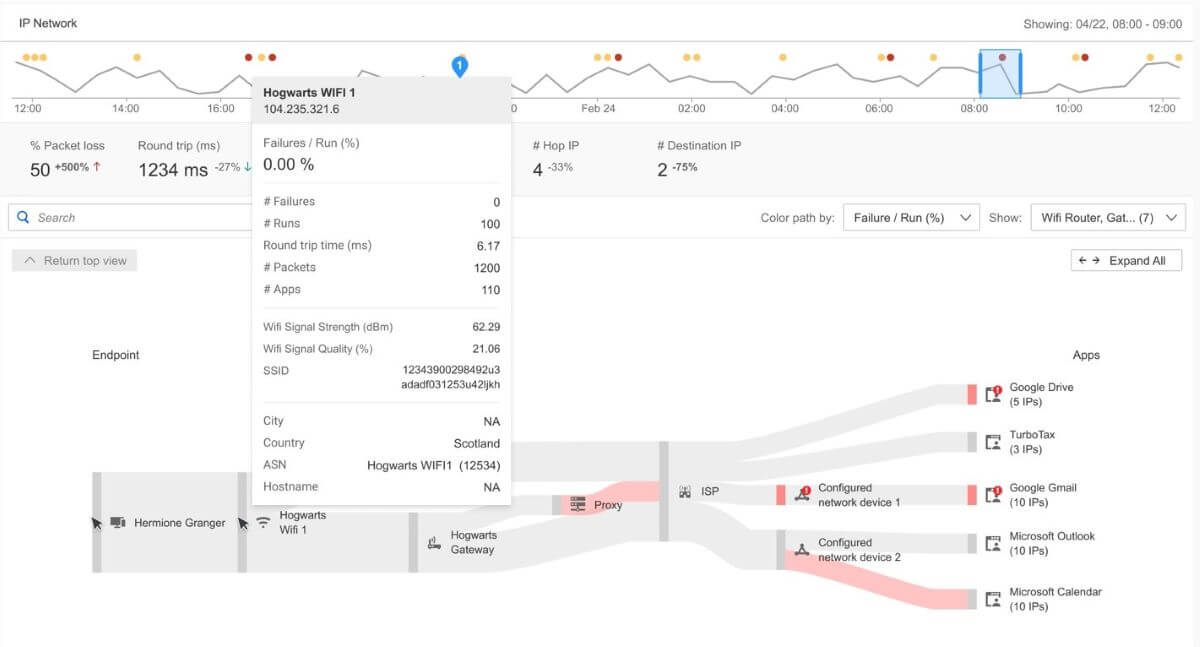
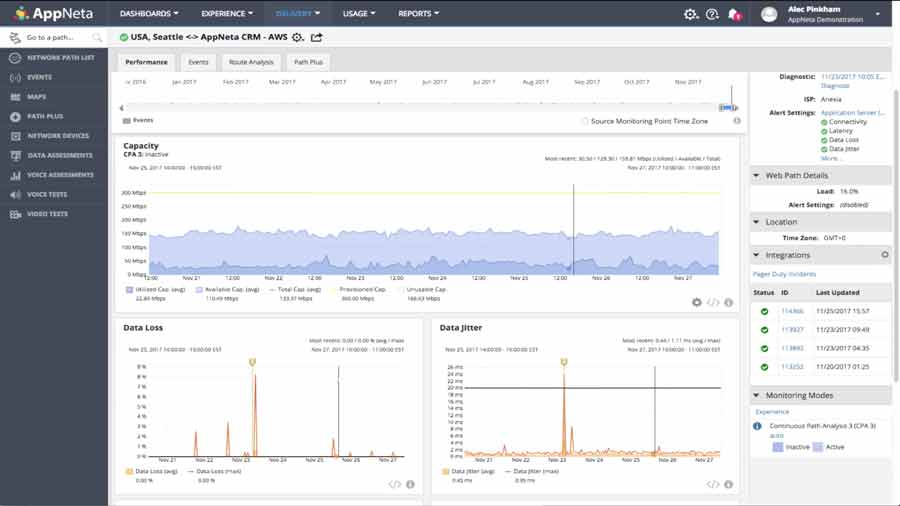
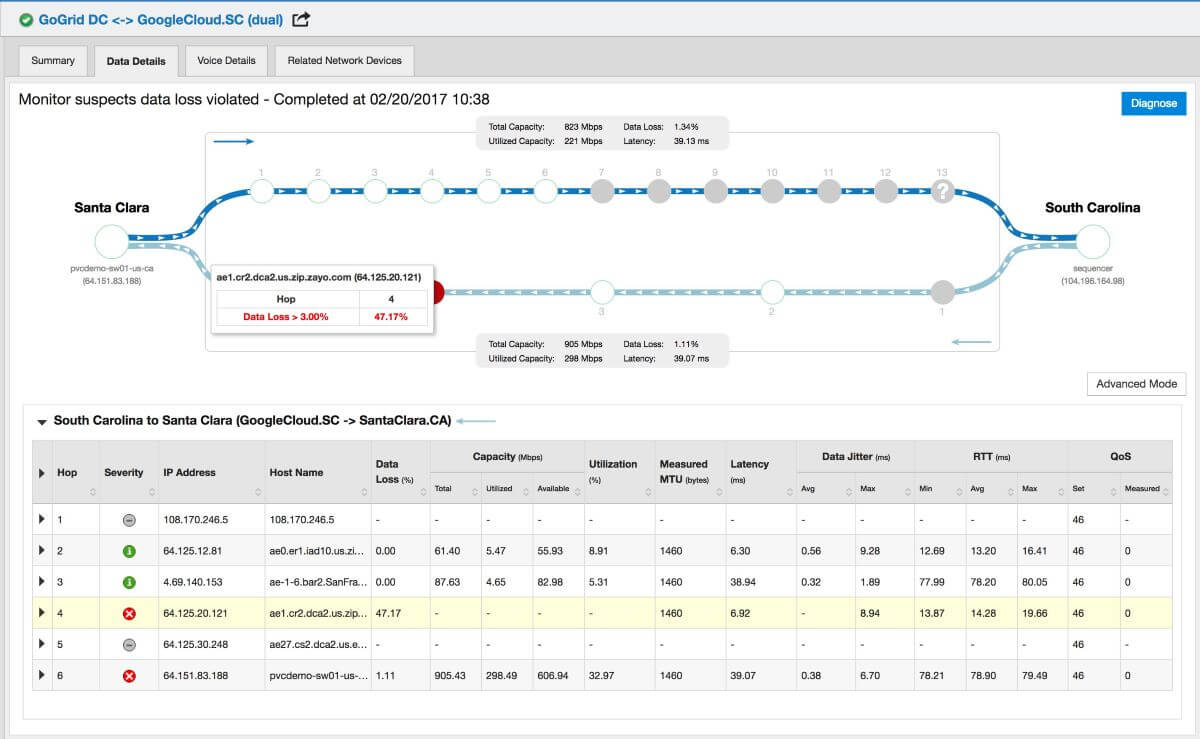
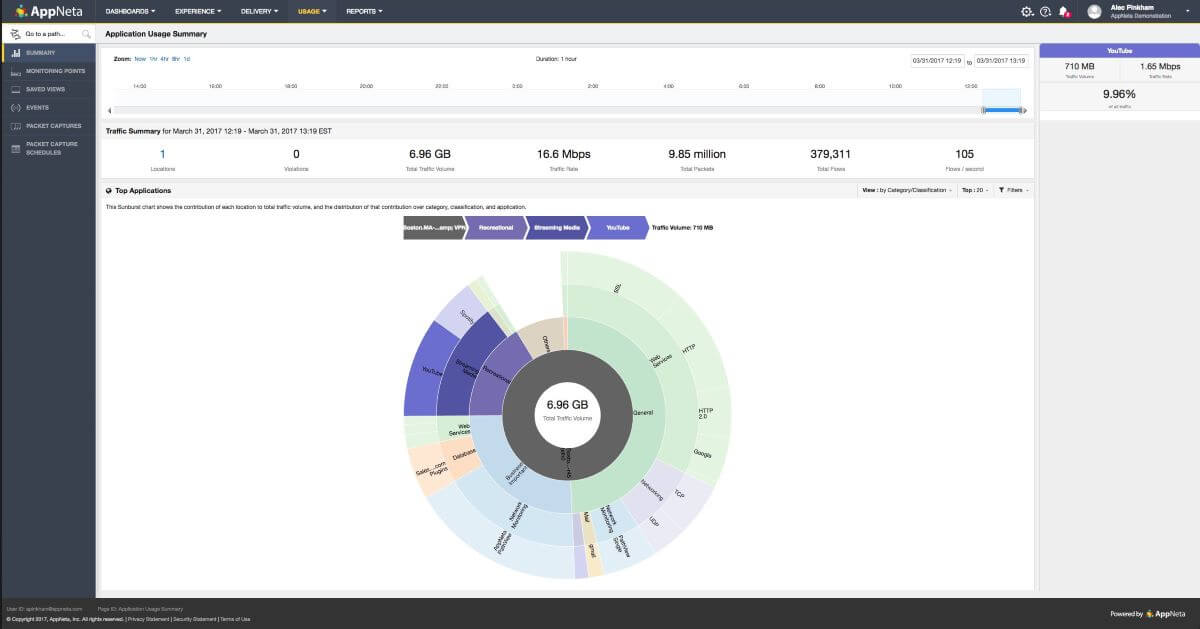
AppNeta is a network performance monitoring tool that offers real-time monitoring and analytics for network performance and application performance. AppNeta and Kentik are both network performance monitoring solutions, but they have distinct strengths. AppNeta stands out with its focus on end-to-end application performance monitoring, active and passive monitoring techniques, and an emphasis on user experience. It excels in providing detailed insights into application responsiveness and user satisfaction. AppNeta also offers global network visibility, ease of deployment, and a scalable pricing model based on active monitoring points.
While Kentik emphasizes flow-based analysis and comprehensive network visibility, AppNeta complements its network flow analysis with a strong focus on application performance. The choice between the two depends on specific organizational needs, priorities, and preferences.
AppNeta App:
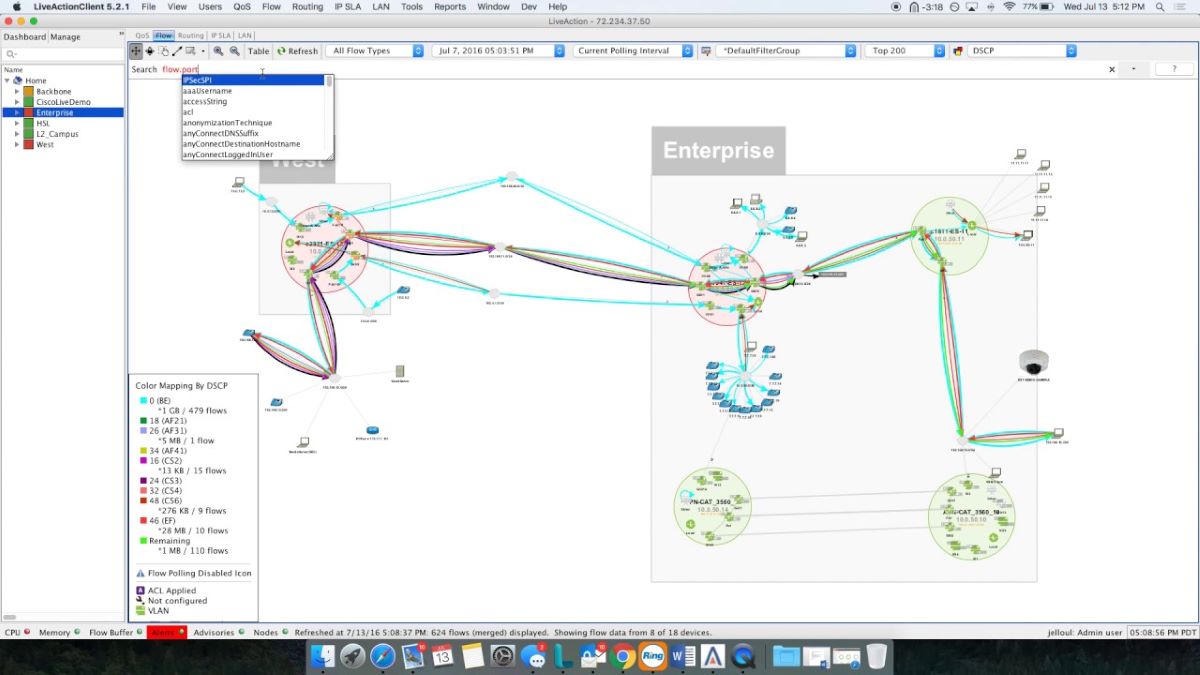
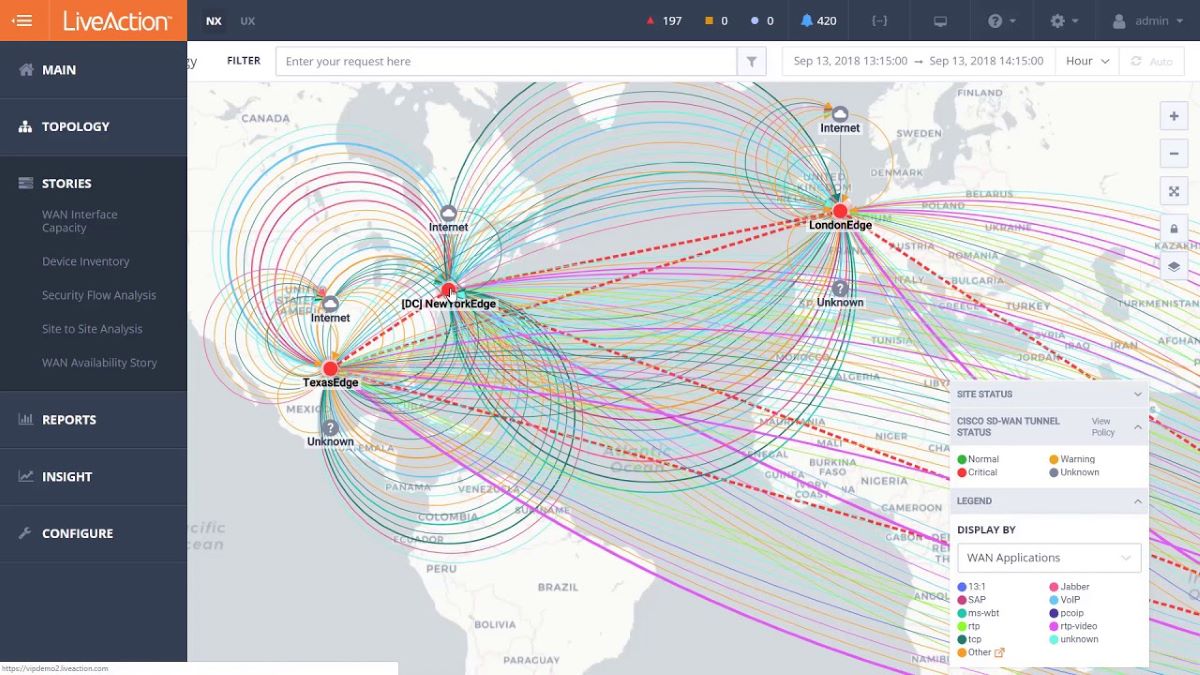
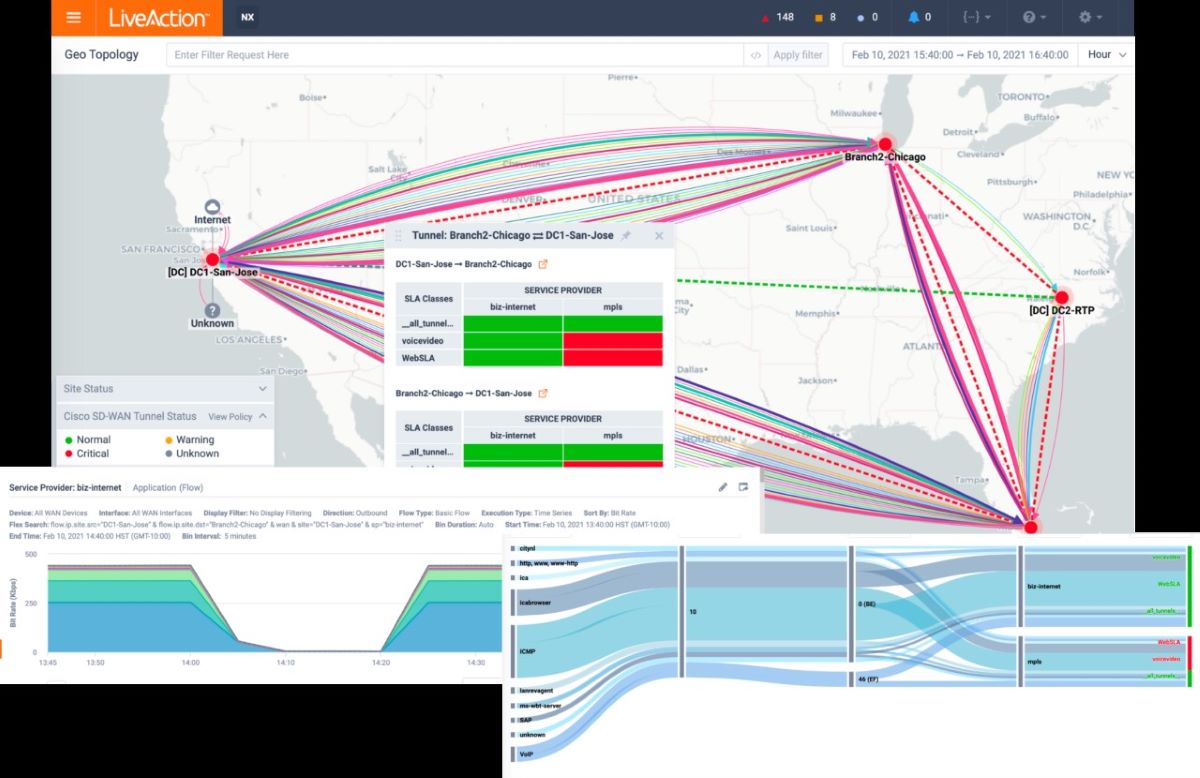
LiveAction is a network performance monitoring and diagnostics tool that provides real-time monitoring and analytics for network performance. LiveAction and Kentik are network performance monitoring solutions with distinct strengths. LiveAction is recognized for its real-time analytics, application performance monitoring, and network visibility. It excels in providing a comprehensive view of network traffic and offers robust tools for monitoring and optimizing the end-user experience.
LiveAction's features include flow monitoring, quality of service (QoS) monitoring, and customizable dashboards. While Kentik emphasizes flow-based analysis, LiveAction complements this with a strong focus on real-time analytics and application performance.
LiveAction App:
Are you in search of comprehensive network monitoring alternatives to Kentik? You're in luck! In this section, we've curated a selection of exceptional options that provide full network monitoring capabilities, serving as powerful alternatives to Kentik.
These alternatives go beyond basic network monitoring tools and offer comprehensive features to monitor and analyze your network infrastructure. Whether you're dealing with a small network or a large-scale enterprise environment, these tools provide deep visibility, real-time performance insights, and robust reporting functionalities.
From network traffic analysis and bandwidth utilization monitoring to device performance metrics and proactive alerting, these alternatives offer a wide range of capabilities to meet your network monitoring needs. We understand the critical role that comprehensive network monitoring plays in ensuring the smooth operation of your infrastructure, and that's why we've curated this list of alternatives to Kentik.
So, get ready to explore the realm of full network monitoring as we present you with a variety of alternatives that can elevate your monitoring capabilities. Say goodbye to limited visibility and embrace the power of these remarkable alternatives to gain a holistic view of your network performance. It's time to take control of your network and unleash its full potential with these outstanding Kentik alternatives.
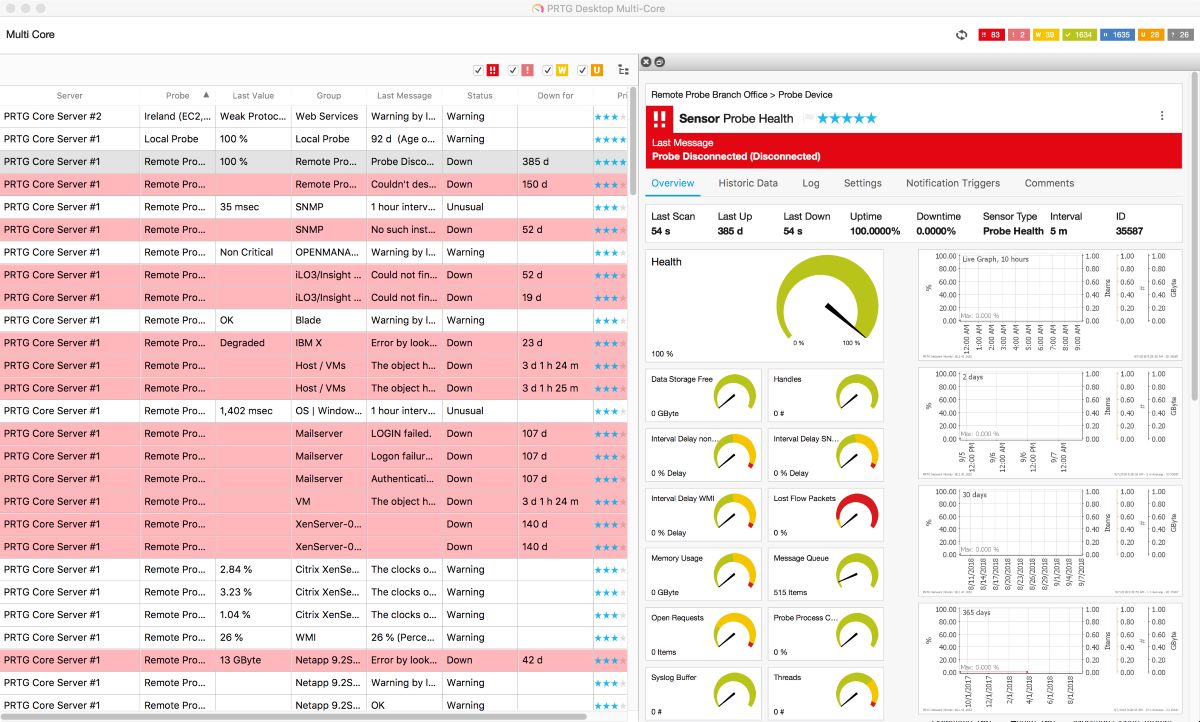
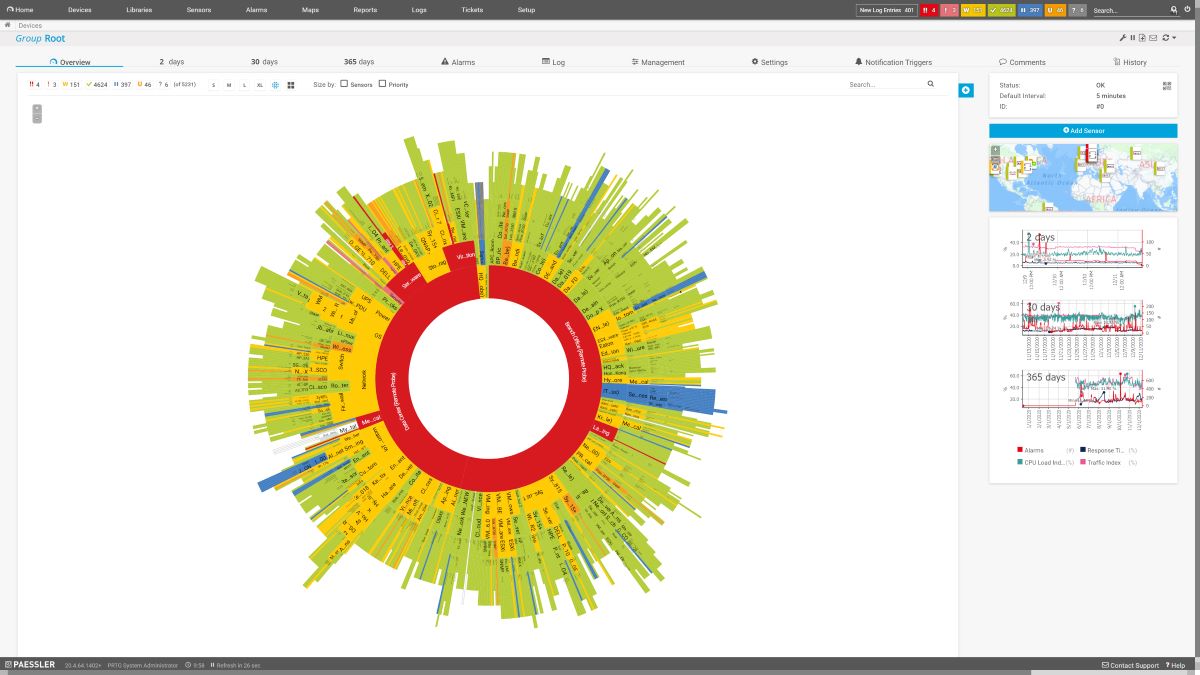
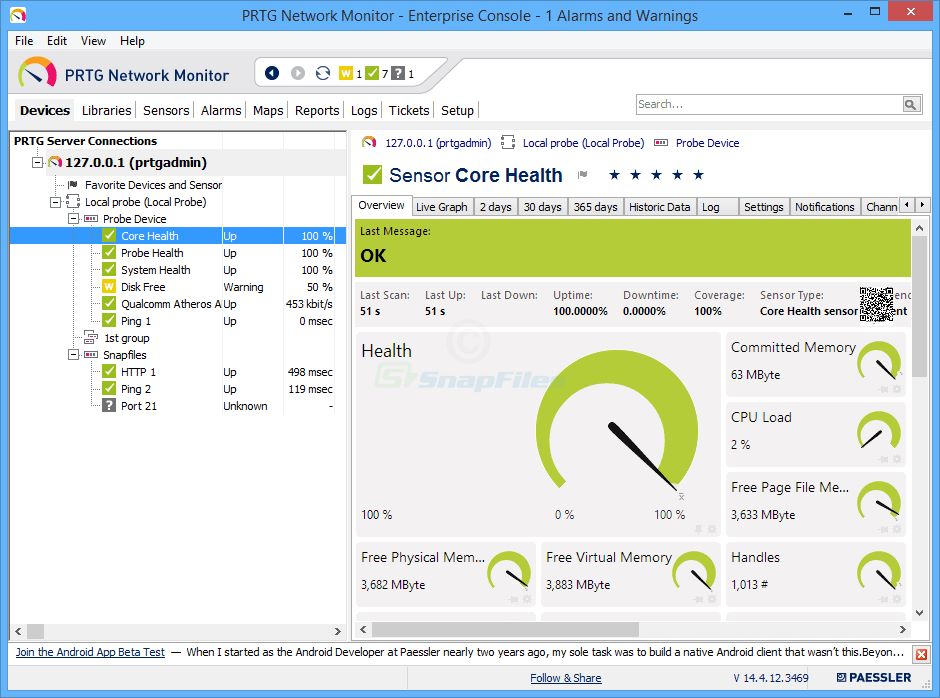
PRTG is recognized for its comprehensive network monitoring capabilities, offering real-time performance monitoring, customizable dashboards, and alerting. It excels in providing a user-friendly interface, ease of deployment, and a wide range of sensor types for diverse monitoring needs. While PRTG emphasizes device and sensor-based monitoring, Kentik focuses on flow-based analysis for in-depth network visibility.
The choice between PRTG and Kentik depends on specific organizational requirements, priorities, and preferences, with PRTG offering robust device-centric monitoring and user-friendly features.
PRTG App:
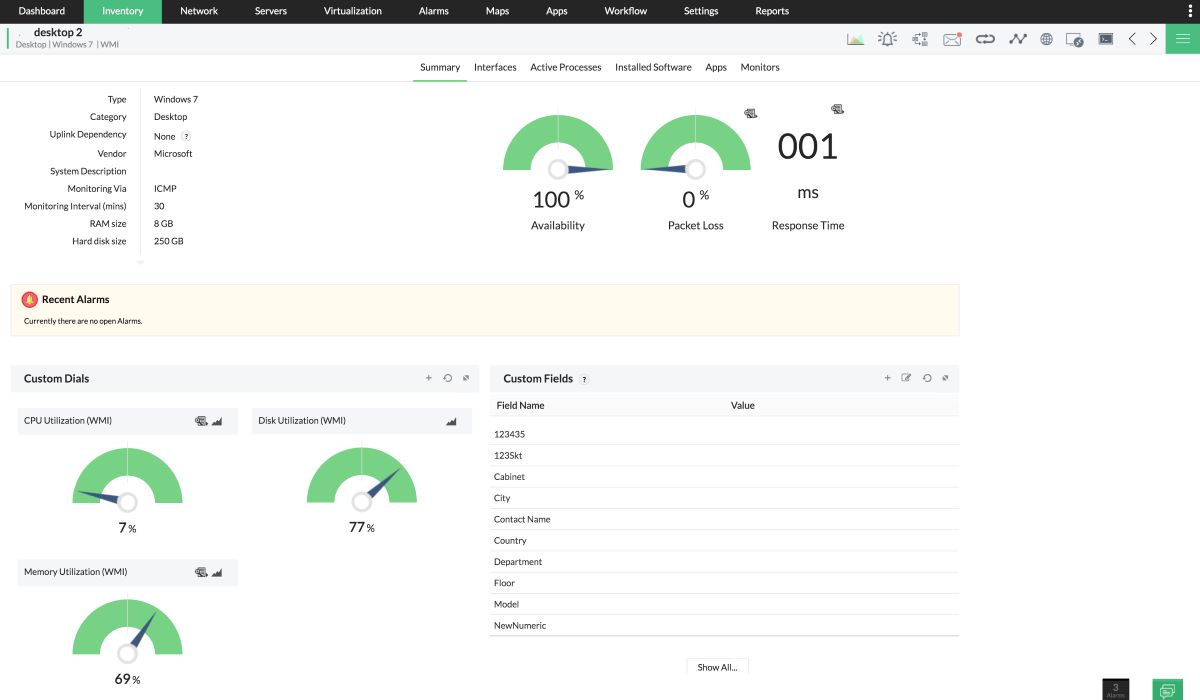
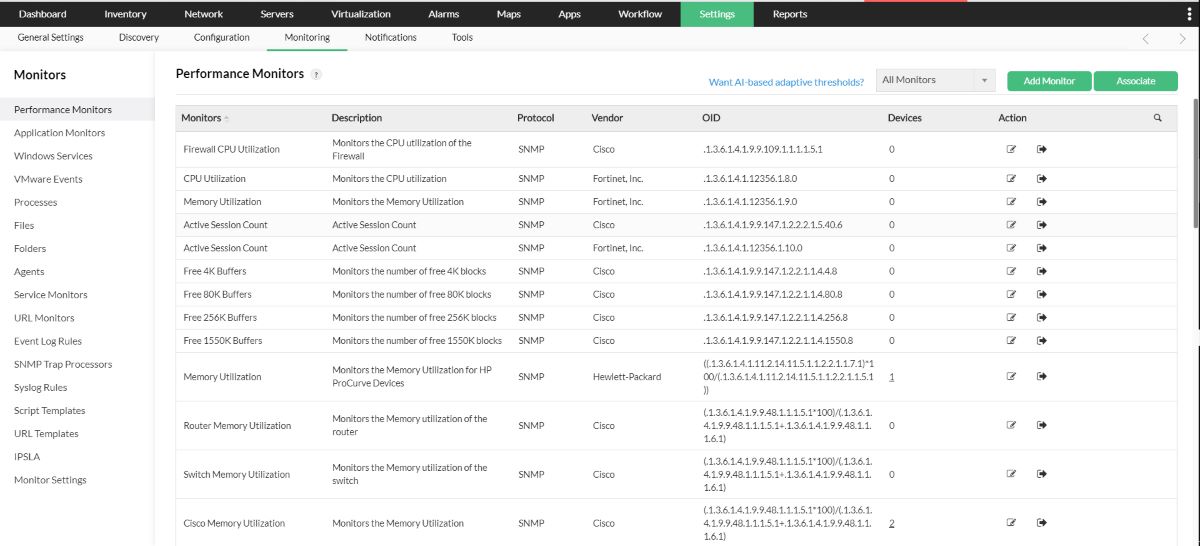
OpManager offers comprehensive network monitoring with a focus on real-time performance metrics, fault management, and device health checks. It excels in providing visibility into the overall health of network devices, facilitating quick issue identification and resolution. OpManager also offers customizable dashboards, robust alerting, and integration with other IT management systems.
While Kentik emphasizes flow-based analysis and network visibility, OpManager provides a more device-centric approach with a broad set of features for monitoring and managing network infrastructure. The choice between the two depends on specific organizational needs, priorities, and preferences.
Manage Engine OPManager App:

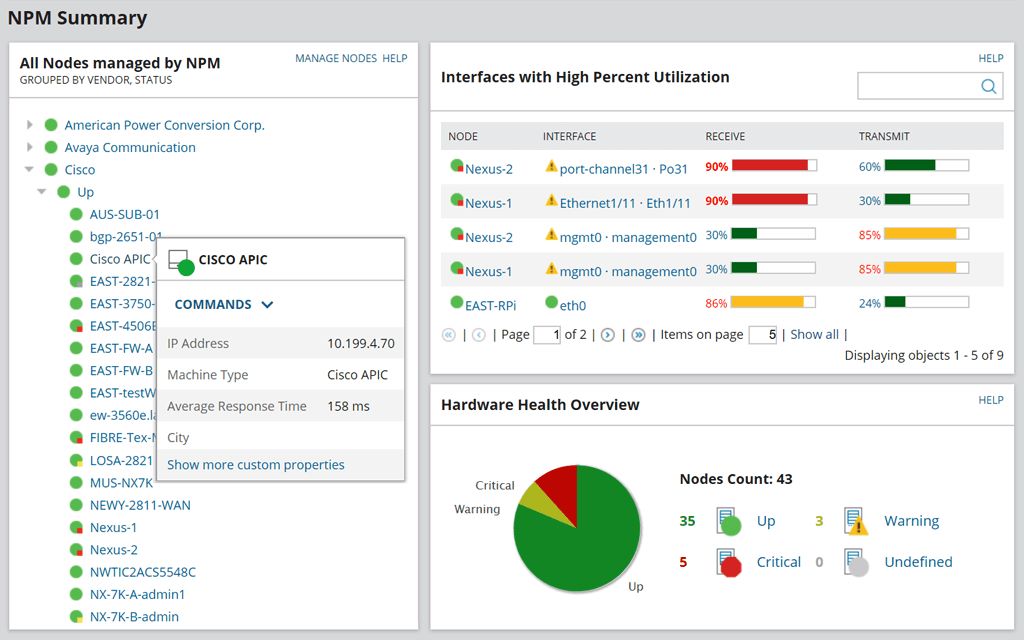
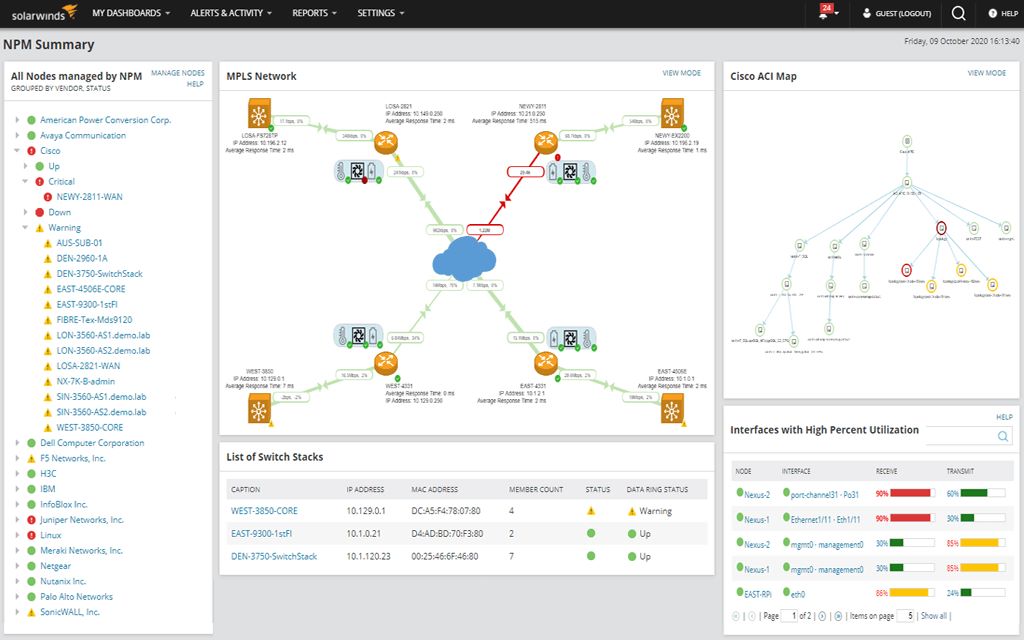
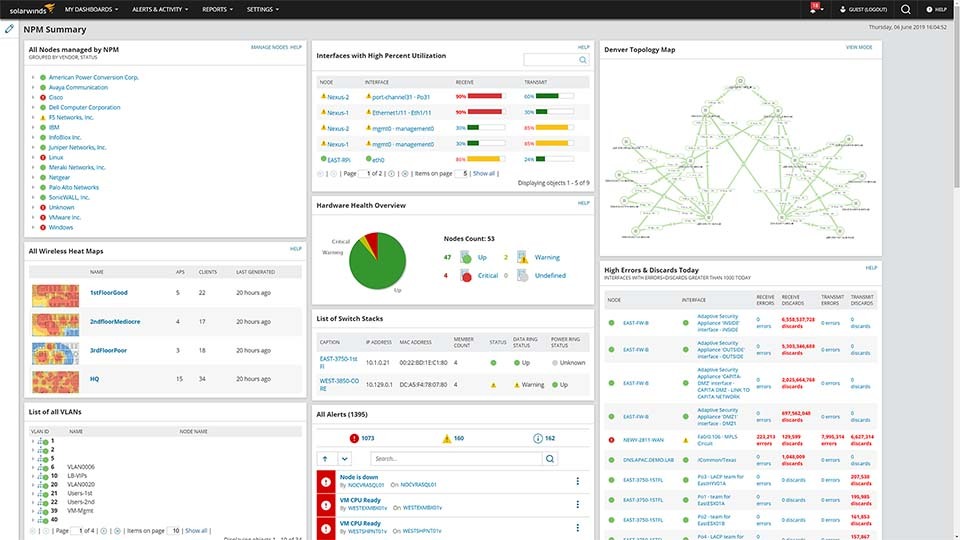
SolarWinds and Kentik serve as alternatives for network monitoring, each with distinctive features. SolarWinds is renowned for its comprehensive network management suite, offering robust tools for network performance monitoring, configuration management, and security. It excels in providing detailed insights into device health, bandwidth utilization, and network traffic. SolarWinds also stands out with its extensive set of features, including SNMP support, alerting, and customizable dashboards. The platform's user-friendly interface, scalability, and diverse capabilities make it a powerful alternative to Kentik.
SolarWinds App:
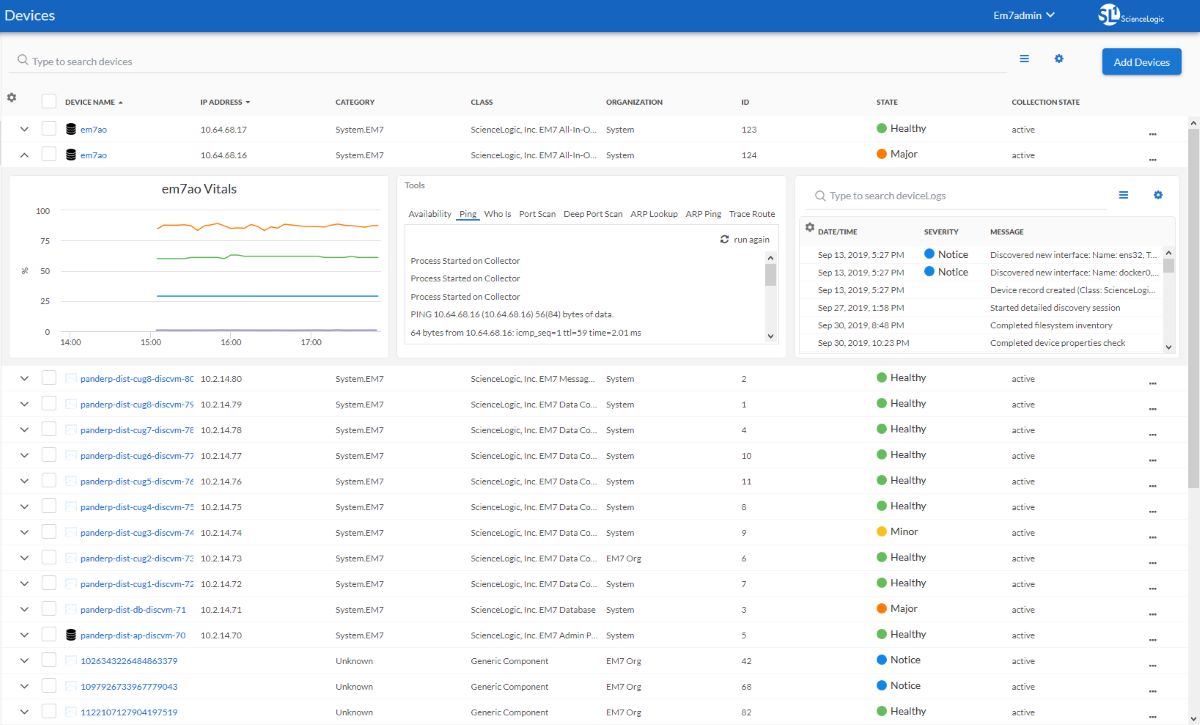
ScienceLogic is recognized for its extensive capabilities in hybrid IT infrastructure monitoring, cloud management, and AIOps functionalities. It excels in providing end-to-end visibility into complex IT environments, offering features such as performance monitoring, event correlation, and automation. While Kentik specializes in flow-based analysis and network visibility, ScienceLogic complements this with a broader focus on hybrid and multi-cloud environments, making it a comprehensive solution for organizations with diverse IT infrastructures.
The choice between ScienceLogic and Kentik depends on specific organizational needs, with ScienceLogic catering to those seeking a holistic IT infrastructure monitoring platform.
ScienceLogic App:

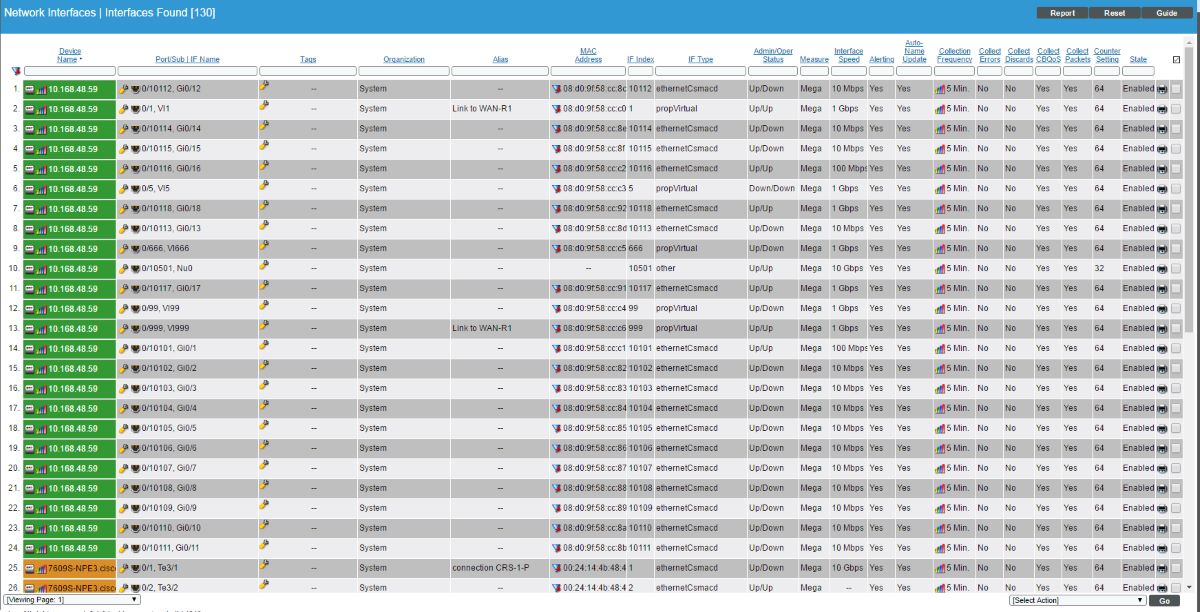
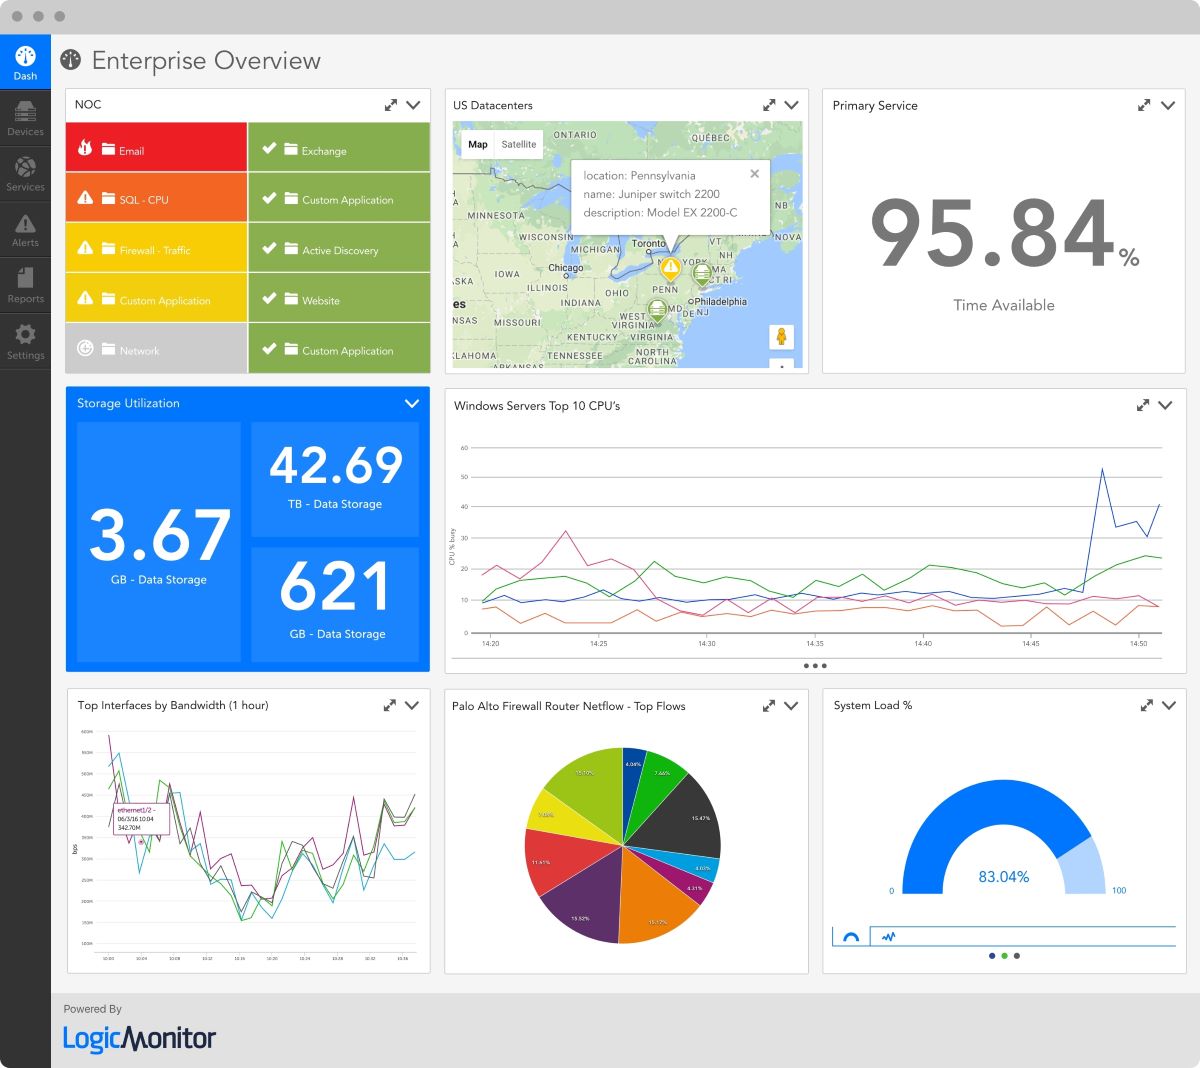
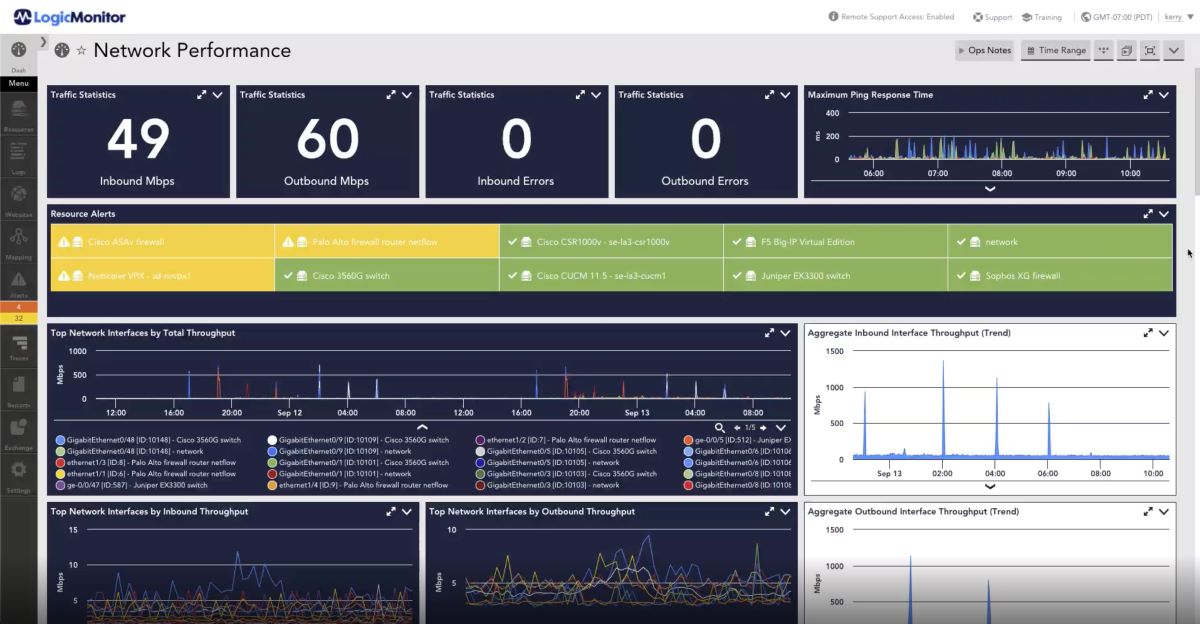
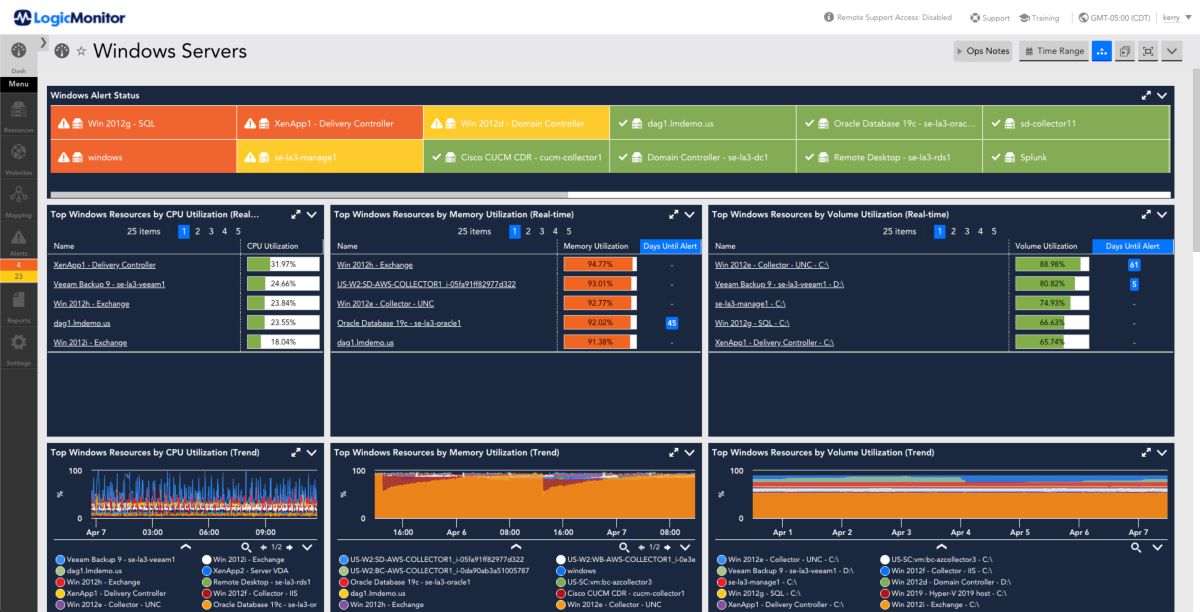
LogicMonitor excels in automated infrastructure monitoring, offering a comprehensive platform for end-to-end visibility into IT infrastructure, including networks, servers, and applications. Known for its ease of deployment, LogicMonitor provides automatic discovery, intelligent alerting, and customizable dashboards. Its focus on automated monitoring, scalability, and a broad range of supported technologies positions it as a robust alternative to Kentik.
While Kentik emphasizes flow-based analysis and network visibility, LogicMonitor complements this with automated infrastructure monitoring for organizations seeking a comprehensive solution tailored for ease of use and scalability.
LogicMonitor App:
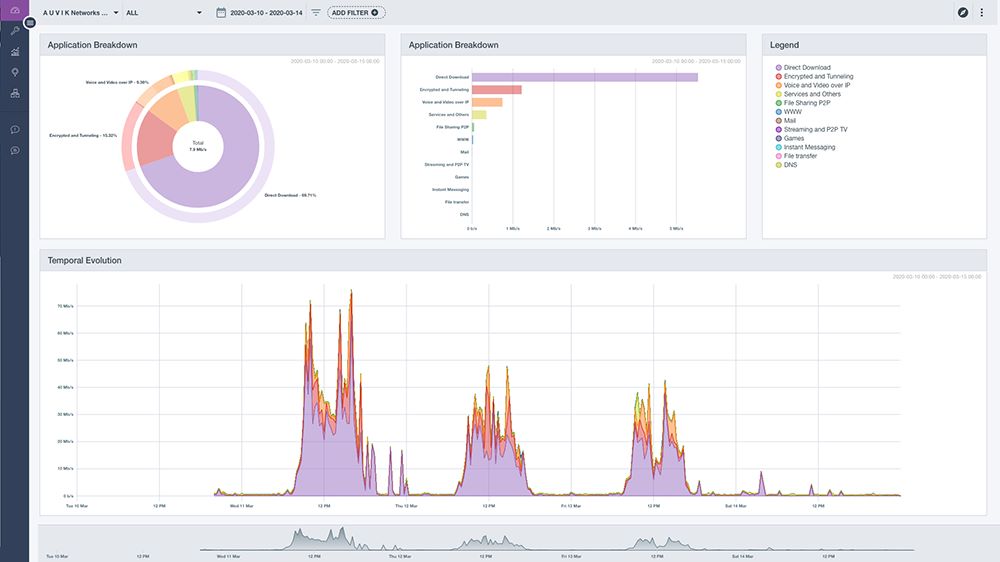
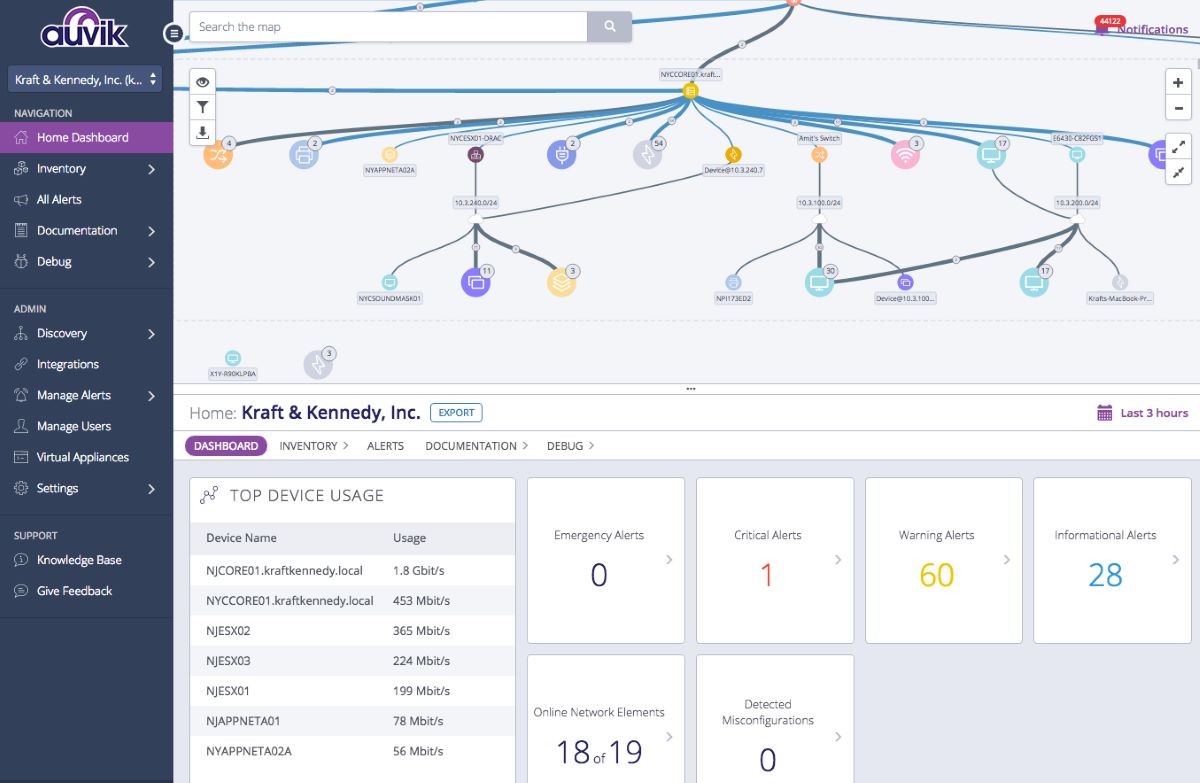
Auvik is a network management software that offers network mapping, network performance monitoring, and automation capabilities. Auvik is particularly strong in network infrastructure management, providing detailed insights into device performance, configuration management, and network topology. It excels in automating network discovery, mapping, and inventory. Auvik's focus on network device management, SNMP monitoring, and automated workflows positions it as a robust solution for organizations emphasizing network infrastructure visibility and management.
While Kentik prioritizes flow-based analysis and comprehensive network visibility, Auvik complements this with a specialized focus on network device monitoring and management.
Auvik App:
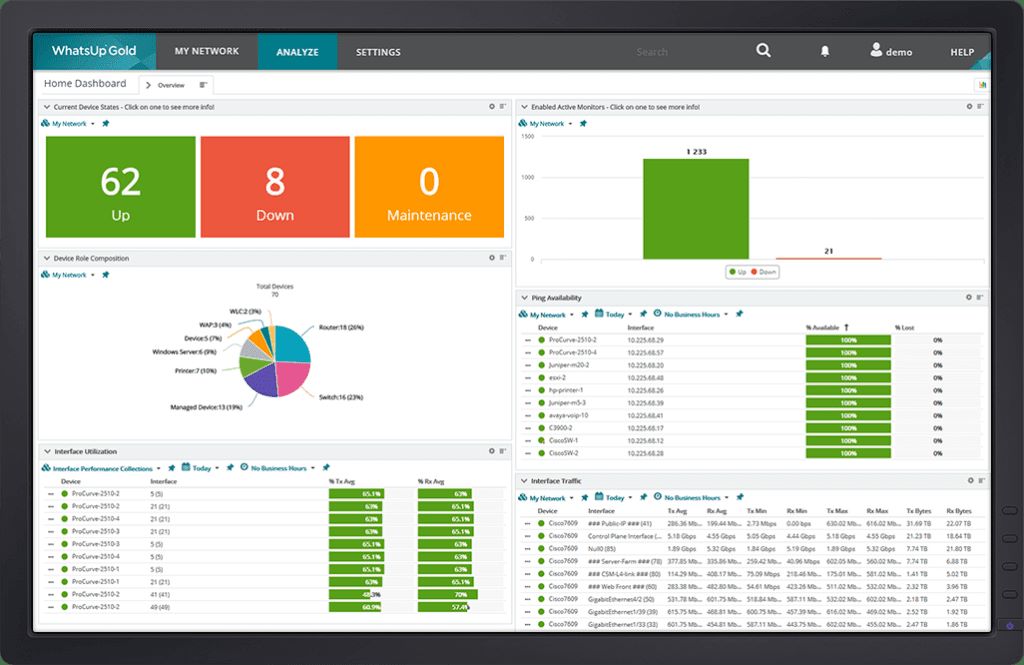
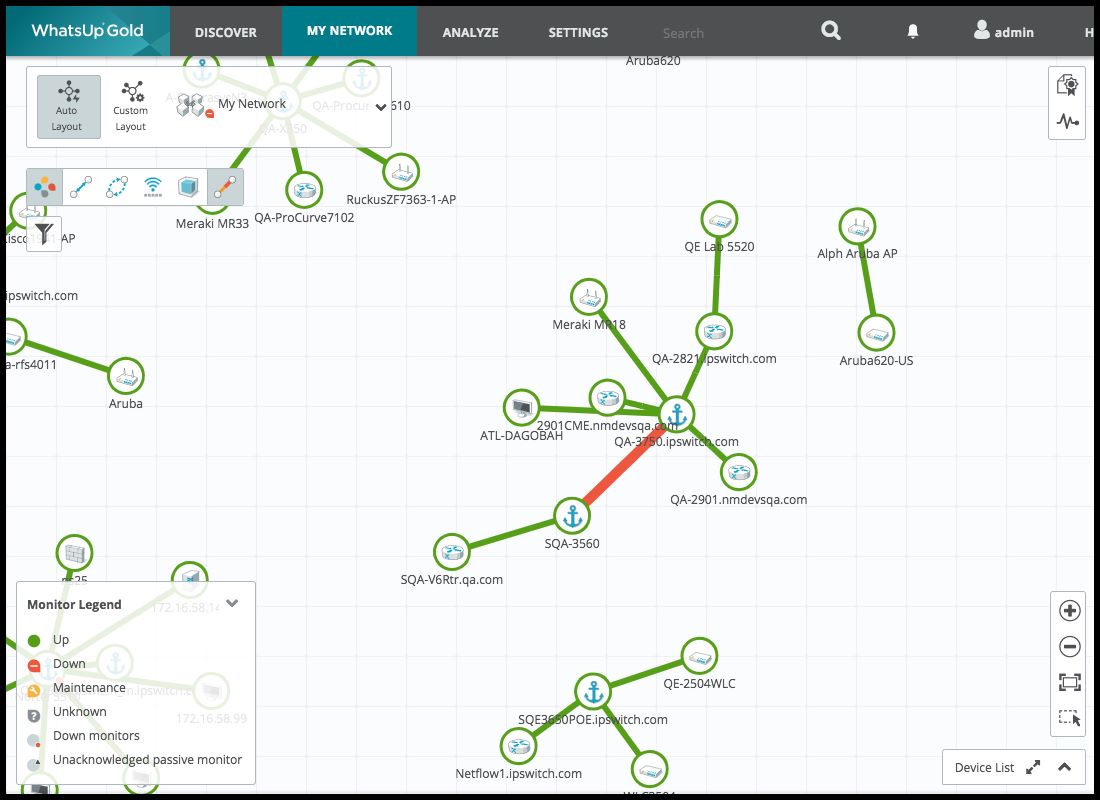
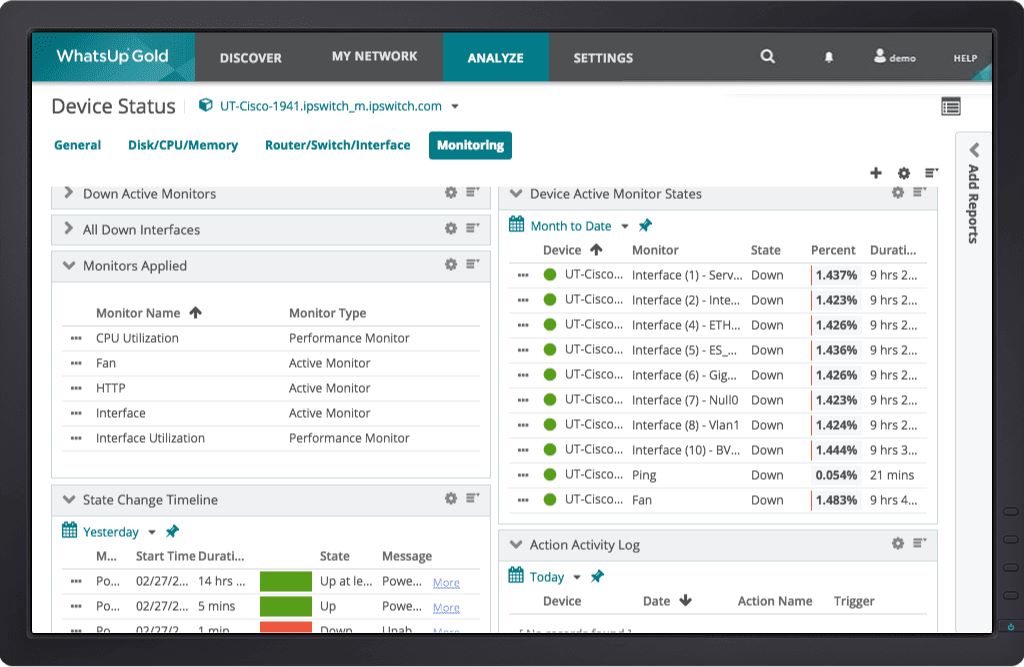
Progress WhatsUp Gold and Kentik are both network monitoring solutions, but they cater to different aspects of network management. Progress WhatsUp Gold is recognized for its versatility in network device monitoring, real-time performance monitoring, and configuration management. It offers features such as network discovery, customizable dashboards, and alerting mechanisms. WhatsUp Gold is known for its user-friendly interface and comprehensive network visibility.
While Kentik excels in flow-based analysis and network visibility, WhatsUp Gold's strength lies in its robust features for monitoring network devices and overall network performance. The choice between the two depends on specific organizational needs, with WhatsUp Gold being a solid alternative for those prioritizing device-centric monitoring and real-time performance insights.
Progress WhatsUpGold App:
This section provides a comprehensive list of 17 indirect alternatives to Kentik for network performance monitoring. These alternatives were selected based on their distinct characteristics, as they either fall within a larger IT solution or are open source options.
While Kentik is a dedicated network performance monitoring tool, some organizations may prefer an integrated approach, where network performance monitoring is part of a larger IT solution. The software listed in this section were chosen based on their ability to provide network performance monitoring capabilities within a larger IT solution, such as network management platforms, APM tools, or network security solutions.
Additionally, some organizations may prefer open-source solutions due to various reasons, including cost-effectiveness or flexibility in customization. The open-source software listed in this section were chosen based on their ability to offer similar or matching features to Kentik, such as network visibility, monitoring of cloud-based applications, real-time network performance analysis, and network troubleshooting capabilities, among others.
Although these software solutions may not be direct alternatives to Kentik, they provide viable options for organizations seeking an integrated approach to network performance monitoring or those who prefer open source solutions.
Icinga is an open-source network monitoring tool that offers a comprehensive set of features, including network performance monitoring, server monitoring, and application monitoring. It stands out with its emphasis on distributed monitoring, scalability, and customizable configurations, providing a flexible solution for organizations with diverse network environments. Icinga excels in real-time insights, proactive issue resolution, and scalability, making it suitable for complex networks.
While Kentik focuses on flow-based analysis and network visibility, Icinga complements this with its strengths in distributed and customizable monitoring.
Icinga App:


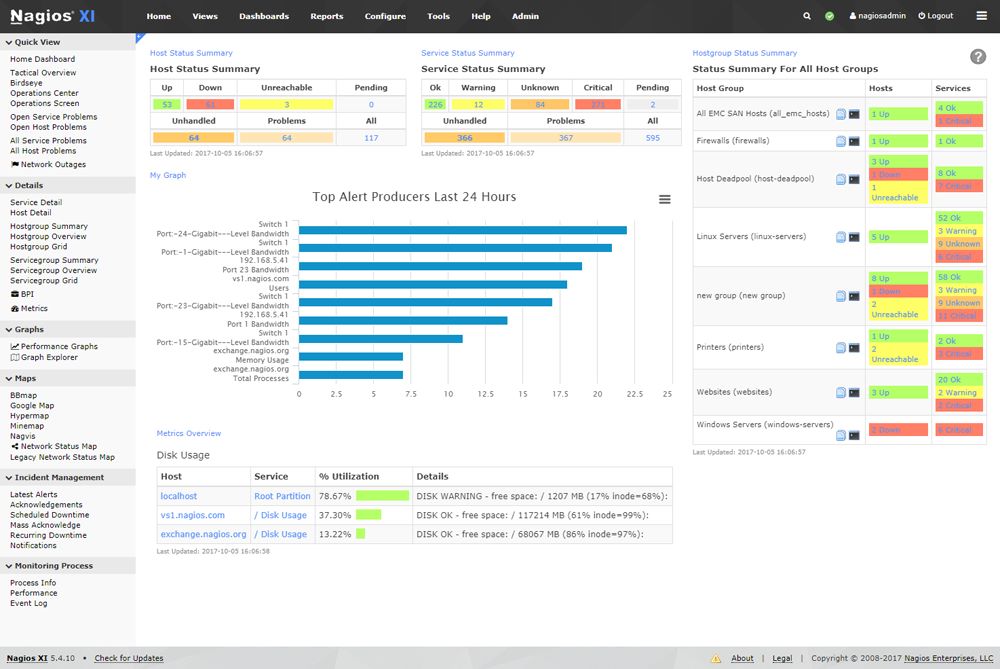
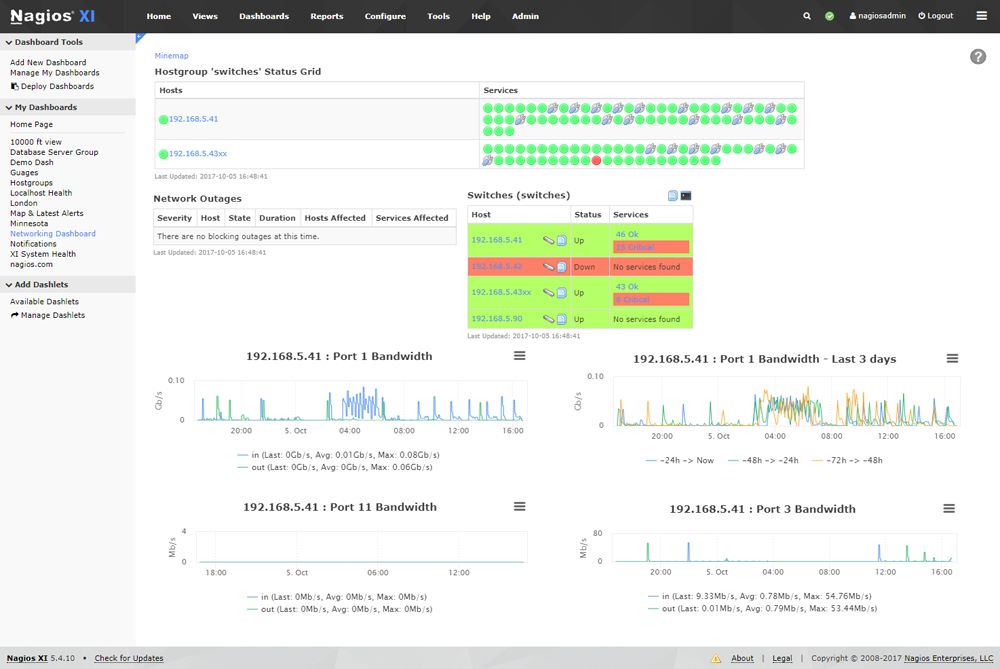
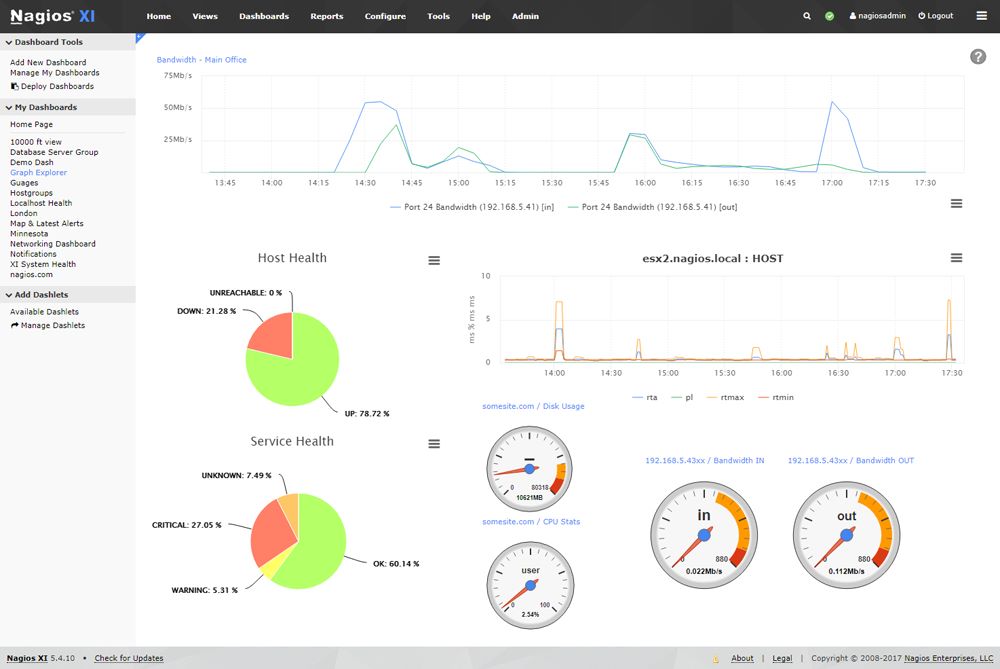
Nagios XI is a network monitoring tool that offers a comprehensive set of features, including network performance monitoring, server monitoring, and application monitoring. Nagios XI is renowned for its flexibility and extensive plugin ecosystem, providing users the ability to customize monitoring configurations according to their specific needs. Its core strength lies in infrastructure monitoring, alerting, and event handling.
While Kentik focuses on flow-based analysis and comprehensive network visibility, Nagios XI stands out for its adaptability and wide-ranging monitoring capabilities, making it a versatile choice for organizations seeking a highly customizable and extensible monitoring solution.
Nagios XI App:
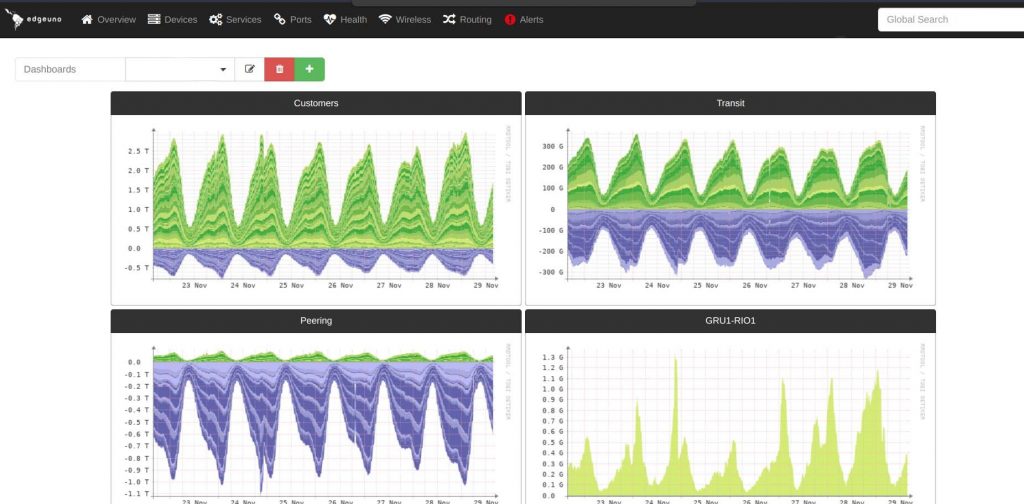
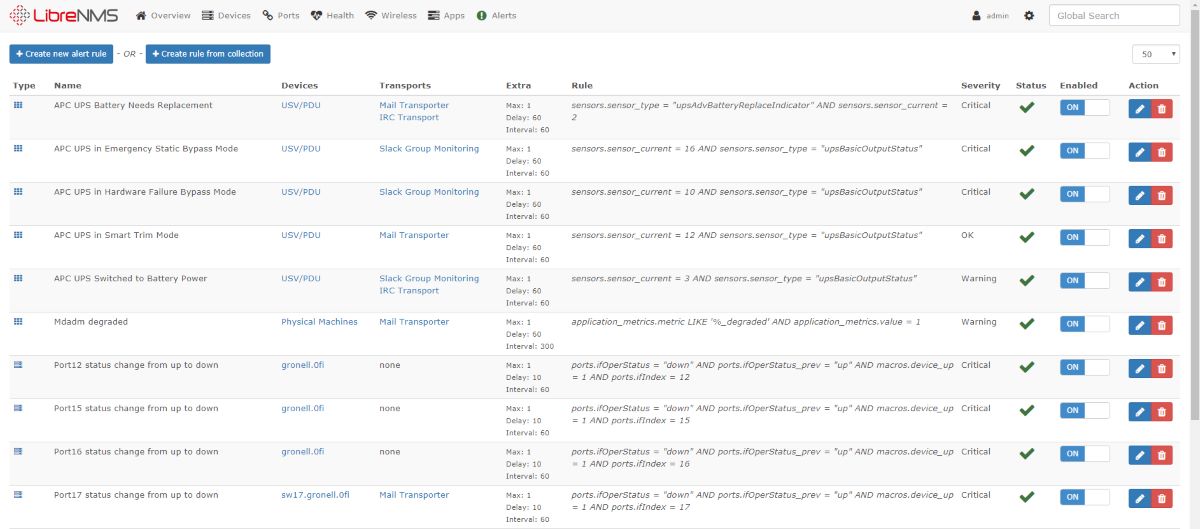
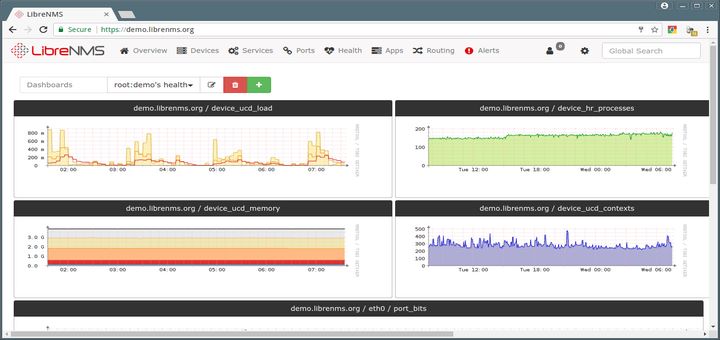
LibreNMS is an open-source platform known for its comprehensive network monitoring capabilities, including SNMP-based monitoring, device discovery, and alerting. It provides robust features for managing and monitoring network devices such as routers and network switches. While LibreNMS excels in traditional network monitoring, Kentik focuses on flow-based analysis and global network visibility, making it suitable for organizations with complex, dynamic infrastructures and a need for detailed traffic insights.
The choice between LibreNMS and Kentik depends on specific organizational requirements, with LibreNMS offering a solid, open-source alternative for more traditional network monitoring needs.
LibreNMS App:
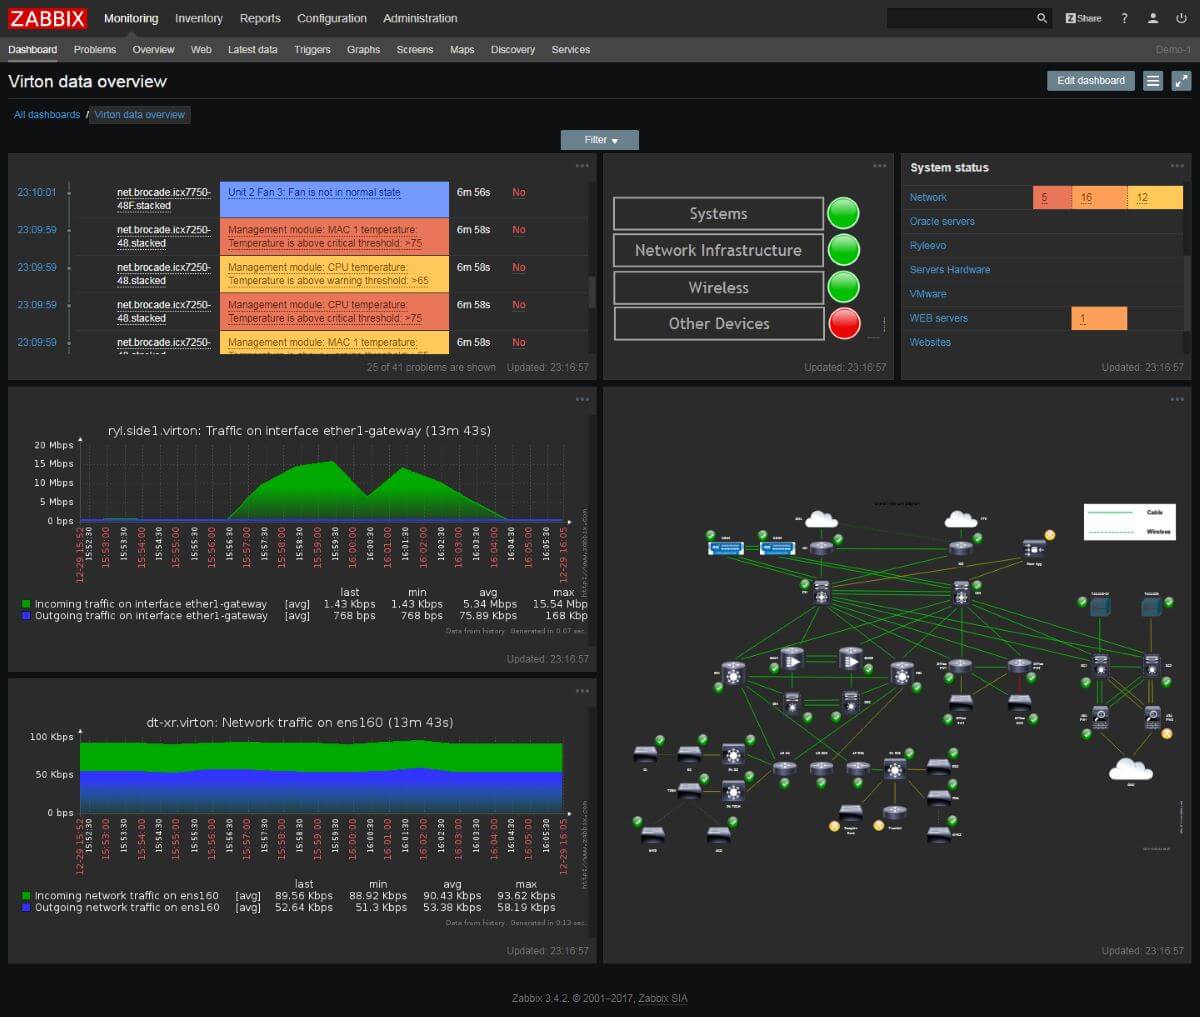
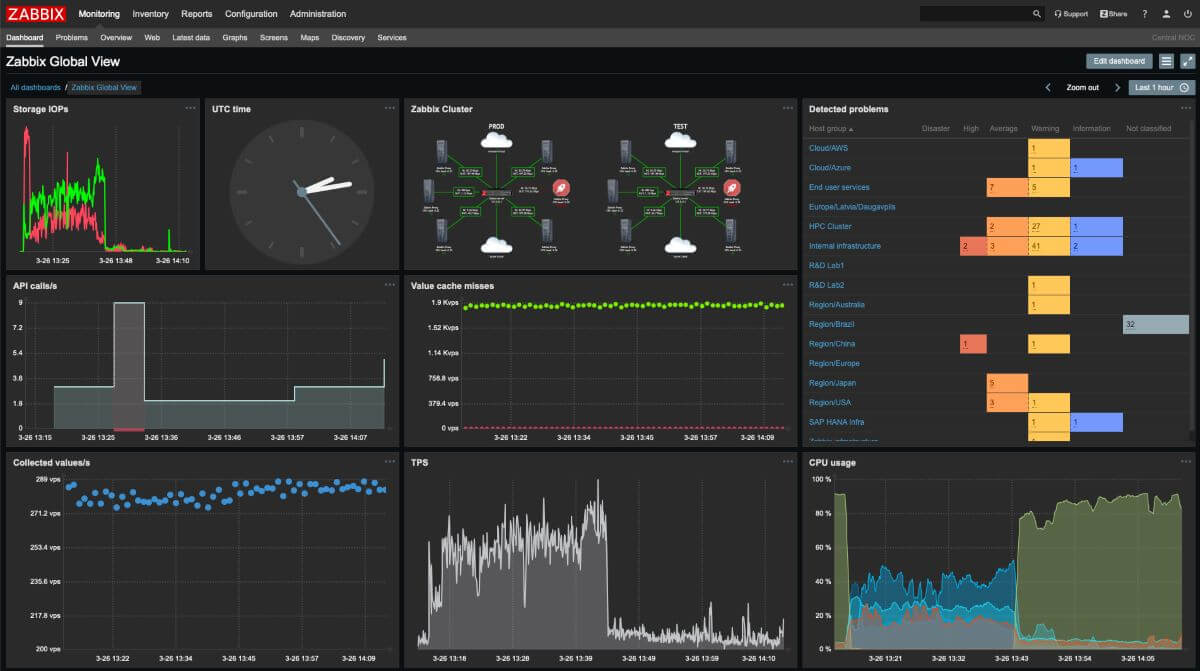
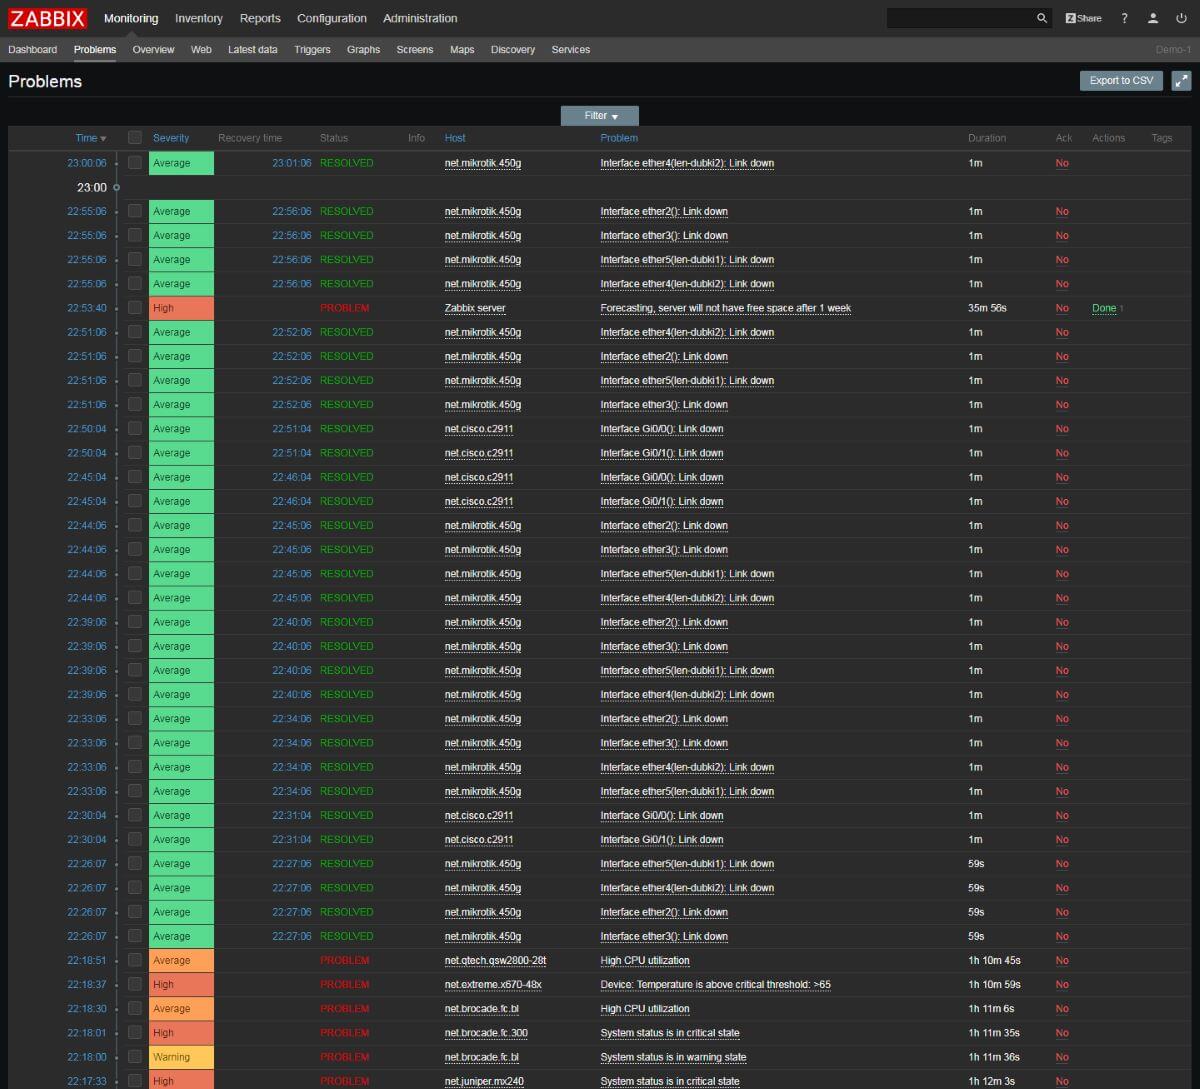
Zabbix is an open-source network monitoring tool that offers a comprehensive set of features, including network performance monitoring, server monitoring, and application monitoring. It excels in scalability, flexibility, and customizability, allowing users to tailor monitoring setups based on specific needs. Zabbix offers features like real-time monitoring, alerting, and a wide range of supported data sources.
While Kentik focuses on flow-based analysis and network visibility, Zabbix provides a highly customizable and scalable solution for organizations seeking an open-source monitoring platform.
Zabbix App:
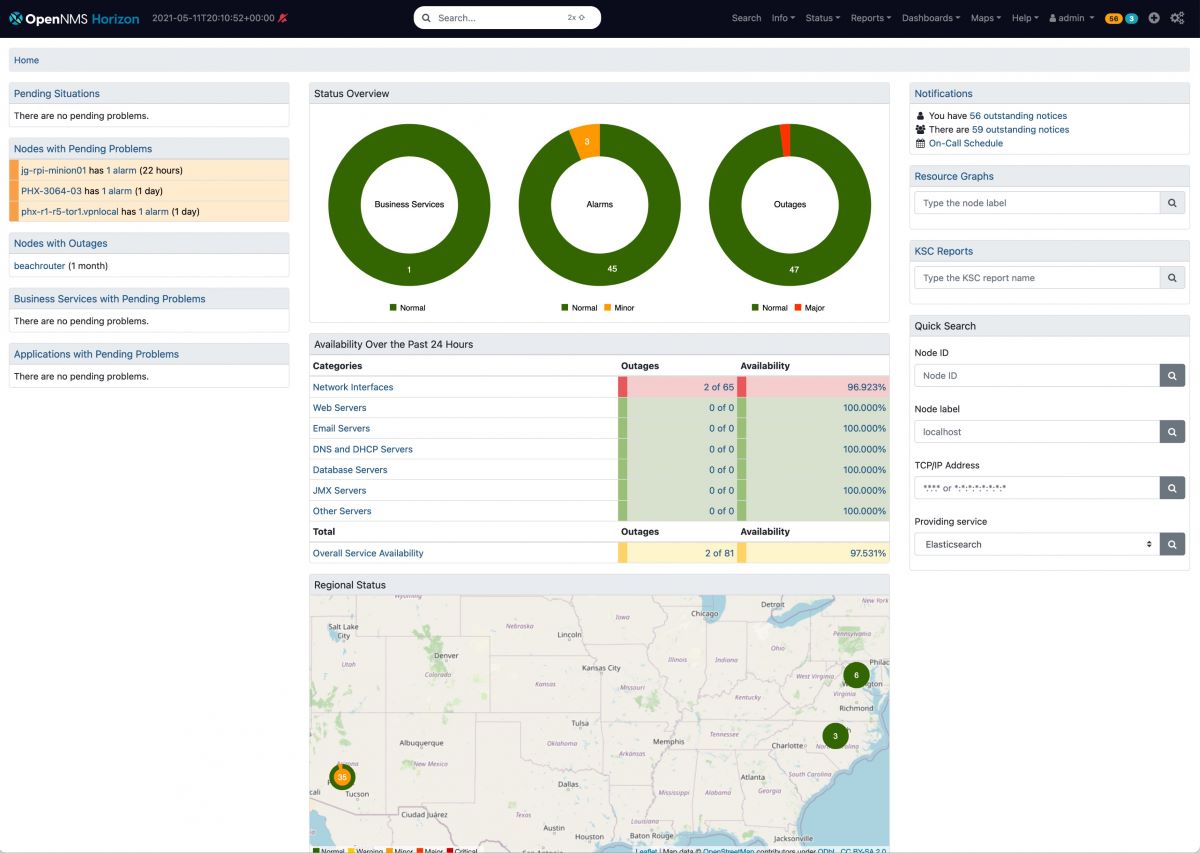
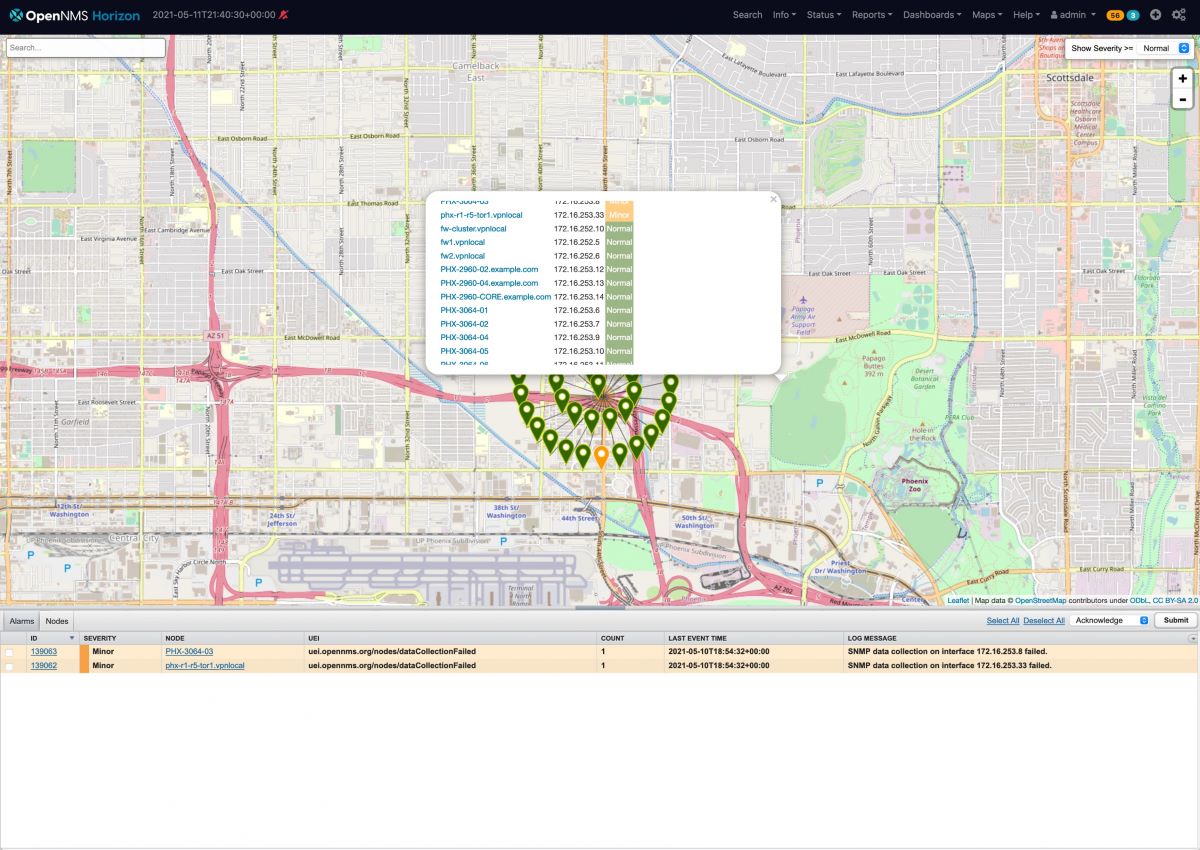
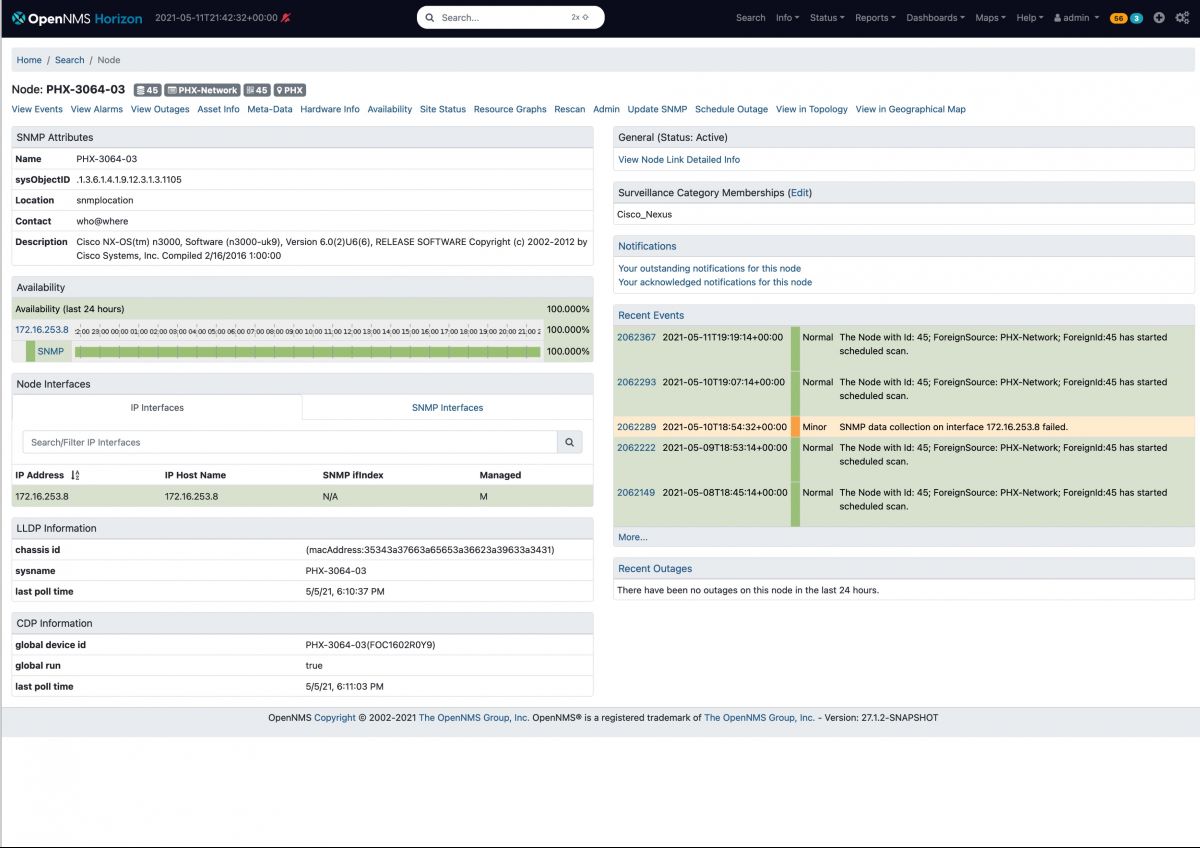
OpenNMS is an open-source platform that focuses on comprehensive network monitoring, event and fault management, and scalability. It offers robust capabilities for network performance analysis and can be tailored to diverse network environments. In contrast, Kentik specializes in flow-based analysis, providing real-time insights into network traffic and visibility. While OpenNMS is known for its flexibility and extensive feature set, Kentik stands out for its flow analytics and global network visibility.
OpenNMS App:
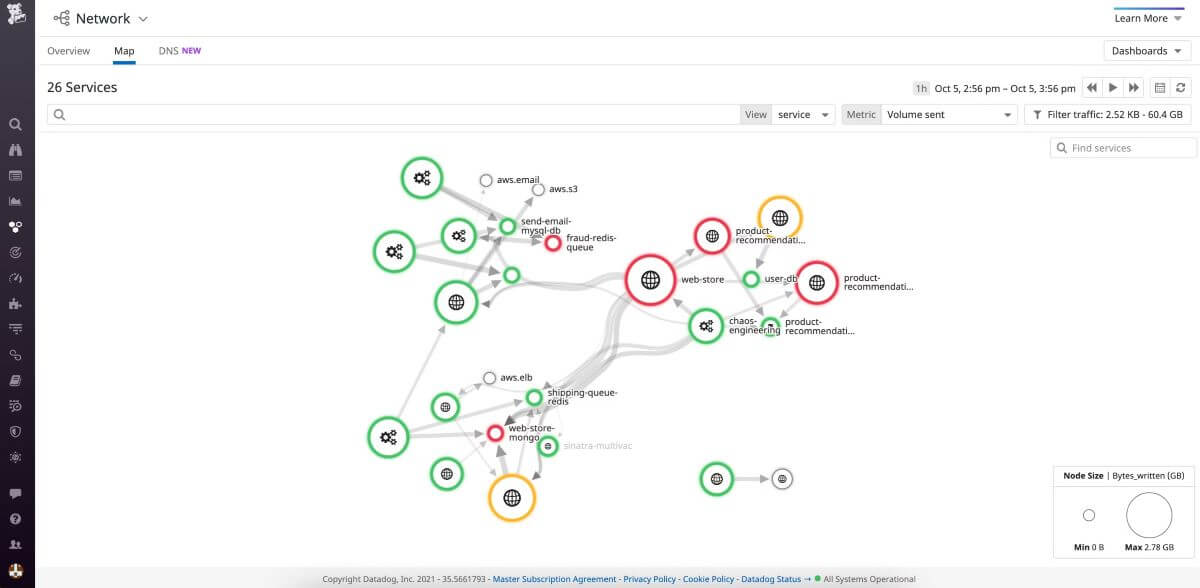
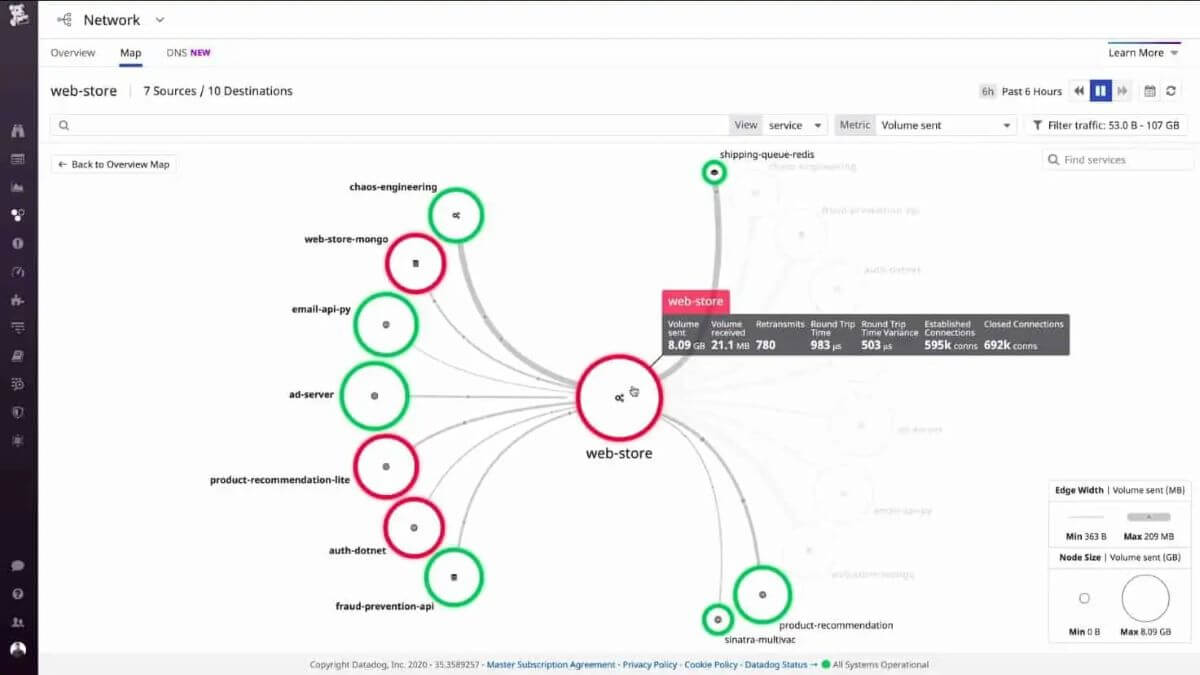
Datadog is known for its comprehensive cloud monitoring and observability platform, covering a wide range of applications, infrastructure, and logs. It excels in providing end-to-end visibility across cloud environments, offering features like application performance monitoring, log analytics, and infrastructure monitoring. Datadog's strength lies in its broad scope, ease of integration, and a unified platform for various monitoring needs.
While Kentik focuses on network visibility and flow-based analysis, Datadog complements this with a broader observability approach, making it a versatile alternative depending on an organization's emphasis and monitoring requirements.
Datadog App:

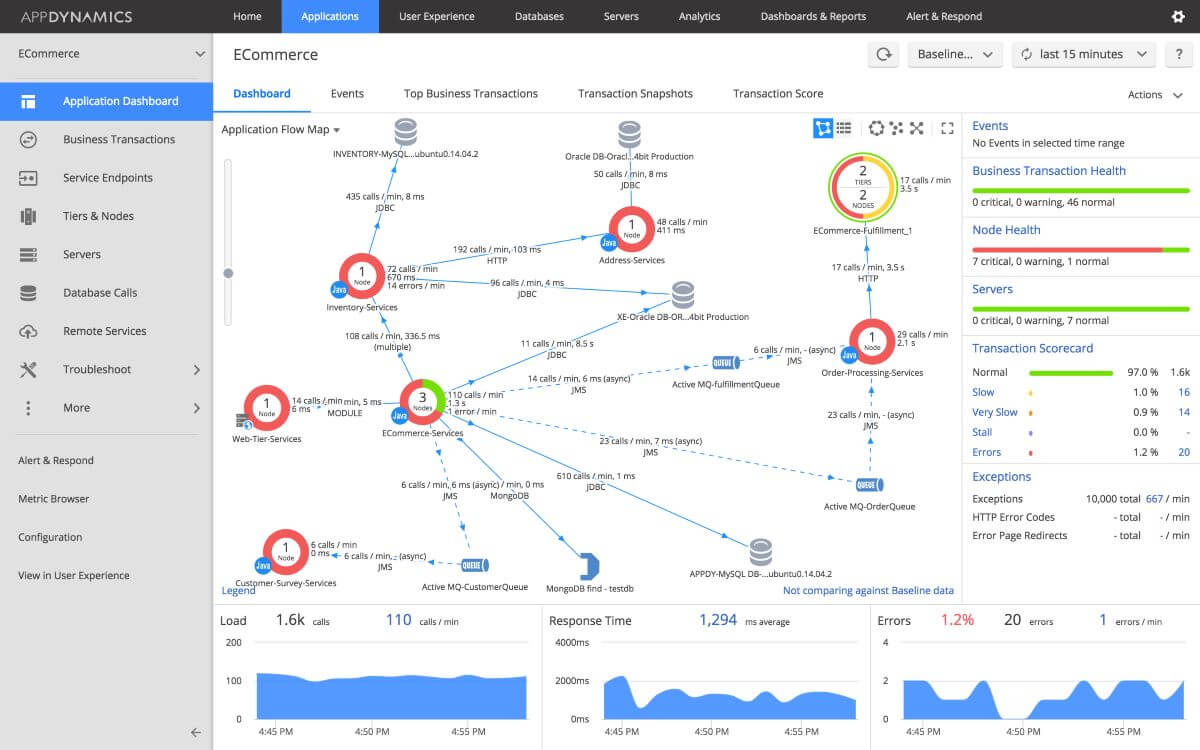
AppDynamics is an application performance monitoring tool that offers real-time insights into application performance, user experience, and business impact. It emphasizes real-time analytics, user experience monitoring, and the ability to trace performance issues down to the code level. AppDynamics is renowned for its APM capabilities, which include detailed application and transaction monitoring, making it a strong choice for organizations prioritizing application-centric visibility.
Kentik, on the other hand, stands out for its comprehensive network visibility, flow-based analysis, and global network insights. The choice between AppDynamics and Kentik depends on specific organizational needs, with AppDynamics catering particularly well to those placing a strong emphasis on APM and application-centric monitoring.
AppDynamics App:
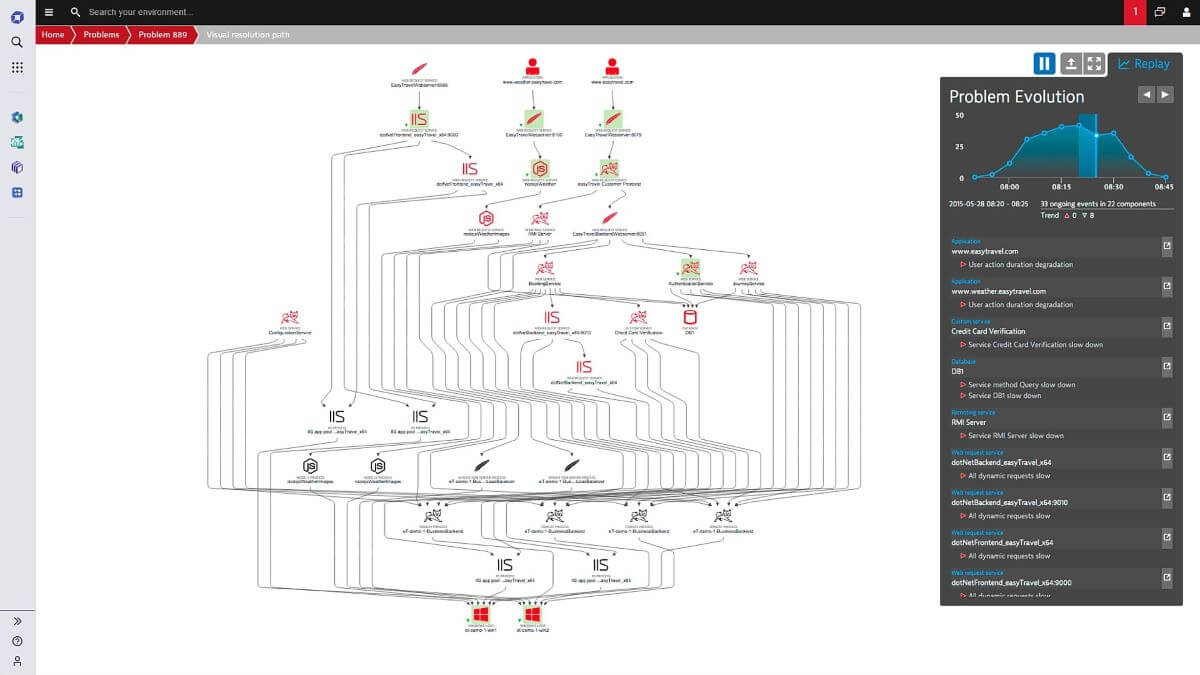
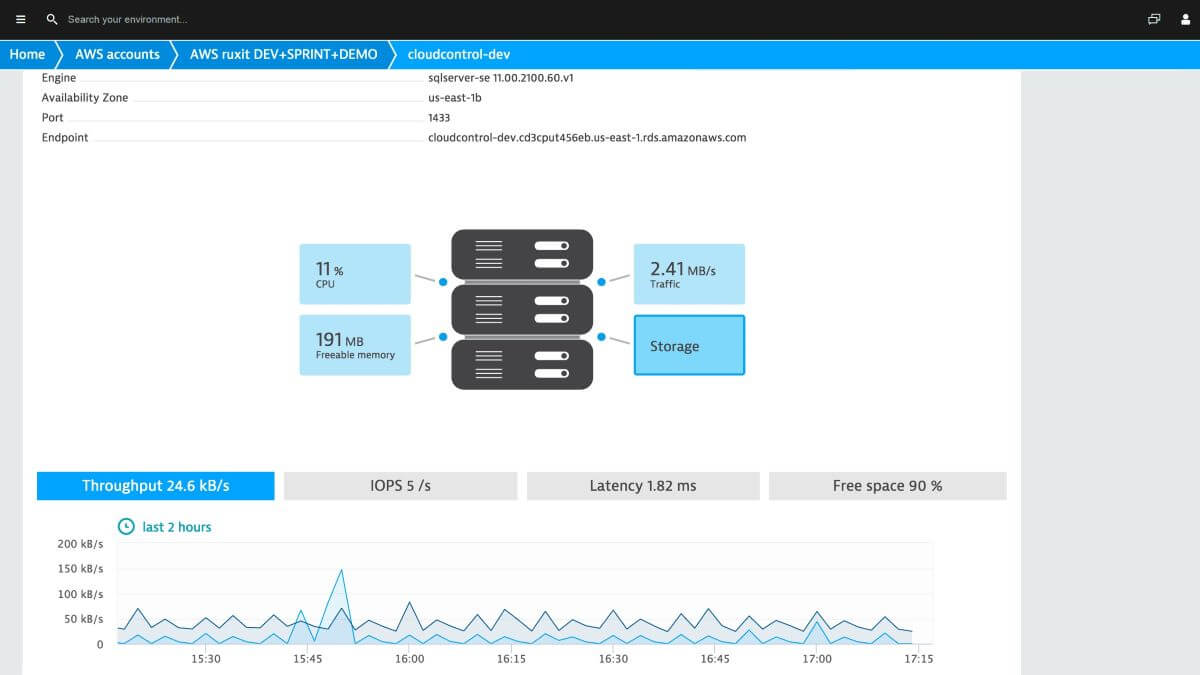
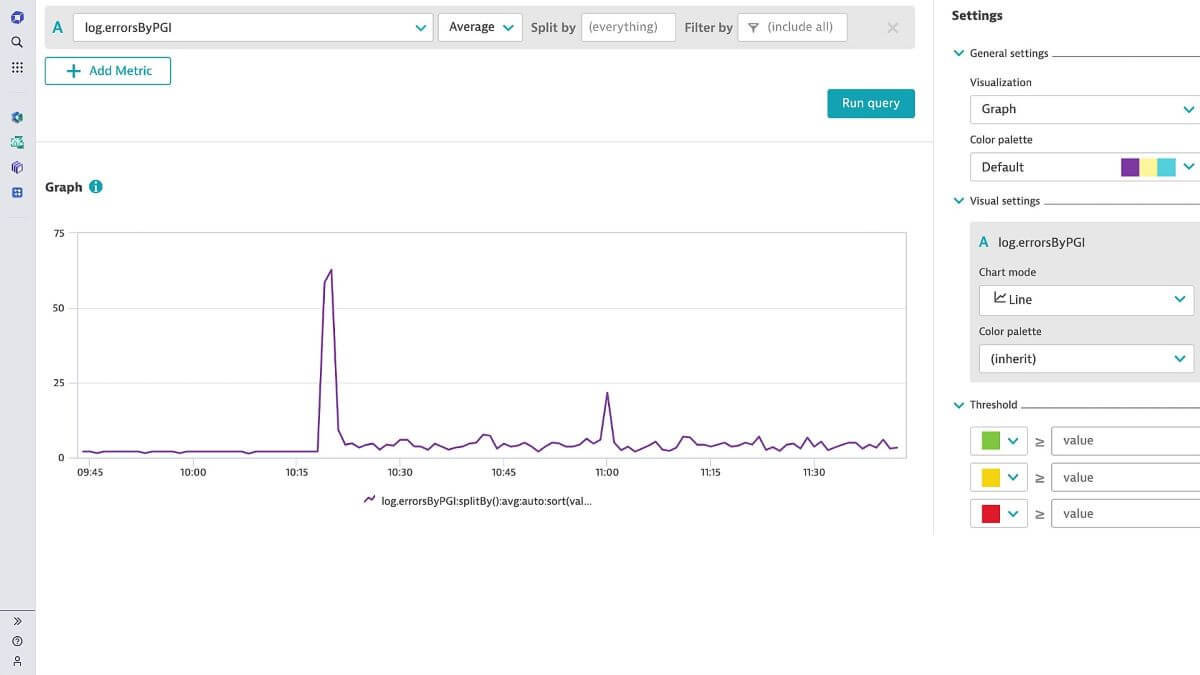
Dynatrace excels in end-to-end application performance monitoring, providing insights into user experience, application responsiveness, and transaction-level details. It utilizes AI-driven observability to automate root cause analysis and optimize application performance. Dynatrace also focuses on full-stack monitoring, covering applications, infrastructure, and user interactions. Its strength lies in advanced analytics and AI-driven insights.
While Kentik emphasizes flow-based analysis for network visibility, Dynatrace's forte is comprehensive application and infrastructure monitoring with a particular emphasis on enhancing the user experience.
Dynatrace App:
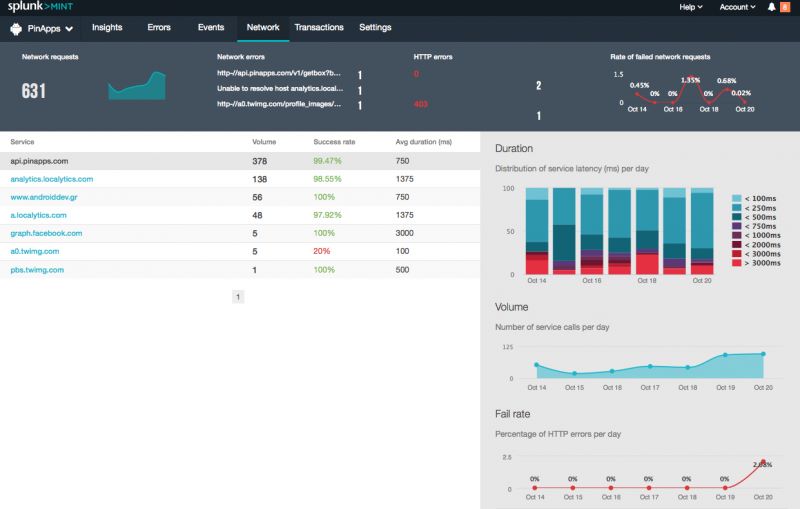
Splunk is a cloud-based platform that offers end-to-end visibility into network performance, security, and usage. Splunk is known for its robust log and data analytics platform, offering organizations the ability to collect, index, and analyze machine-generated data, including network logs. It excels in providing extensive visibility into various data sources, enabling in-depth analysis for security, IT operations, and compliance. Splunk's strength lies in its versatility, scalability, and the ability to handle diverse data types.
While Kentik specializes in flow-based analysis for comprehensive network visibility, Splunk's focus is on broader data analytics across various domains.
Splunk App:
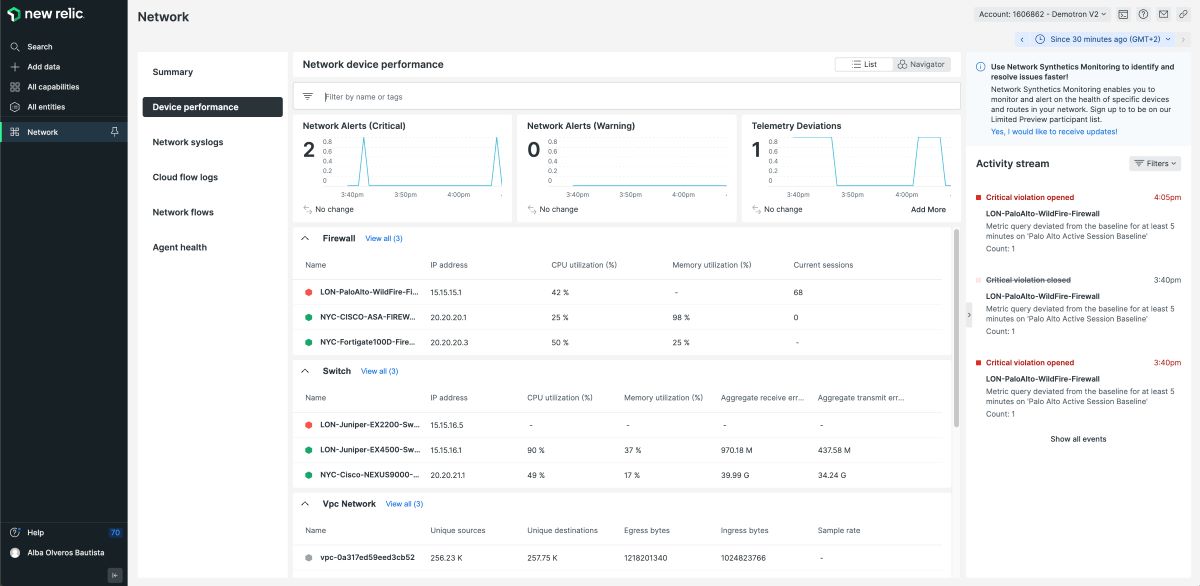
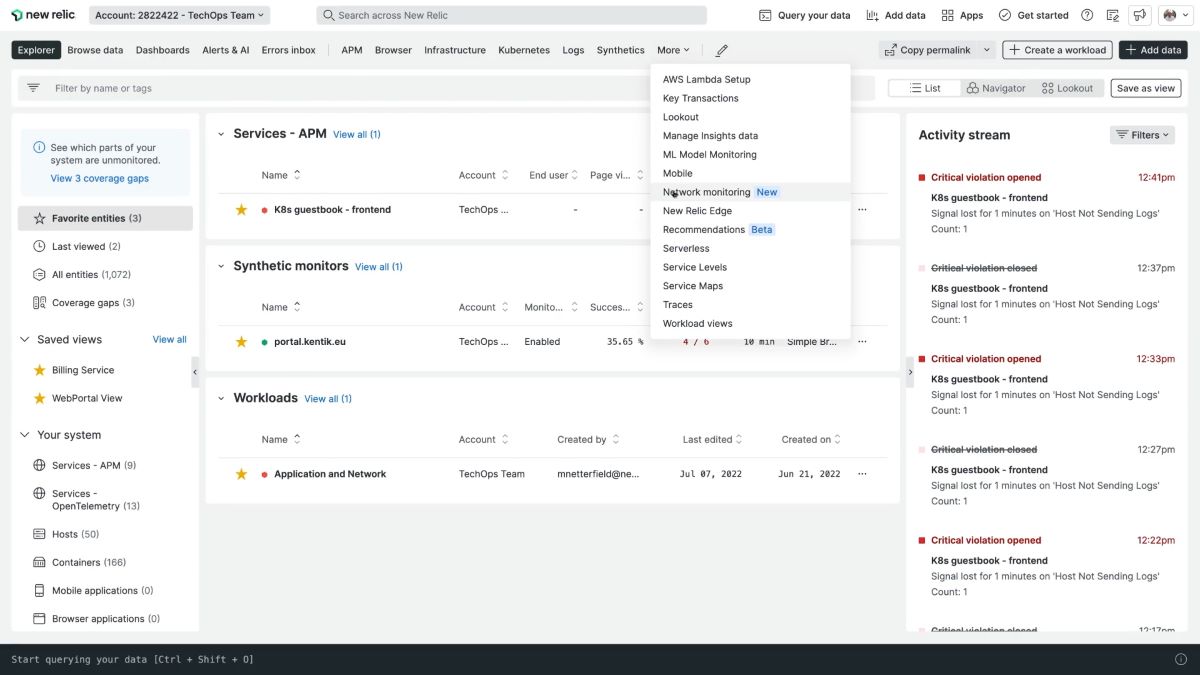
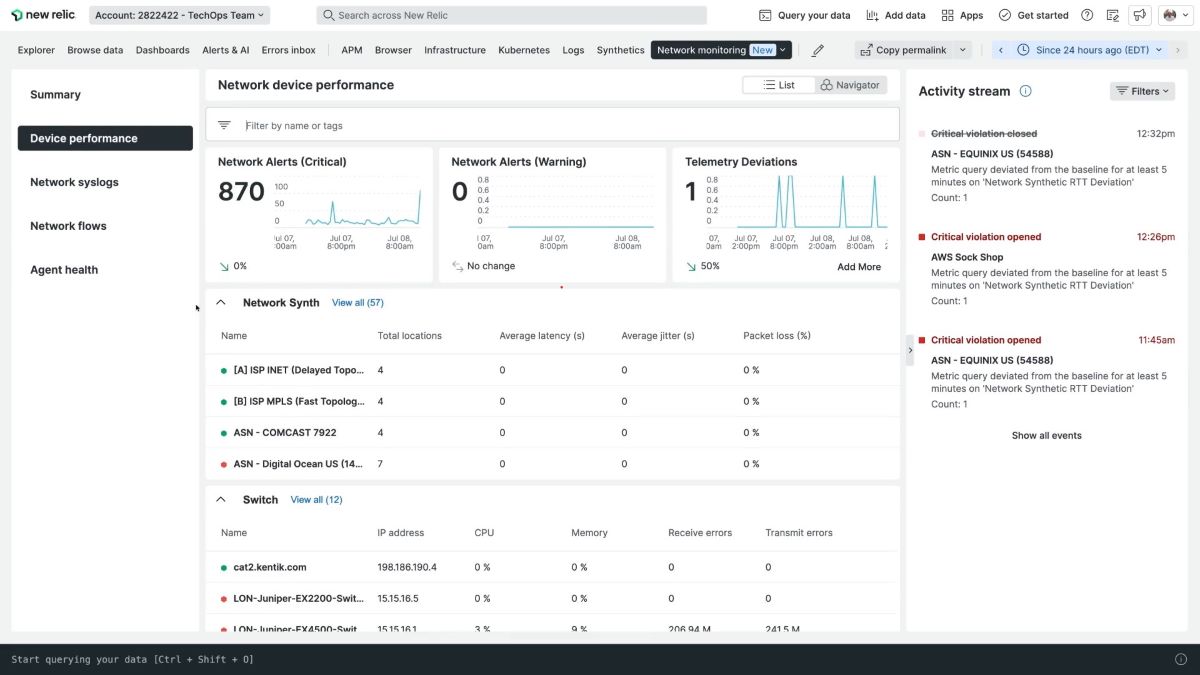
New Relic's primary focus on application performance monitoring (APM) and a comprehensive suite of observability tools. It excels in providing detailed insights into application behavior, transaction traces, and code-level performance. New Relic's strengths lie in end-to-end APM, infrastructure monitoring, and synthetic testing for web applications. The platform offers a user-friendly interface, real-time analytics, and cloud-native capabilities.
The choice between New Relic and Kentik depends on specific organizational needs, particularly whether a stronger emphasis on APM or network flow analysis is prioritized.
New Relic App:
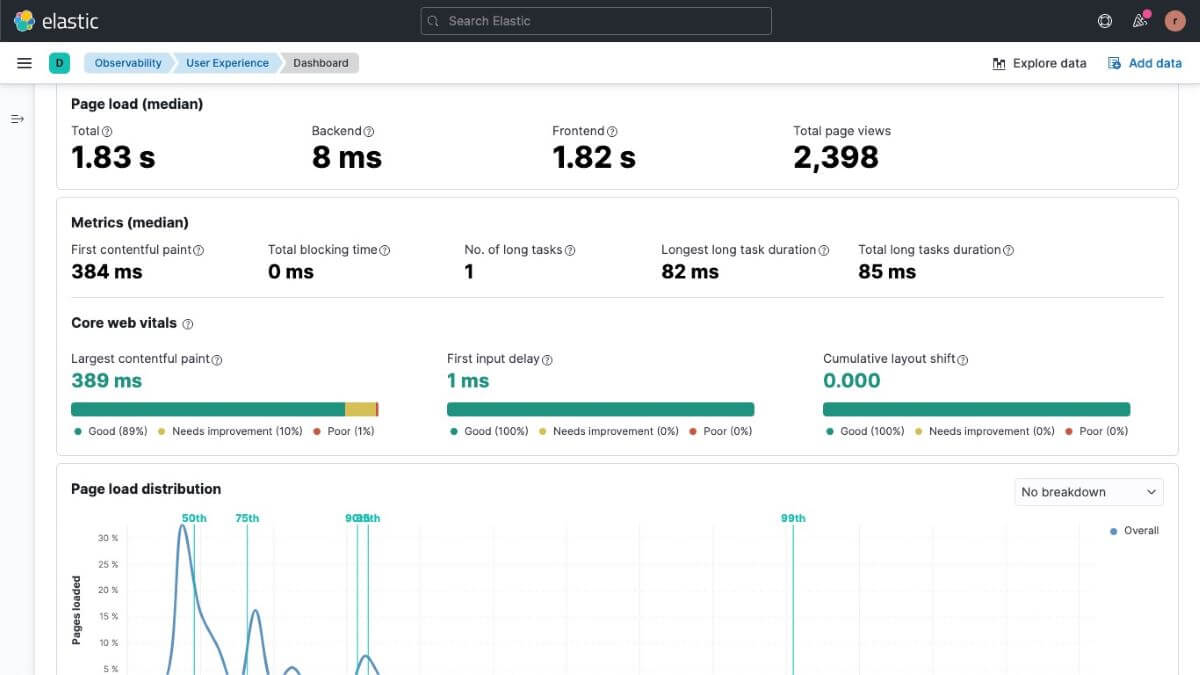
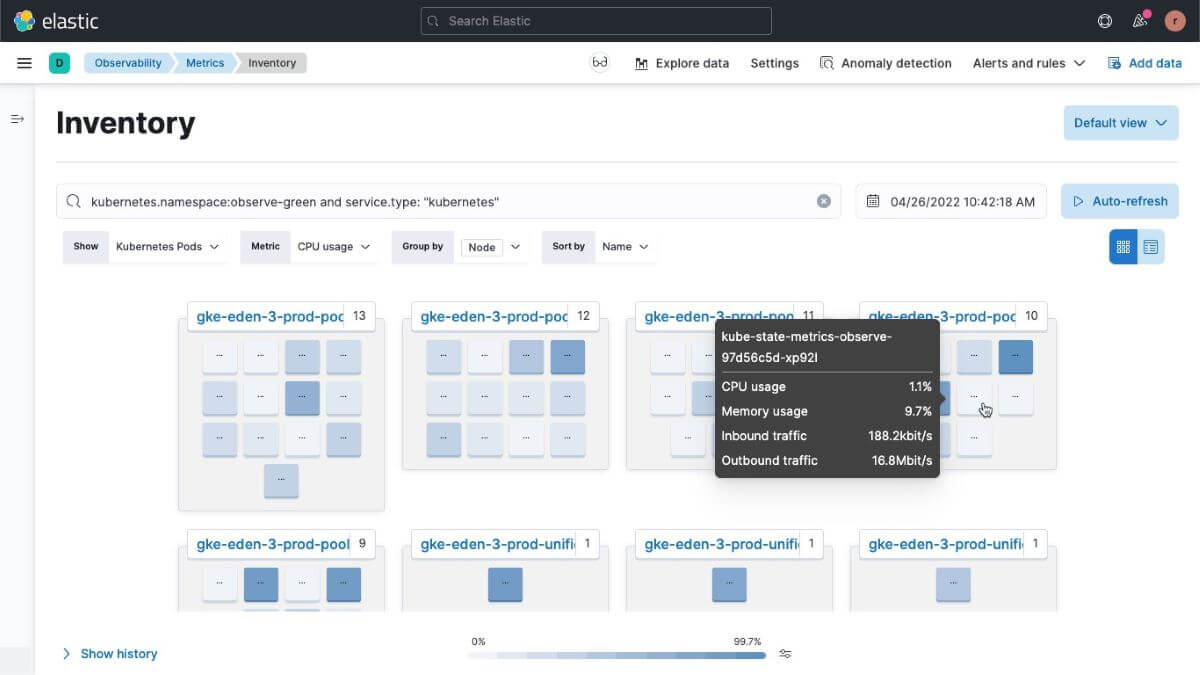
Elastic Observability is a monitoring and analytics platform that offers end-to-end visibility into network performance, infrastructure, and applications. It excels in real-time insights, anomaly detection, and application performance monitoring. With a focus on log and metric data, Elastic Observability offers robust visibility into network and application performance.
While Kentik emphasizes flow-based analysis and network visibility, Elastic Observability complements this with its strength in log and metric analysis, making it a strong alternative for organizations prioritizing these aspects.
Elastic Observability App:

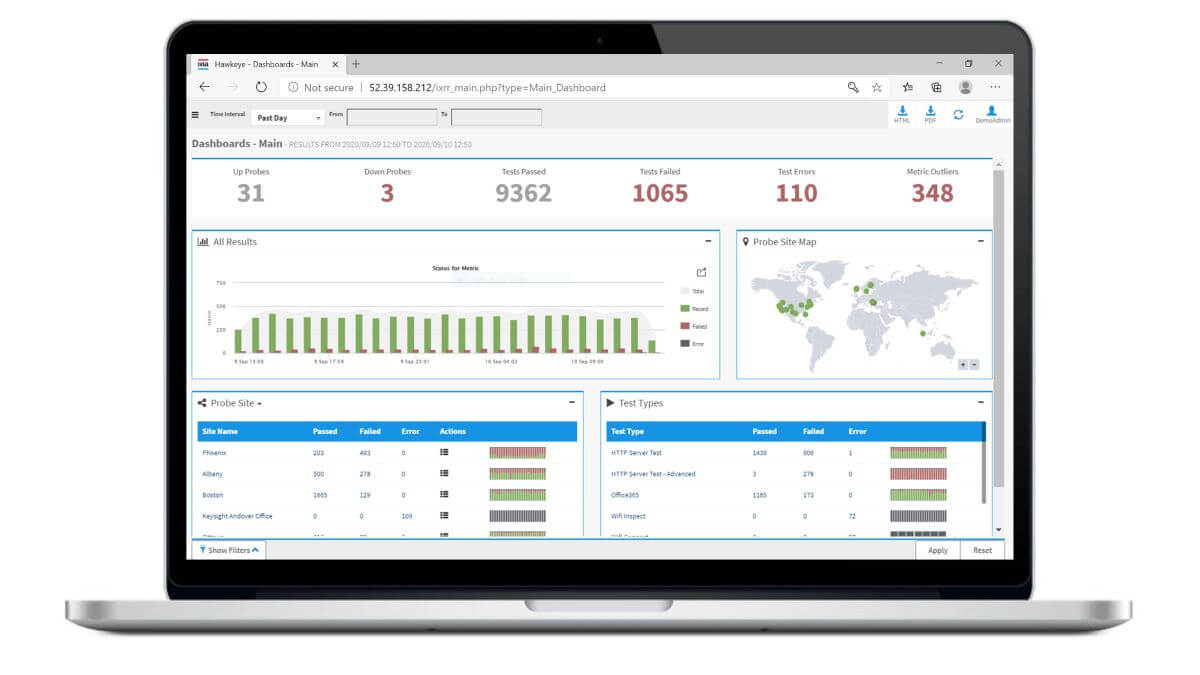
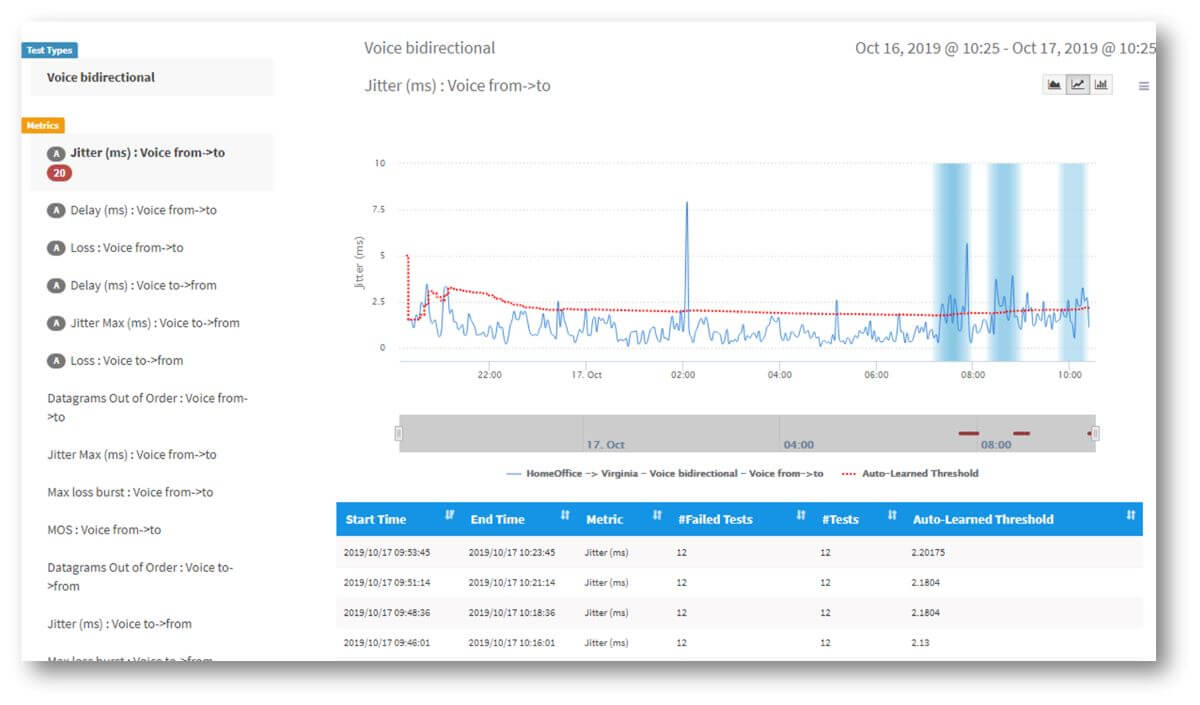
Ixia/Keysight Network Monitoring is a network monitoring and testing solution that offers real-time network monitoring, network traffic analysis, and security testing capabilities. Ixia/Keysight is known for its comprehensive network visibility, active and passive monitoring capabilities, and a focus on security testing and visibility solutions. It excels in providing detailed insights into network traffic, performance, and security. The platform also offers features like application performance testing and security resilience testing.
While Kentik emphasizes flow-based analysis and overall network visibility, Ixia/Keysight complements this with advanced testing and security-focused features.
Ixia/Keysight App:
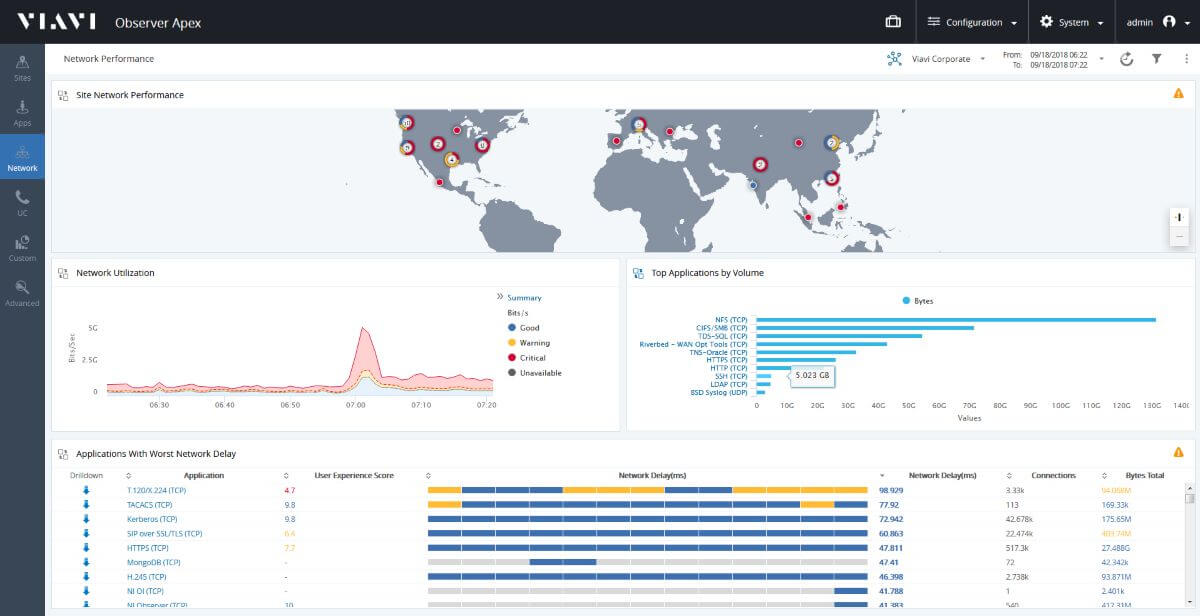
Ixia/Viavi Observer Solutions specializes in packet-level analysis, delivering comprehensive insights into network traffic. Its focus on deep packet inspection, real-time analytics, and forensics distinguishes it in the industry. While Kentik emphasizes flow-based analysis and global network visibility, Ixia/Viavi Observer Solutions excels in granular packet-level visibility for in-depth network analysis. B
oth solutions offer scalability, but organizations may choose between them based on priorities such as flow-based versus packet-level analysis, real-time analytics, and specific monitoring requirements.
Viavi Solutions App:

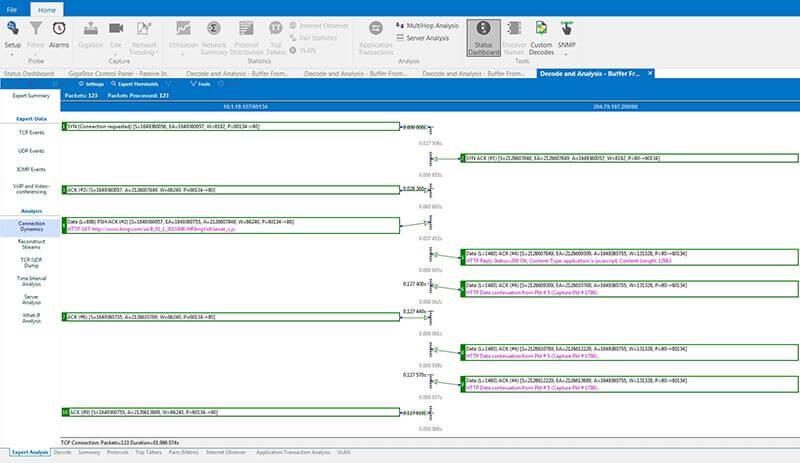
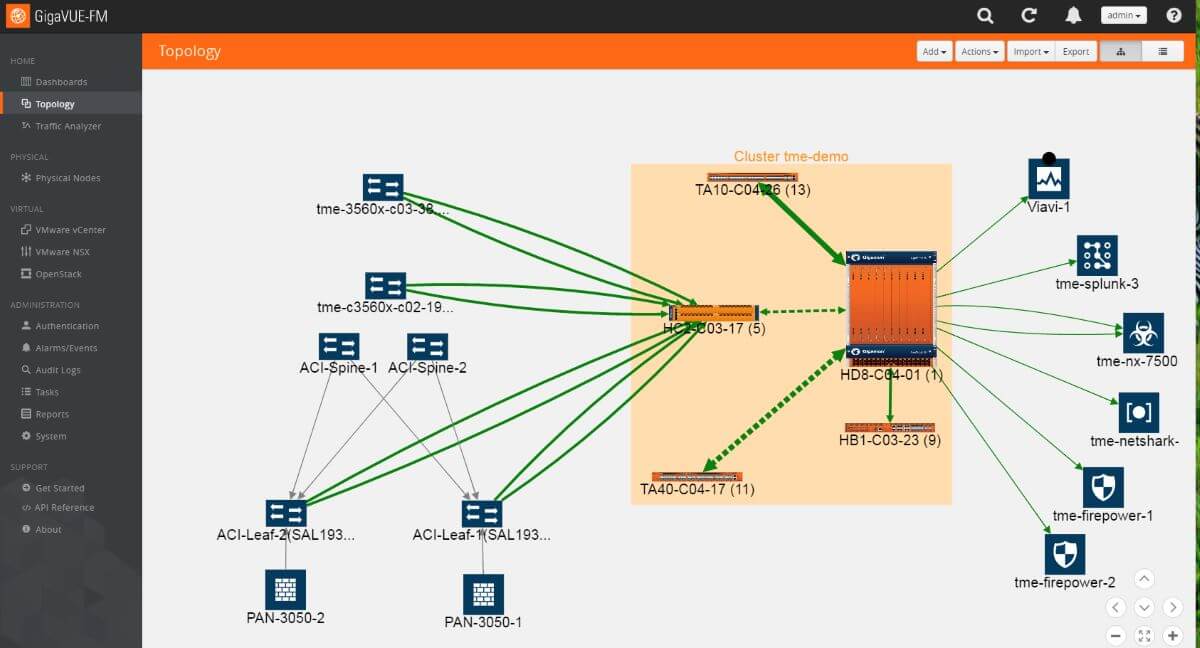
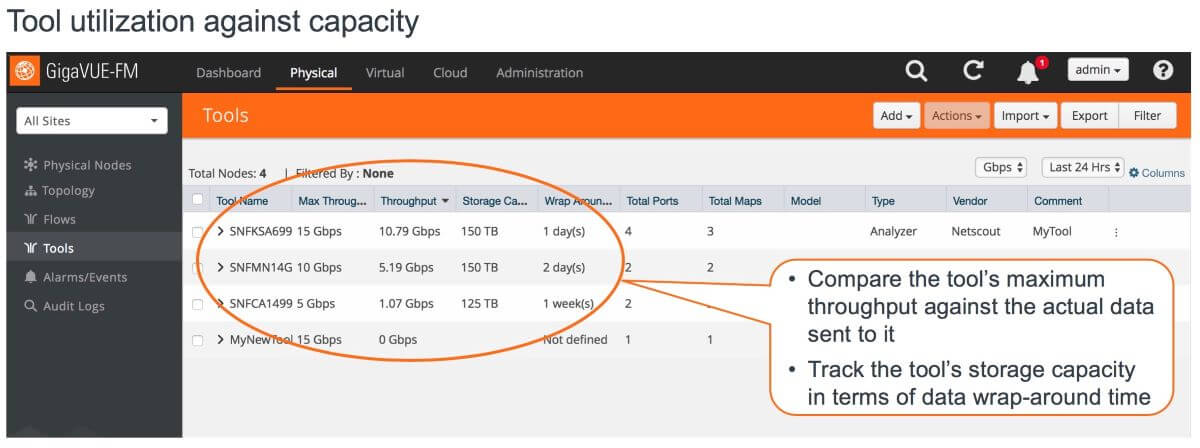
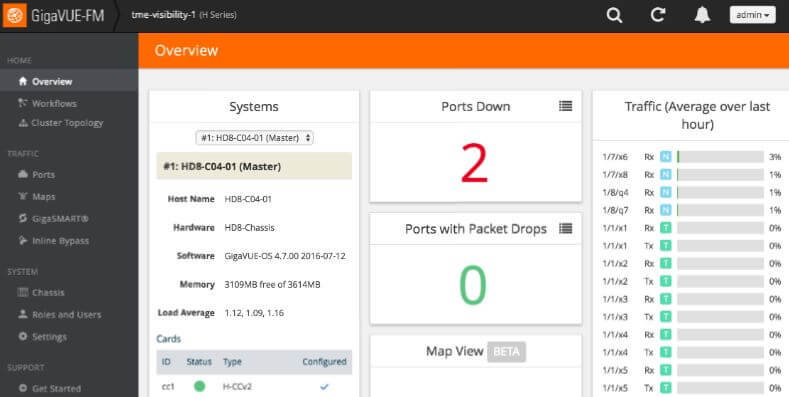
Gigamon is a network visibility and analytics platform recognized for its focus on network visibility and packet-level analysis, providing organizations with in-depth insights into network traffic. Its strengths lie in optimizing network performance, enhancing security, and enabling efficient network monitoring through robust traffic visibility. Gigamon is particularly beneficial for organizations prioritizing detailed packet analysis and network visibility.
On the other hand, Kentik emphasizes flow-based analysis and global network visibility, offering insights into traffic patterns and network behavior. The choice between Gigamon and Kentik depends on specific organizational needs, with Gigamon excelling in packet-level analysis and Kentik in flow-based network visibility.
Gigamon App:
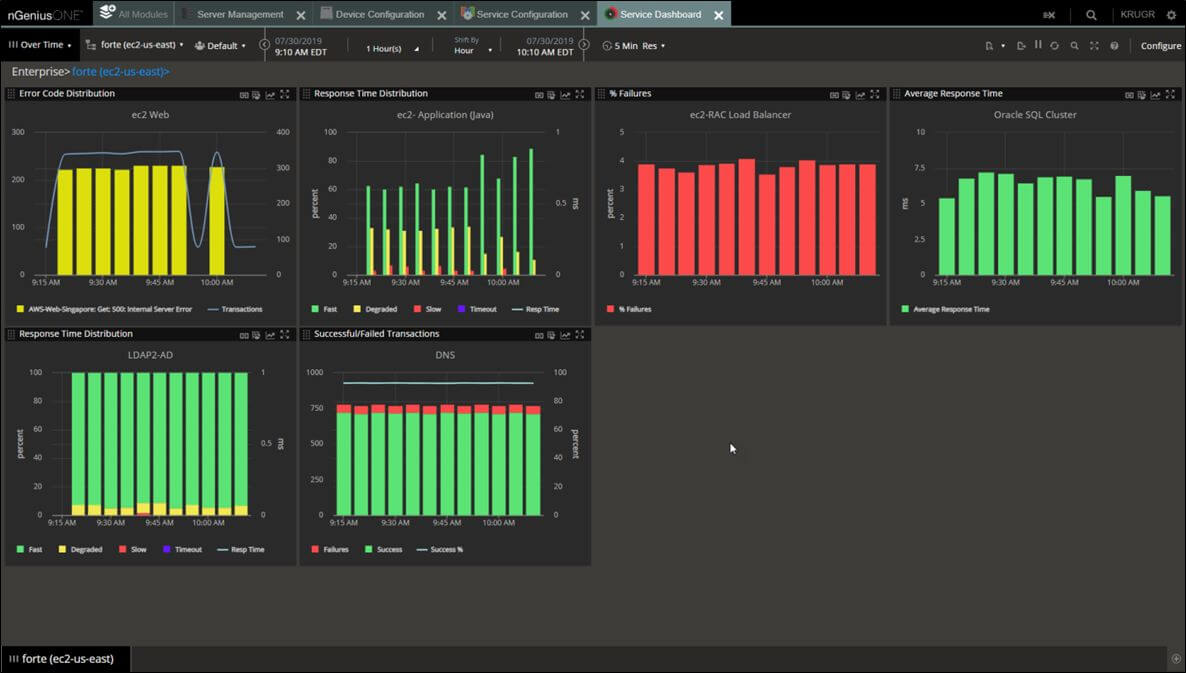
Netscout nGeniusOne is a network performance management platform that offers comprehensive visibility into network traffic, application performance, and security. It specializes in packet-level analysis, providing detailed insights into network behavior and identifying potential issues. NETSCOUT's nGeniusONE platform emphasizes real-time analytics, troubleshooting, and security incident detection.
While Kentik also offers robust flow-based analysis and network visibility, NETSCOUT excels in packet-level insights and is known for its expertise in network and application performance monitoring, making it a suitable alternative.
Netscout nGeniusOne App:

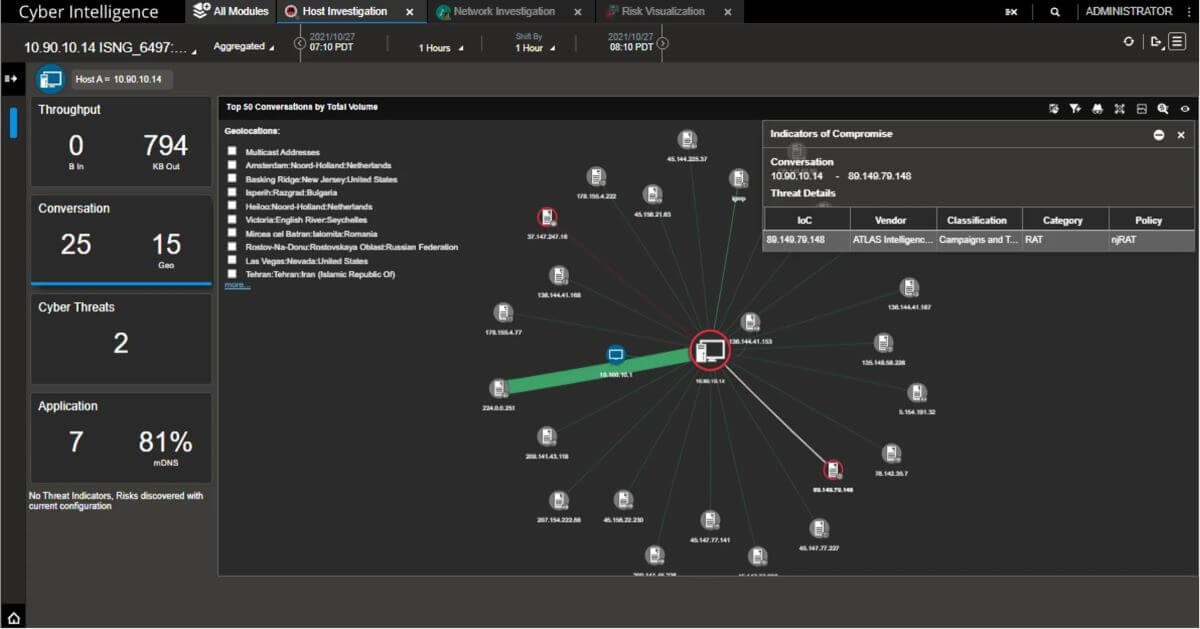
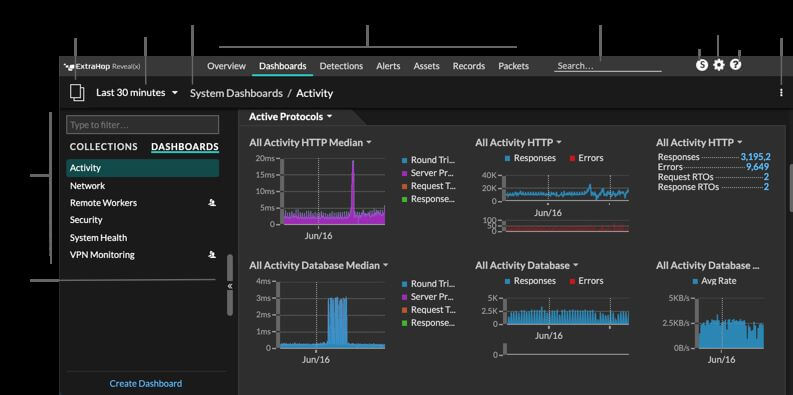
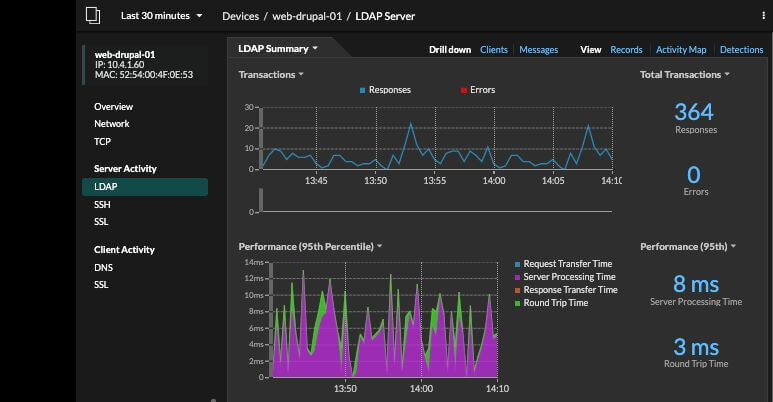
Extrahop Revealx is a cloud-based network detection and response platform that offers real-time network monitoring, threat detection, and investigation capabilities. The platform emphasizes security and provides visibility into device interactions. In contrast, Kentik is recognized for its flow-based analysis, global network visibility, and comprehensive traffic insights. While Extrahop Reveal(x) stands out for security-focused wire data analytics, Kentik complements its offerings with flow-based analysis for network visibility
Extrahop Revealx App:

Accedian Skylight specializes in application and network performance monitoring, offering detailed insights into end-to-end application performance and user experience. The platform utilizes a combination of active and passive monitoring techniques, providing a comprehensive view of network health. Skylight's focus on real-time analytics, packet-level visibility, and application performance makes it a strong alternative to Kentik, especially for organizations prioritizing application-centric monitoring.
Considerations for the choice between the two solutions should be based on specific organizational requirements and preferences, emphasizing either flow-based analysis and network visibility (Kentik) or detailed application performance insights (Skylight).
Skylight App:
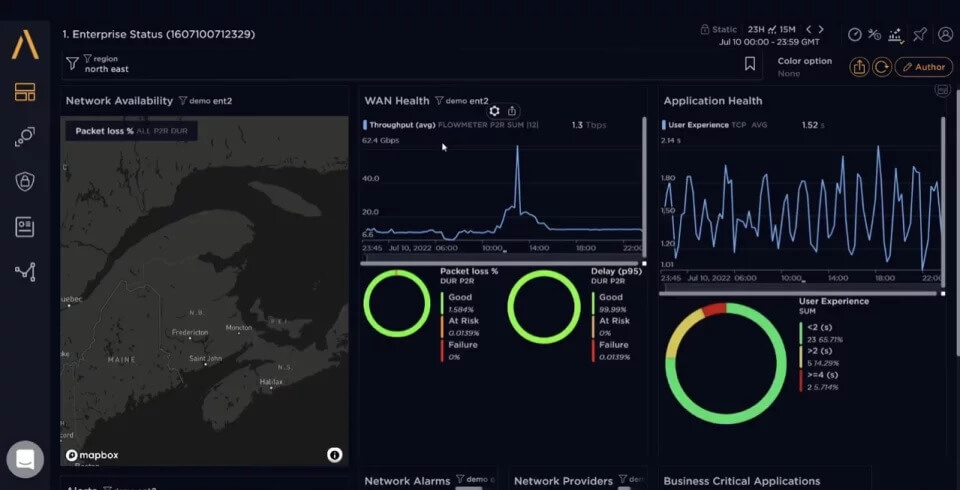
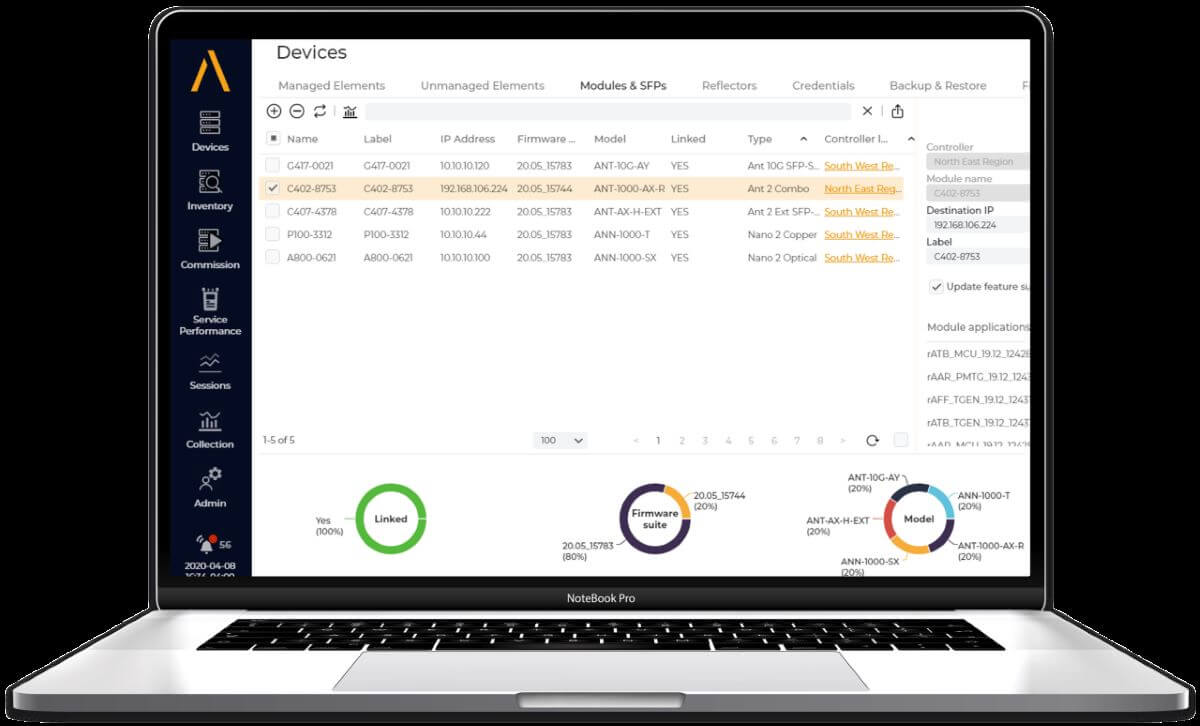
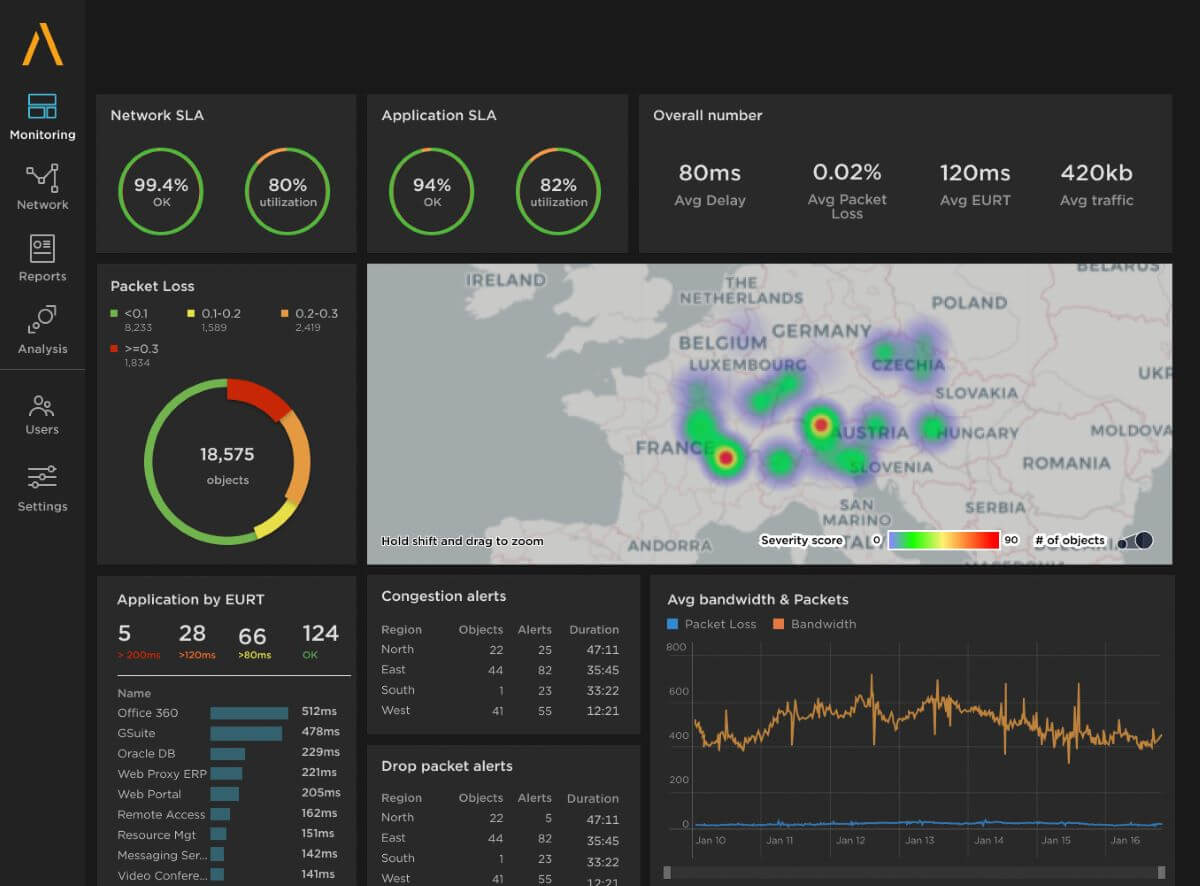

In conclusion, while Kentik is a top-tier network performance monitoring tool, there are several viable alternatives that can meet your specific needs. It's essential to identify the features you appreciated or disliked about Kentik and understand your requirements to find the best alternative.
This list provides various solutions categorized based on their capabilities, allowing you to discover similar software or explore new alternatives that you may not have previously considered.

Obkio's Network Performance Monitoring tool offers a unique blend of synthetic traffic simulation, SNMP support, and device monitoring features, providing a comprehensive solution for network optimization. Experience seamless deployment, user-friendly interfaces, and cost-effective pricing that adapts to your organization's needs.
Make the switch to Obkio and unlock a new level of network performance visibility. Start your trial today and witness the power of proactive monitoring, ensuring a superior end-user experience for your network.
- 14-day free trial of all premium features
- Deploy in just 10 minutes
- Monitor performance in all key network locations
- Measure real-time network metrics
- Identify and troubleshoot live network problems

Let us show you why Obkio is the #1 Kentik alternative! We'll discuss your use case and show you around Obkio's app.
This page is compiled from the information available on the software’s official website. We have made every attempt to ensure the accuracy and reliability of the information provided in this article. However, the information is provided “as is” without warranty of any kind. Obkio is not liable for any inaccuracies in the article due to changes made on their websites or any development made to their products after the date of publication of this article. Please refer to their websites for more information.


 Obkio Blog


