Table of Contents
Table of Contents
Your remote developer can't access the VPN. Is it his home router? His ISP? Your network? You have no idea and no way to find out.
This is the reality of modern IT. Your network doesn't end at your office perimeter. It extends into hundreds of homes, coffee shops, branch offices, and third-party locations you'll never set foot in. And when performance tanks, you're troubleshooting blind.
Traditional network monitoring was built for networks you control: switches you configure, routers you access, infrastructure you manage. But the networks your organization depends on most? You don't control them at all.
This is the unmanaged network problem. And it's getting worse as remote work becomes permanent.
An unmanaged network is any network connection your organization relies on but doesn't directly control or have administrative access to.
These fall into two main categories:
- Remote worker environments: Home networks with consumer-grade routers, personal ISP connections, residential Wi-Fi setups, equipment you've never seen and never will.
- Third-party infrastructure: Branch office networks managed by local providers, partner networks your systems communicate with, public Wi-Fi in coworking spaces, cloud provider backbone infrastructure, ISP routing and middle-mile networks.
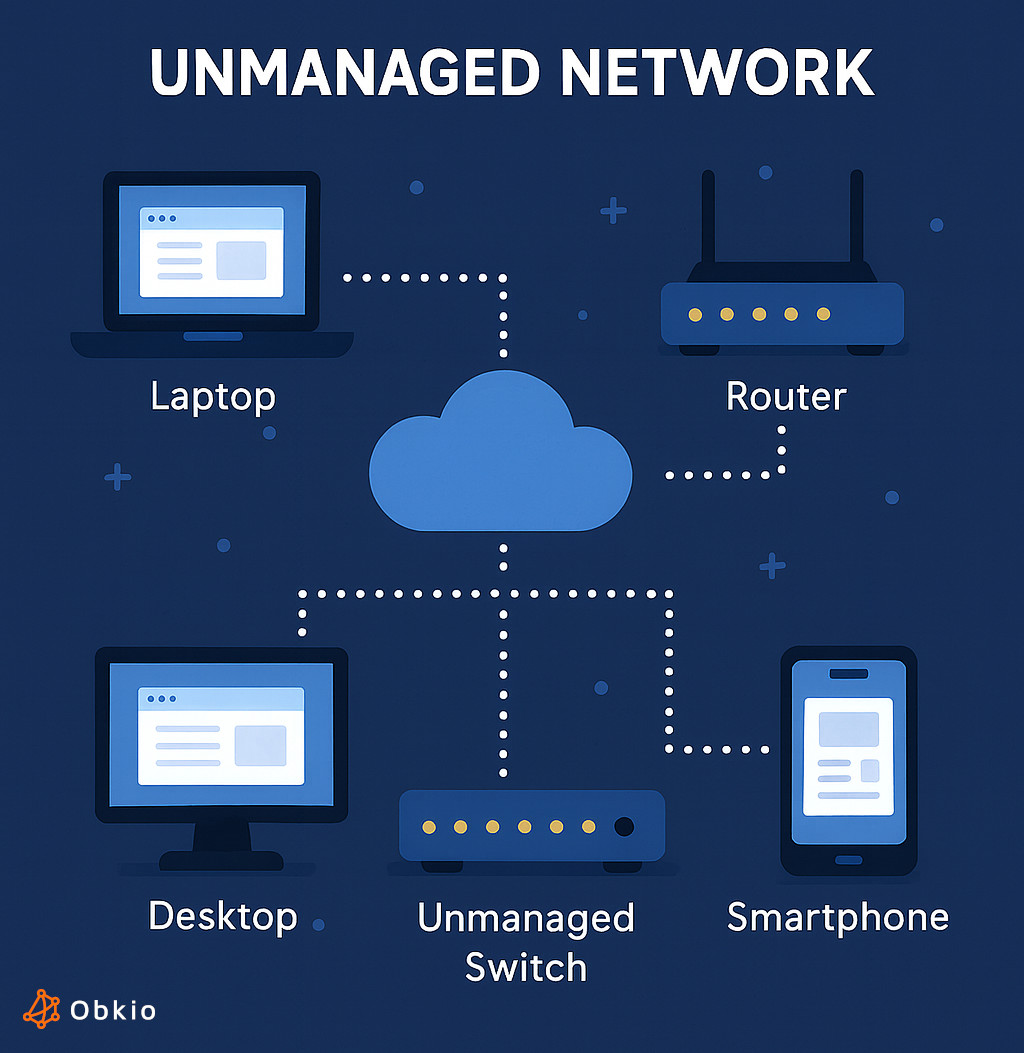
The remote worker scenario is where unmanaged networks hit hardest. When your team works from home, they're connecting through infrastructure you have zero control over. Their Internet connection. Their home router is from 2019. Their Wi-Fi shares walls with three neighbouring networks. Their device is competing with kids streaming on the same connection.
You can't log into their equipment. You can't modify their ISP routing. You can't deploy your traditional monitoring stack to their living room.
But when their performance drops and productivity tanks, it's still your problem to solve.
Traditional monitoring tools assume you own the infrastructure.
SNMP polling? Requires administrative access to network devices. You're not getting that on someone's home router, assuming it even supports SNMP, which consumer equipment typically doesn't.
Configuration changes? Not your equipment to configure.
Physical access for troubleshooting? You're not driving to 200 remote worker homes.
NetFlow analysis? Only works on infrastructure you control.
On-premise monitoring appliances? Where exactly are you installing those in an unmanaged network?
Even if you somehow convince every remote worker to give you access to their home router (good luck with that privacy conversation), you still can't control their ISP. You can't fix their neighbour's Wi-Fi interference. You can't upgrade their broadband plan.
But you absolutely need visibility. When a remote worker can't join the morning standup, you need answers:
- Is it their device choking on resources?
- Is it their Wi-Fi dropping packets?
- Is it their ISP having a bad day?
- Is it routing between their ISP and your data center?
- Is it actually your VPN concentrator?
Traditional monitoring can't tell you. It's watching your network, not theirs.
Learn how to use Obkio Network Monitoring to help IT Teams troubleshoot and solve a variety of network problems affecting users working from home.
Learn more

To monitor unmanaged networks, flip the entire approach.
Stop trying to monitor TO remote locations from your data center. Instead, monitor FROM the endpoint (from the user's actual perspective) inside the unmanaged network itself.
This works because:
- No infrastructure access required: You're not polling their router. You're testing from their device, which you do control.
- Real user experience: You're measuring performance exactly as users experience it (same device, same network, same path).
- Complete path visibility: You see every hop from their device to your applications, including the unmanaged network segments you can't control.
- Troubleshooting data without site visits: Collect performance metrics remotely instead of relying on vague user descriptions like "the Internet is slow."
The key is distributed monitoring with centralized visibility. Deploy lightweight monitoring capabilities at each unmanaged network location, then aggregate all that data into one dashboard your IT team can actually use.
Obkio is a network performance monitoring solution built specifically for this distributed monitoring approach. Rather than centralized monitoring that tries to watch everything from one location, Obkio uses lightweight Monitoring Agents deployed at unmanaged network locations to test from the user's perspective.
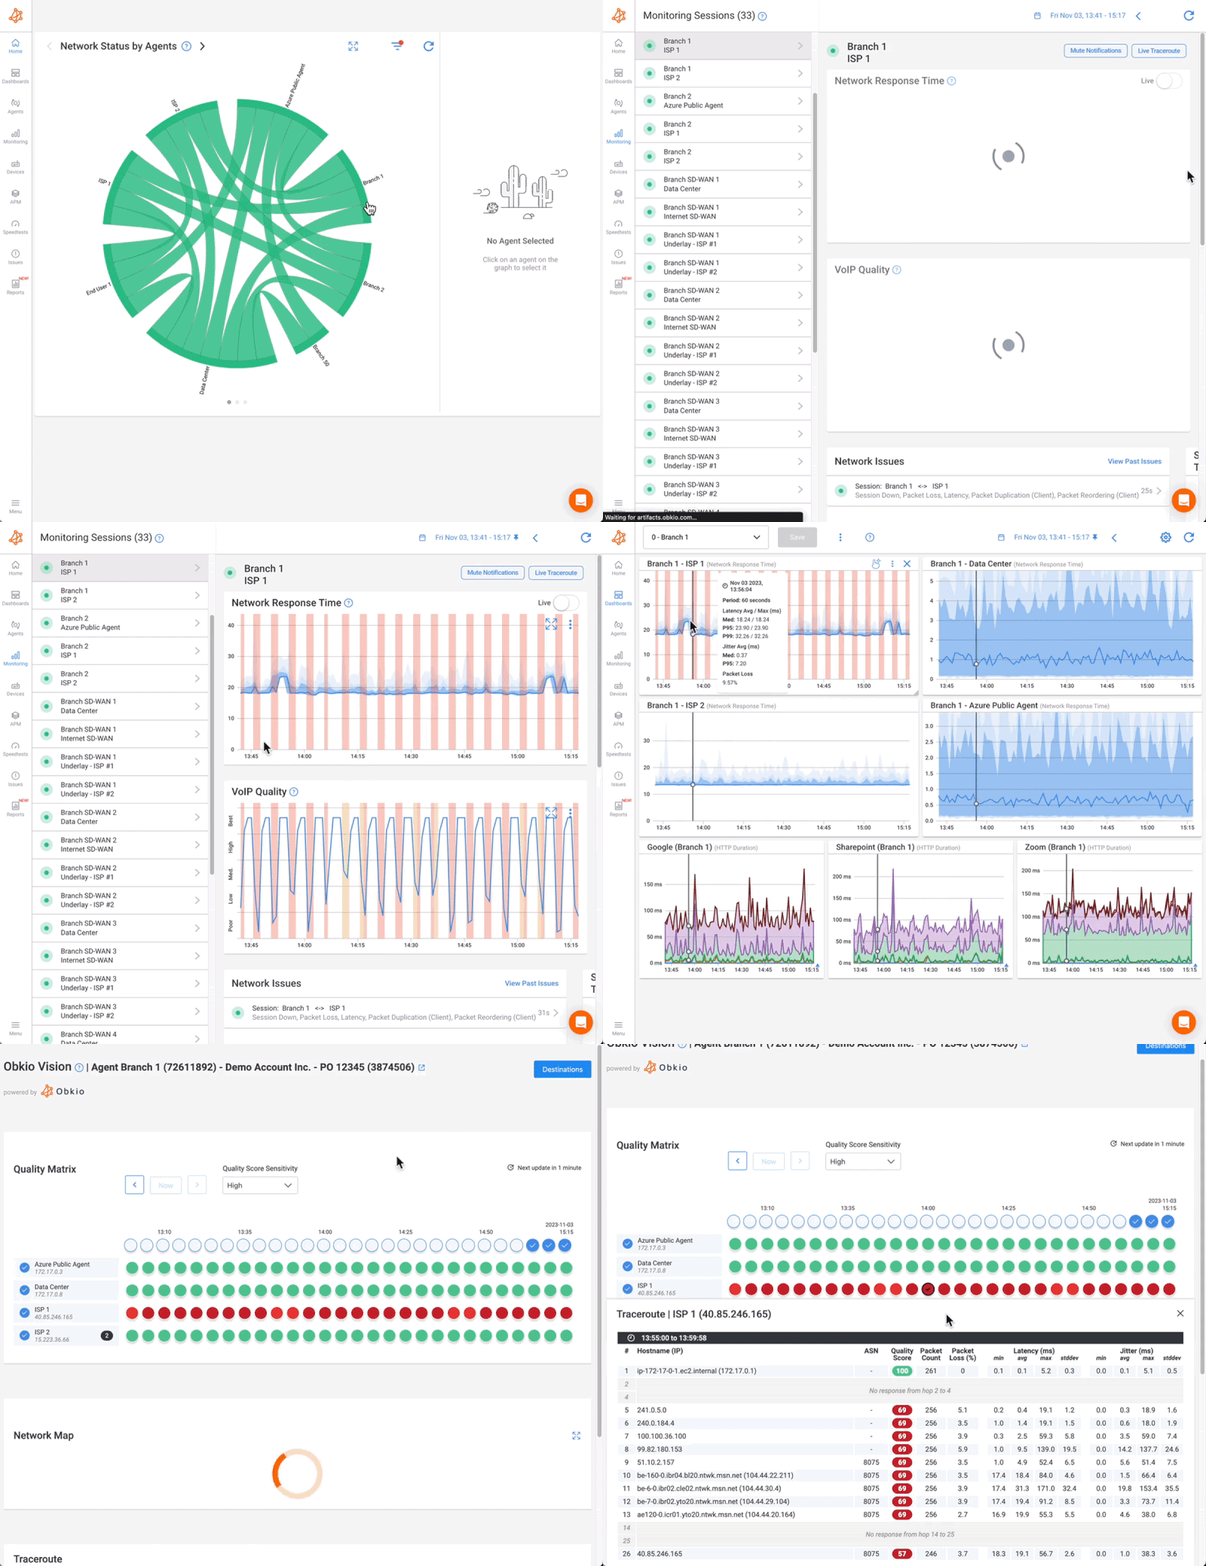
- Monitoring Agents: Lightweight software or virtual machines deployed at each location you need to monitor. Install agents on remote worker laptops or use virtual appliances in cloud environments. These agents are the "eyes and ears" at each unmanaged network location.
- Synthetic Traffic: Agents exchange synthetic UDP packets every 500 milliseconds to continuously measure network performance. This constant stream of synthetic traffic measures latency, jitter, and packet loss in real-time without requiring packet capture or inspecting actual user data. The synthetic approach respects privacy while catching intermittent issues in unmanaged networks.
- Public Monitoring Agents: Pre-deployed agents hosted in AWS, Azure, and Google Cloud regions worldwide. These Public Agents are already running; no installation is needed. Perfect for testing connectivity from remote workers to major cloud platforms or validating ISP performance to the internet.
- Centralized Dashboard: All performance data from distributed agents flows to one cloud-based platform. Your IT team sees unified visibility across every unmanaged network location, sorted, filtered, and compared in one interface.
- Visual Traceroutes: Interactive network path maps with colour-coded performance indicators. See hop-by-hop latency, packet loss, and jitter from remote worker devices through their ISP to your applications. Historical traceroute data shows patterns over time with one-minute granularity.
- Smart Notifications: Automatic alerts when performance degrades, with intelligent grouping to reduce noise.
The distributed agent architecture solves the fundamental problem of monitoring networks you don't control:
- No infrastructure access needed: Agents run on endpoints you do control (employee laptops, branch office appliances) rather than requiring access to routers or switches you don't.
- Tests from the user's location: Rather than testing TO a remote worker from your data center (which only shows you one direction), agents at the remote worker's location test FROM their perspective, measuring performance exactly as they experience it.
- Continuous monitoring catches intermittent issues: The 500ms measurement interval catches the ISP congestion spike that lasts 90 seconds or the Wi-Fi interference. Five-minute polling intervals would miss these transient problems entirely.
- Scales from 10 to 10,000 locations: Deploy agents wherever you need visibility (home offices, branch locations, partner sites). All data is centralized to one dashboard regardless of scale. Adding a new remote worker? Deploy the agent. That's it.
- Privacy-respecting approach: Synthetic traffic means you're not capturing actual user data or inspecting real traffic. The monitoring traffic is lightweight and non-intrusive, with minimal impact on available bandwidth.

- 14-day free trial of all premium features
- Deploy in just 10 minutes
- Monitor performance in all key network locations
- Measure real-time network metrics
- Identify and troubleshoot live network problems

This architecture makes it possible to answer the question "where is the problem?" for networks you'll never directly access: is it the device, the home network, the ISP last mile, the ISP backbone, internet routing, or your own infrastructure?
Let's walk through exactly how to implement this approach for your unmanaged networks.
Traditional centralized monitoring tests TO remote locations from a central point. That only shows you one direction and gives you limited visibility into what's happening within those unmanaged networks.
Distributed Network Monitoring places monitoring capabilities AT each unmanaged network location, testing FROM the user's perspective. This means deploying monitoring agents directly on devices within those networks.
Install monitoring agents on devices within unmanaged networks: laptops, workstations, and small appliances at branch offices.
What makes an effective agent deployment:
- Lightweight software that runs transparently: The agent can't impact device performance or user experience. Users shouldn't know it's running. Obkio's monitoring agents are designed to minimize resource consumption.
- Mass deployment capabilities: You need to roll out to hundreds of endpoints without manual installation. Silent deployment via your existing device management tools (Intune, Jamf, Group Policy) is non-negotiable. For remote workers, this means deploying agents during onboarding or pushing them through your MDM solution.
- Cross-platform support: Your remote workforce isn't standardized. Windows, macOS, and Linux support is mandatory. For branch offices without traditional servers, hardware appliances offer plug-and-play deployment, just power and Ethernet, no configuration needed.
- Fast time to data: From installation to first performance data should take under 10 minutes. Obkio agents start collecting data immediately after deployment, with automatic updates pushed from the cloud platform; no user interaction is required.
Different unmanaged network environments need different deployment approaches:
1. Software agents for remote workers: Install directly on employee laptops and workstations. These agents run in the background on Windows, macOS, or Linux machines, collecting performance data without user interaction. Perfect for work-from-home scenarios where you need visibility into home network performance. Deploy through your standard software distribution tools.
2. Hardware appliances for branch offices: When branch offices don't have IT servers, plug-and-play hardware appliances eliminate setup complexity. Obkio's hardware agents require only two cables, power and Ethernet. The appliance pairs with your cloud platform using its serial number printed on the device. No local configuration, no technical expertise needed on-site. Perfect for retail locations, small warehouses, or remote offices without IT staff.
3. Virtual appliances for data centers: For VMware or Hyper-V environments, virtual machine images deploy quickly with automatic OS and application updates. Ideal for monitoring performance from data centers or cloud environments toward remote locations. Download the VM image, deploy it, and monitoring starts automatically.
4. Public monitoring agents: Pre-deployed agents hosted by Obkio and partners in AWS, Azure, Google Cloud across global regions. These agents are already running; no installation is needed. Perfect for testing connectivity from remote workers to major cloud platforms, validating ISP performance to the internet, or comparing performance across different paths. Available to all users immediately.
Once agents are deployed, you need continuous performance data collection from all those distributed unmanaged networks, consolidated into one centralized monitoring dashboard.
Stop thinking in terms of periodic checks. Network issues on unmanaged networks are often intermittent: the ISP has congestion during peak hours, the home router hiccups under load, and Wi-Fi interference spikes. If you're checking every 5 minutes, you'll miss most problems.
The foundation of unmanaged network monitoring is continuous synthetic traffic between deployed agents. Rather than relying on actual user traffic (which requires packet capture and raises privacy concerns), synthetic monitoring simulates user activity.

Here's how it works: Agents exchange synthetic UDP packets every 500 milliseconds between monitoring points. This constant stream of test traffic measures latency, jitter, and packet loss in real-time, creating a continuous baseline of network performance.
Every minute, the client agent reports the performance measurements to Obkio's cloud platform for analysis. This creates a continuous stream of data showing exactly what's happening on the network path between any two agents.
The synthetic approach also respects privacy; you're not capturing actual user data or inspecting real traffic. The monitoring traffic is lightweight and non-intrusive, with minimal impact on available bandwidth. No sensitive user information is collected.
Network performance is often asymmetric, especially on residential broadband connections. A remote worker might upload files fine but struggle downloading large datasets from your file server. Or vice versa, upload suffers while download is perfect.
Effective monitoring tests both directions simultaneously. Agents send synthetic traffic in both directions, measuring upload and download performance independently. This bidirectional approach reveals issues that would be invisible with one-way testing.
Different monitoring methods reveal different aspects of network health:
- Synthetic traffic monitoring (foundation): The base layer runs constantly, monitoring agents exchanging UDP packets every 500ms to measure latency, jitter, and packet loss. This creates your performance baseline and catches intermittent issues. Always running, always collecting data.
- HTTP monitoring: Tests web application accessibility and response times from unmanaged networks. Obkio can periodically monitor HTTP URLs to validate that internal web apps are reachable and measure actual response time from a remote worker's location. Critical for SaaS applications and web-based tools. If a remote worker can't reach your internal applications, HTTP monitoring shows whether the application is down or just unreachable from their location.
- Speed tests: On-demand or scheduled speed tests validate actual throughput versus ISP promises. When remote workers complain about slow performance, speed tests show whether bandwidth is the bottleneck. Scheduled speed tests throughout the day reveal peak-hour congestion patterns. Obkio can run these automatically or on-demand when troubleshooting.
- VoIP and Microsoft Teams monitoring: Synthetic VoIP testing predicts call quality without requiring active calls. By simulating voice traffic patterns, you can assess whether the network can support quality video conferences before users report choppy calls. Uses the MOS (Mean Opinion Score) algorithm from IP telephony to quantify call quality based on latency, jitter, and packet loss. The VoIP Quality graph shows you real-time call quality predictions so you can proactively address issues before important meetings.
- Device health monitoring: Monitor CPU, memory, disk, and network card performance on the endpoint itself. Sometimes "network problems" are actually device problems: a laptop running out of RAM, a driver issue causing packet loss, or CPU throttling from overheating. Device monitoring data helps you distinguish network issues from endpoint issues quickly.
- Network Destinations monitoring: Continuous ICMP monitoring of any IP address without requiring destination agents. Perfect for monitoring connectivity to third-party services, APIs, SaaS applications, payment gateways, or IoT devices. Generates continuous traceroutes that update in real-time, showing the complete path and performance to external endpoints. Network Destinations extends Obkio's monitoring beyond agent-to-agent sessions to any destination on the internet or your network.
All this data flows back to your centralized dashboard, where you can see performance across every unmanaged network at a glance. The dashboard shows you monitoring session status (green/yellow/red), recent performance trends, active issues, and detailed metrics for any session you want to investigate.
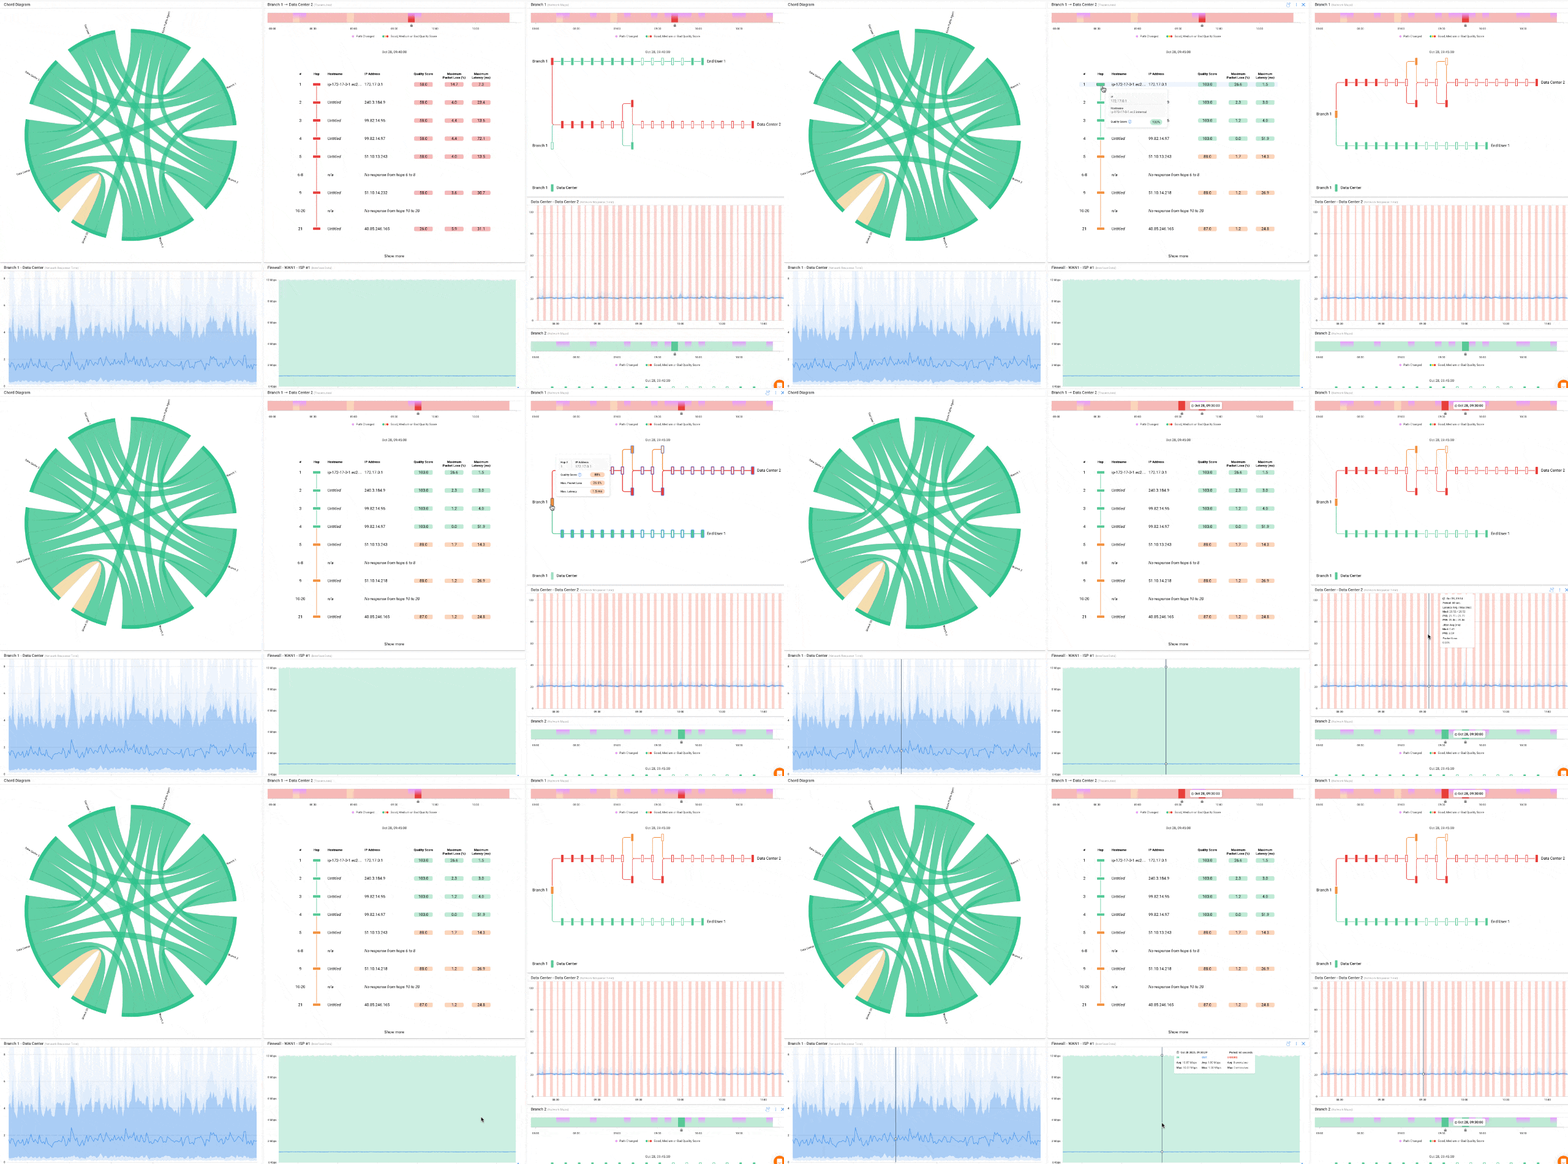
Stop waiting for users to report problems. Configure smart notifications when performance degrades on unmanaged networks.
When packet loss exceeds your threshold, you get notified. When latency spikes above acceptable levels, you know immediately. When an endpoint loses connectivity to critical applications, an alert fires.
Customizable thresholds for each metric: Unmanaged networks won't perform like your enterprise fibre connection. Set realistic thresholds. A home broadband connection hitting 30ms latency isn't a crisis. That same connection, hitting 200ms latency repeatedly, is.
You can adjust packet loss thresholds, latency limits, and jitter tolerances in your monitoring templates. Obkio's default thresholds turn monitoring session indicators yellow when packet loss exceeds 2% and red when it exceeds 5%, but you can customize these based on the specific network type and expected performance. Branch offices on business fibre might warrant stricter thresholds than remote workers on residential broadband.
Multiple notification channels: Email, Slack, Microsoft Teams, PagerDuty, ServiceNow, webhooks, whatever your team already uses. Alerts need to reach whoever's on call without requiring them to constantly watch a dashboard. Integrate with your existing alerting infrastructure rather than adding another system to monitor.
Event-based alerting: Get notified about specific network events: session up/down, high latency, excessive jitter, packet loss spikes, packet reordering, packet duplication, poor VoIP quality (MOS score), and more. Each event type can have its own threshold and notification rules.
You'll catch issues before the first support ticket arrives or before users even notice. That's the difference between proactive IT and reactive firefighting.
Obkio's Visual Traceroutes tool is fully integrated into the platform. Rather than running one-time traceroutes when you suspect a problem, Obkio automatically performs continuous traceroutes across your monitoring sessions and to any extra IP destinations you configure. The data is always there, ready when you need it.
Access visual traceroutes directly from any monitoring session. Click into a session showing performance issues, and you'll see the Network Path Map alongside your performance metrics. No manual triggers, no waiting for traceroute completion, the data is already collected and visualized.
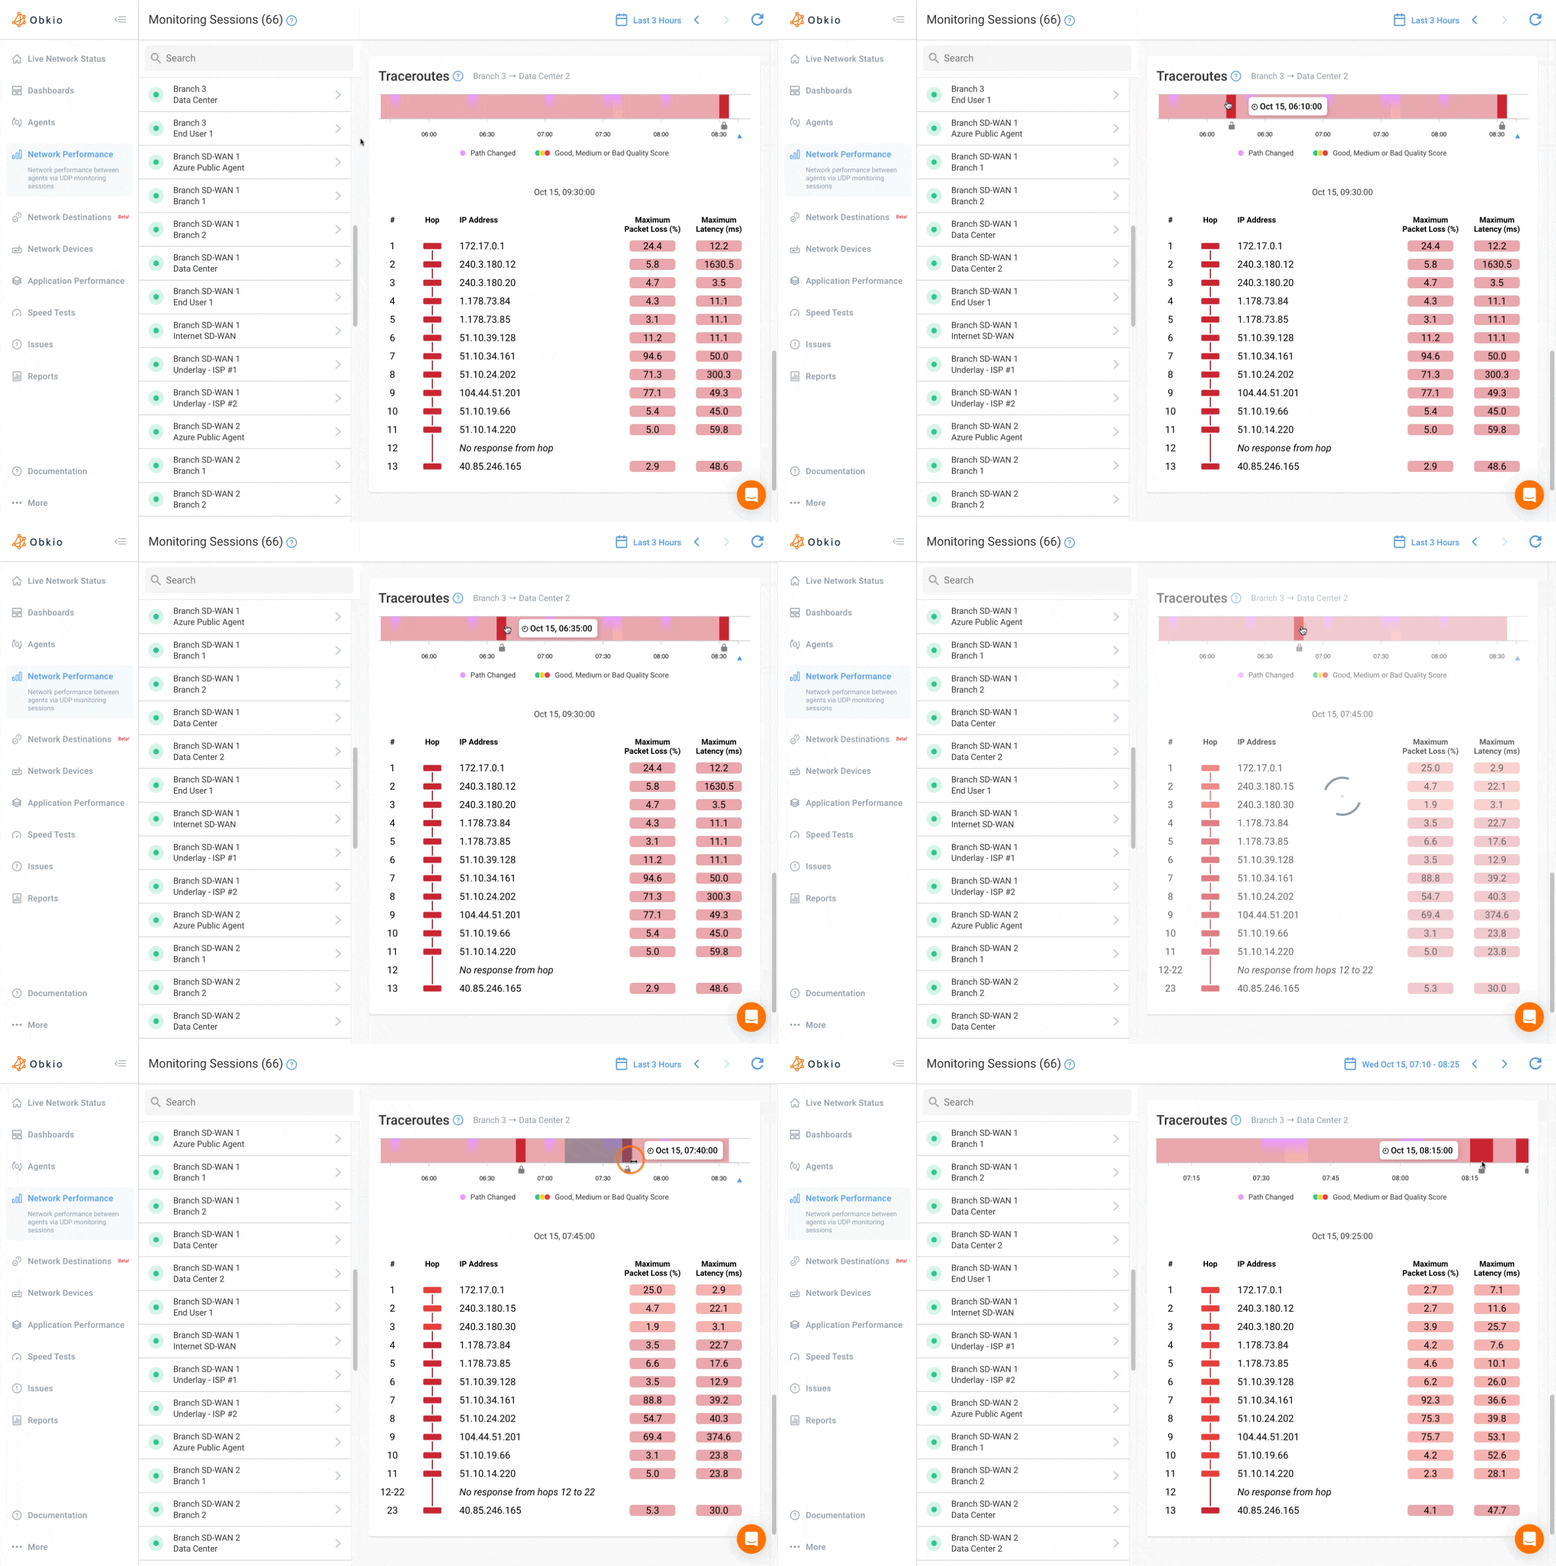
Interactive network path maps: Visual representation of the complete network path from source to destination. Every router, every ISP hand-off, every network segment rendered as a colour-coded diagram. Green means healthy, yellow indicates degradation, and red shows problems. You spot issues instantly without interpreting tables of latency values.
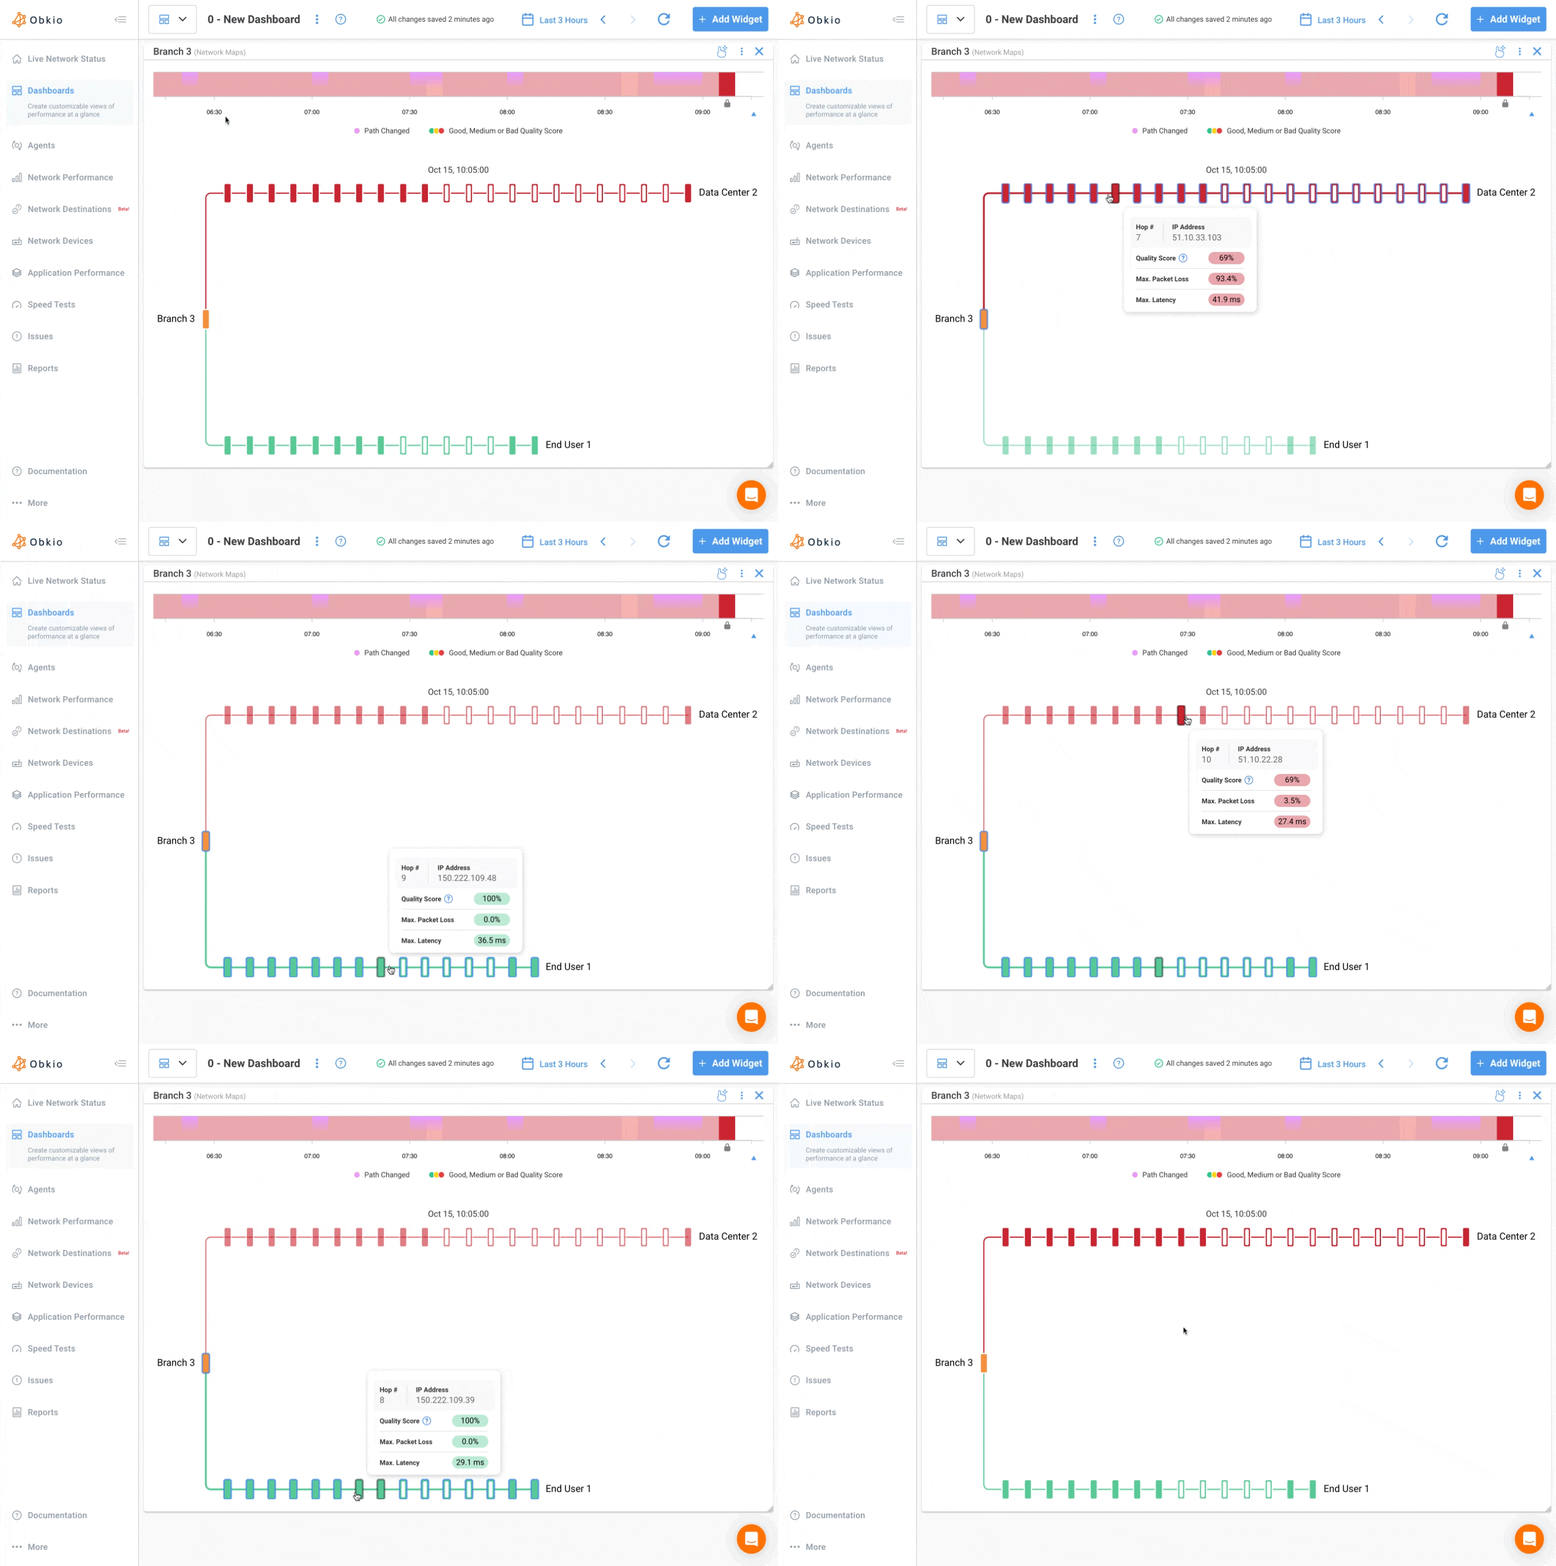
The Network Path Map shows multiple destinations in a single unified view, with hop counts and related IPs clearly labelled. All common hops across different destinations are grouped together, making it easy to see where paths diverge and where problems occur.
- Hop-by-hop performance metrics: Latency, packet loss, and jitter measured at every hop along the path. See exactly where performance degrades. Is latency normal through the first 5 hops, then spikes at hop 6? That's where your problem lives.
- Multi-destination view: Visualize performance from one Obkio agent to multiple destinations simultaneously: other agents, public monitoring agents, or extra IP destinations. Compare paths side-by-side to identify whether an issue affects all destinations or just specific ones. When troubleshooting remote worker connectivity, you can see if the problem is with their local network (affects all paths) or with a specific destination (affects one path).
- Historical traceroute data: Not just real-time visibility, months of historical traceroute data (depending on your monitoring plan) with one-minute granularity. Go back and investigate intermittent issues that happened last week, spot patterns in routing changes, or prove to ISPs that problems are recurring rather than one-time events.
- Route change detection: See when network paths change and how those changes impact performance. Path flapping (routes changing repeatedly) causes instability. Historical data shows you routing consistency over time and helps identify upstream routing issues.

When performance tanks, the critical question is: where exactly is the problem?
You need to distinguish between issues you can help fix and issues the user or their ISP need to address.
Problems originating in the unmanaged network itself:
- Device issues: CPU or memory overload causing network stack problems. Outdated network drivers. Faulty network card. Disk thrashing impacting everything. Your device health monitoring catches these.
- Local network problems: Wi-Fi signal strength too weak. Interference from neighboring networks. Router configuration issues. Too many devices competing for bandwidth. Network congestion from other users in the home.
- ISP last-mile connection: The physical connection from the location to the ISP's infrastructure. Cable degradation. Poor DSL signal quality. Fiber connection issues. This is the "last mile" problem that plagues remote workers.
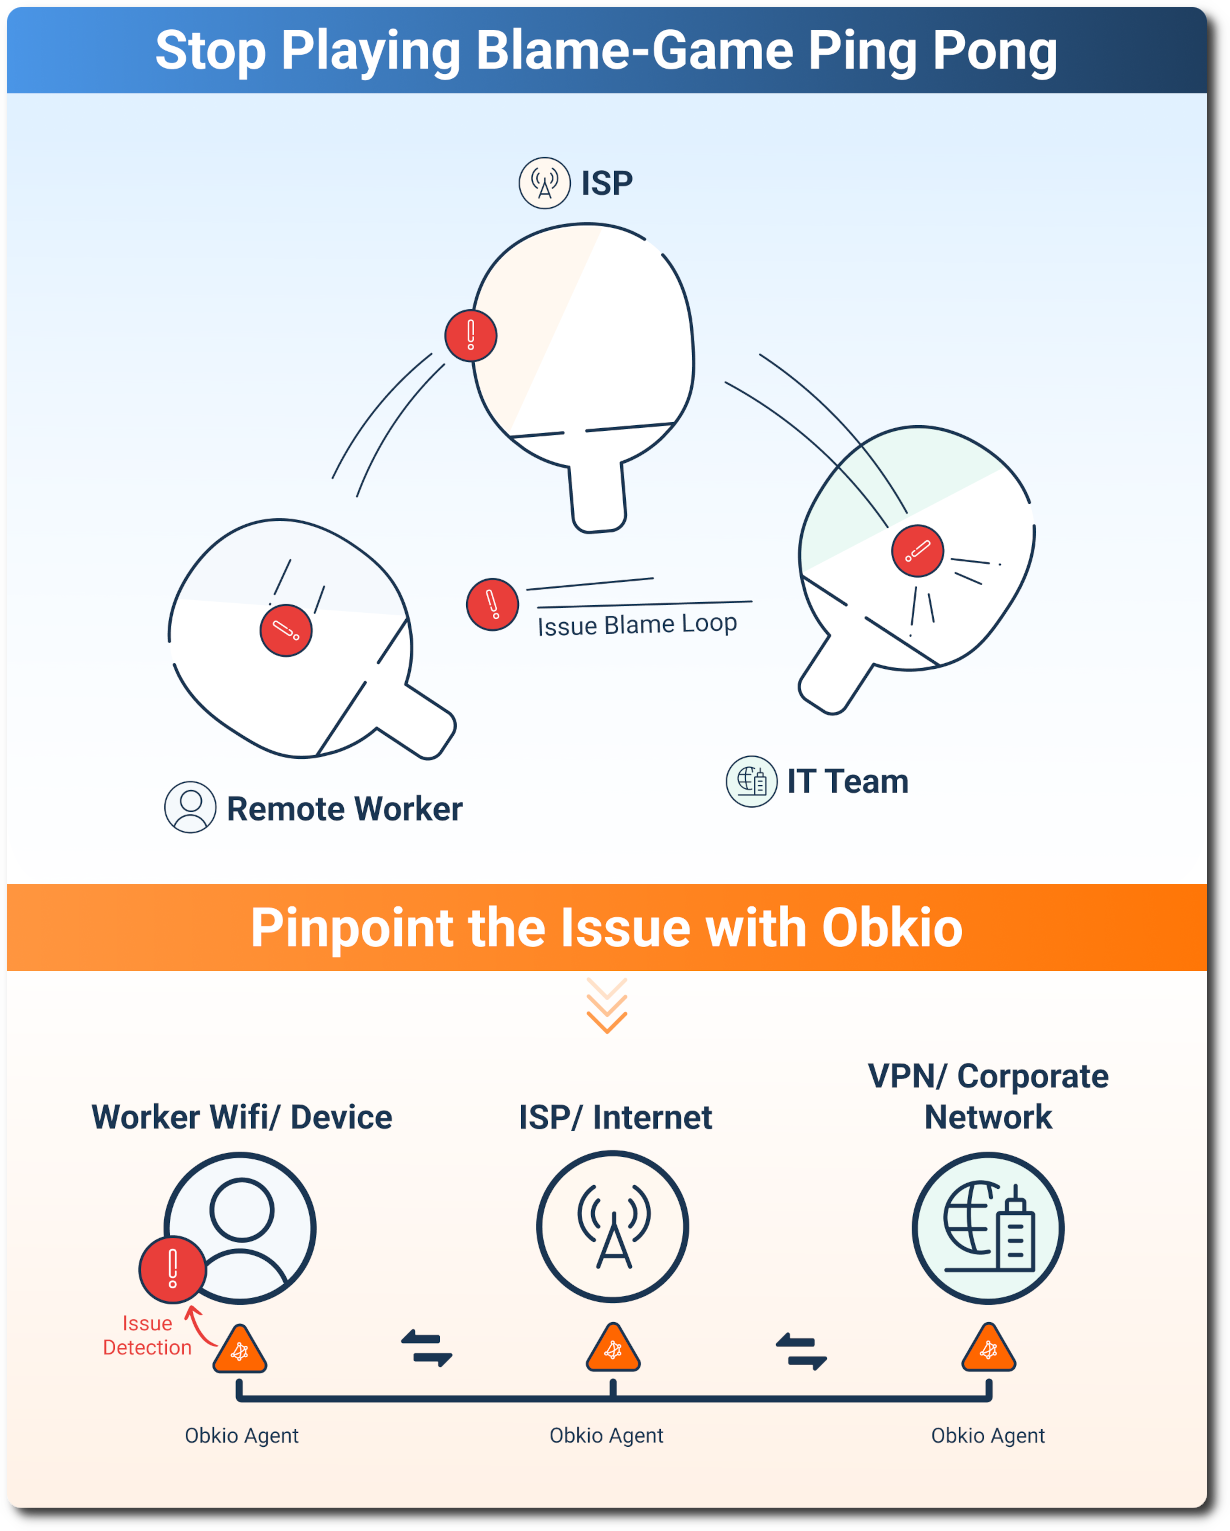
When the issue is within the unmanaged network, you can guide users to fixes: move closer to the router, switch to 5GHz Wi-Fi band, hardwire instead of wireless, close resource-intensive applications, contact their ISP about the last-mile connection.
Problems occurring downstream:
- ISP backbone infrastructure: Issues within the service provider's network, beyond the last mile. Routing problems. Congestion at peering points. Infrastructure failures. You can't fix this, but you can identify it and help users escalate with their ISP.
- Internet routing: Issues with intermediate hops between the user's ISP and your destination. Peering disputes causing suboptimal routing. BGP problems. Packet loss at carrier hand-offs.
- Destination problems: The application, server, or service itself is having issues. Your file server is overloaded. Your VPN concentrator hit capacity. Your SaaS provider is having an outage.
- Cloud provider issues: Problems with AWS, Azure, GCP infrastructure that your applications depend on. Regional outages. Transit provider issues affecting cloud connectivity.
Your monitoring data helps you make this determination quickly. Instead of three days of troubleshooting the wrong layer, you identify the actual source within minutes.
When analyzing performance problems:
1. If latency/packet loss starts at the device (first hop): Local device issue. Check CPU, memory, disk, network driver, local firewall rules.
2. If problems start at the first external hop: Home network or router issue. Check Wi-Fi signal, router health, local network congestion.
3. If problems start at the second or third hop: ISP last-mile connection. The physical link from the home to the ISP's infrastructure is failing.
4. If problems appear midstream in traceroute: ISP backbone or Internet routing issue. Beyond the local connection, somewhere in the provider's infrastructure.
5. If problems only appear at the final hops: Destination issue. Your infrastructure or the application endpoint is having problems.
This systematic approach eliminates guesswork. Your monitoring data tells you which layer is failing.
Real-time monitoring catches current issues. Historical data reveals patterns that predict future problems.
1. Identify recurring problems on specific unmanaged networks: Some remote workers consistently have issues during specific times. Maybe their ISP has peak-hour congestion every evening from 6-9 pm when neighbourhood usage spikes. Obkio's historical data shows these patterns over days and weeks.
2. Spot performance degradation trends before they become critical: Gradual increases in latency over weeks. Slowly increasing packet loss percentages. Bandwidth slowly declining as more devices join the home network. These trends predict failures before they become emergencies. When you see baseline latency creeping from 25ms to 45ms over two months, you know something is changing before it breaks completely.
3. Compare performance during different times of day: Establish baseline performance patterns. Morning performance versus afternoon versus evening. Weekday versus weekend. Business hours versus after-hours. When performance deviates from baseline, you know something changed. If a remote worker normally has 20ms latency mornings and suddenly it's 80ms, investigate even if 80ms isn't objectively "bad", the change indicates a problem.
4. Correlation with network events: Historical data lets you correlate performance issues with other events. Did latency spike right after a router firmware update? Did packet loss start when a new branch office came online? Did problems begin when you migrated to a new ISP? Timeline correlation answers "what changed?" questions that are impossible to answer without historical context.
5. Provide evidence when opening ISP support tickets: Obkio makes it easy to export evidence. Generate reports showing network metrics, moments of network performance degradation, or highlighting specific network issues. Export data to CSV for detailed analysis. Take screenshots of graphs and visual traceroutes showing the exact problems.
Data retention matters. With months of historical data available in Obkio (retention periods depend on your subscription plan), you can look back and understand long-term patterns. That 3-second application slowdown users are complaining about? Historical data shows it started 6 weeks ago and has been gradually worsening.
Now you know this isn't a new problem, it's been building. You can investigate what changed 6 weeks ago rather than troubleshooting yesterday's changes.
Stop the frustrating back-and-forth between remote users and IT teams.
Traditional troubleshooting on unmanaged networks is theatre:
IT team: "Are you experiencing slowness?"
Remote Worker: "Yes, everything is slow."
IT team: "Can you reboot your router?"
Remote Worker: "Okay, I rebooted it."
IT team: "Is it better?"
Remote Worker: "Maybe? I'm not sure."
IT team: "Can you unplug it for 30 seconds and plug it back in?"
Repeat this dance for three days until everyone gives up or the problem mysteriously resolves itself.
With monitoring data from unmanaged networks through Obkio, you skip this entire process.
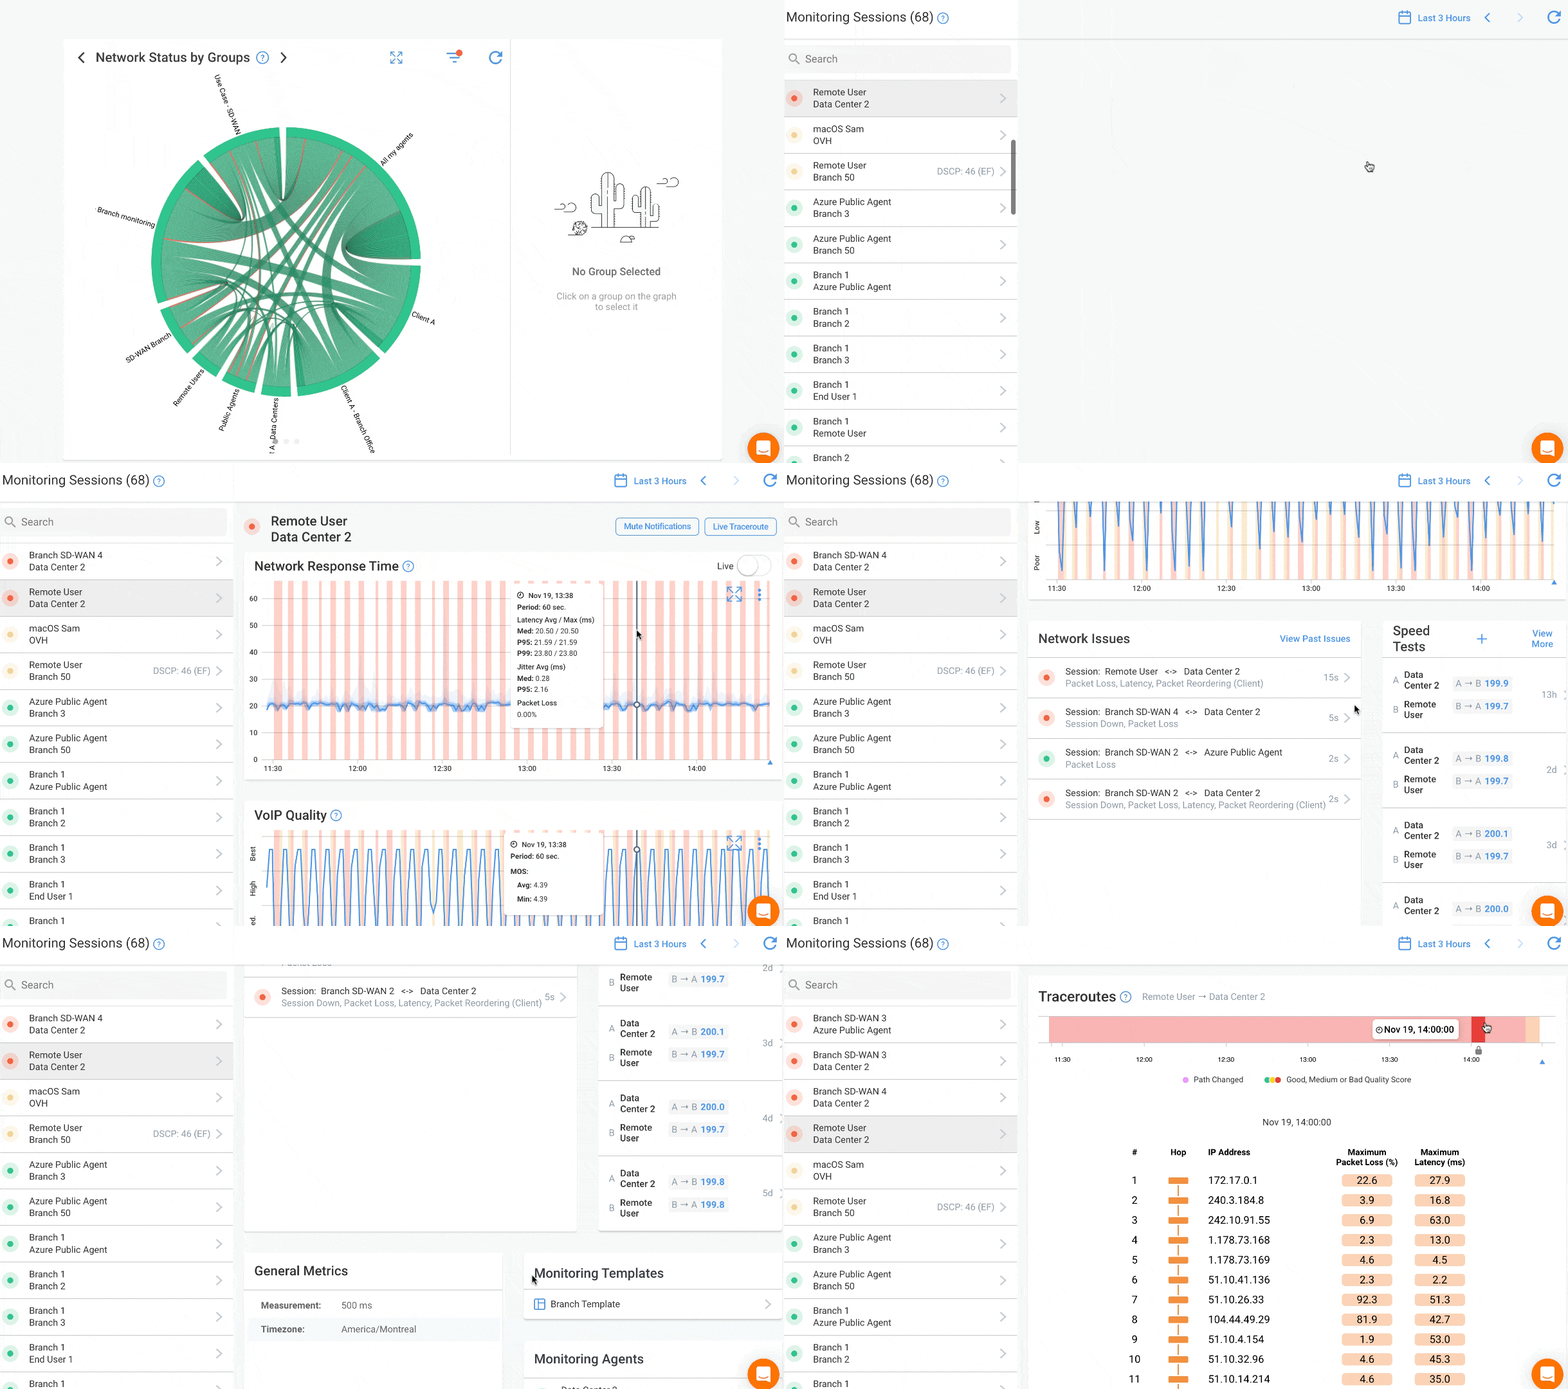
Instead of asking users to describe symptoms, you collect the actual performance data yourself.
Obkio's SNMP device monitoring shows CPU spiking to 100% during video calls. Or network card errors are climbing steadily. Or Wi-Fi signal strength at -75 dBm (terrible). Or memory usage maxing out. You identify the problem without asking the user to interpret anything technical. You can tell them: "Your laptop is running out of memory during calls, close some browser tabs or restart the machine to clear memory."
You present specific performance metrics to the Internet provider: exact timestamps, hop-by-hop analysis, and clear evidence of their infrastructure problems. "Your router at 203.0.113.45 shows consistent packet loss during peak hours, 2pm-5pm EST daily. Here's 14 days of Obkio data proving it, with visual traceroutes showing the exact hop where packets are dropped." ISP support can't dismiss that. They have to escalate to engineering because you've pinpointed their equipment.
You determine if slow performance is the network or the application itself. If Obkio's network metrics are perfect (low latency, no packet loss, good bandwidth) but the application is slow, you know to look at application logs, database performance, server capacity, not routers. This eliminates days of troubleshooting the wrong layer. Conversely, if network metrics are terrible, you stop investigating the application and focus on the network path.
When working with remote users on unmanaged networks, you need to explain technical issues in plain language.
Your monitoring data makes this possible. Instead of technical jargon that confuses users, you can provide clear explanations:
1. Instead of: "We're seeing asymmetric packet loss on the upstream path with jitter exceeding 50ms during peak utilization periods."
- Say this: "Your Internet connection is dropping data when you're uploading files, especially during afternoon hours when your neighbourhood usage is high."
2. Instead of: "The SNR on your DOCSIS connection is below threshold with significant uncorrectable codeword errors."
- Say this: "Your cable Internet signal quality is poor. You should contact your ISP about checking the cable line to your house."
3. Instead of: "We're observing elevated latency at the layer 3 handoff between your ISP's edge and their transit provider."
- Say this: "The slowdown is happening inside your internet provider's network, not in your home. Here's the data to show them when you call support."
Remote users get clear explanations. IT teams stay efficient. Everyone avoids the endless troubleshooting theatre of "maybe try unplugging it again."
1. Start with critical locations: Deploy monitoring to your most important unmanaged networks first. Key remote workers who handle critical functions. Important partner sites your systems depend on. Branch offices with customer-facing staff. Prove value quickly with your most visible users, then scale to the broader organization.
2. Set realistic thresholds: Unmanaged networks won't perform like your enterprise fiber connection. A home broadband connection hitting 30ms latency is normal. Adjust alert thresholds accordingly in your Obkio monitoring templates or you'll drown in false positives. Learn the baseline performance for residential connections, branch office links, and different ISP types, then set thresholds that account for those realities.
3. Document baseline performance: Understand normal performance patterns for each unmanaged network before issues arise. What's typical morning latency? What's normal packet loss (hint: should be near zero, but some budget ISPs consistently show 0.5-1%)? What's average jitter? Baselines let you identify when things change. A 50ms latency spike is alarming if the baseline is 15ms, but normal if the baseline is 45ms.
4. Use monitoring templates for consistency: Rather than configuring each monitoring session individually, create Obkio monitoring templates that automatically set up sessions with appropriate thresholds for different network types. Remote worker template with relaxed thresholds. Branch office template with tighter requirements. Cloud connectivity template focused on specific metrics. Templates ensure consistency and make deployment scalable: add a new agent, and it automatically gets the right monitoring sessions and thresholds.
5. Use data to advocate: When users have ISP problems, your Obkio monitoring data is their ammunition. Help them escalate effectively with concrete evidence. Provide screenshots of visual traceroutes, CSV exports of performance data, and clear summaries of the issue. You're not fixing their ISP, but you're making it possible for them to get it fixed.
6. Regularly report on performance: Share performance summaries with remote workers and management. Use Obkio's reports feature to generate monthly summaries: "Here's how your home connection performed this month, mostly good, but three days of ISP congestion during afternoon hours." It sets expectations and highlights when infrastructure needs attention. Monthly reports also build appreciation for IT's visibility into problems.
7. Leverage ICMP Monitoring for comprehensive monitoring: Beyond agent-to-agent monitoring, use Obkio's Network Destinations to monitor connectivity to critical third-party services your remote workers depend on: SaaS applications, APIs, cloud services. This extends your visibility beyond what you directly control to include the external services your business relies on.

Monitoring unmanaged networks isn't about gaining control, you'll never control those networks. It's about gaining visibility into the infrastructure your organization depends on but doesn't own.
The endpoint-first approach makes this possible. Deploy lightweight agents within unmanaged networks. Collect continuous performance data. Centralize visibility into one dashboard. Configure intelligent alerts. Use visual traceroutes and historical analysis to pinpoint issues. Troubleshoot remotely with real data instead of user descriptions.
Your network extends far beyond your office walls. Your remote workers, branch offices, and partner connections all rely on infrastructure you don't manage. That's not changing.
But you can stop flying blind. You can see what's actually happening. You can identify problems quickly, explain them clearly, and solve them efficiently—even when you don't control the infrastructure.
That's the value of unmanaged network monitoring. Not control. Visibility.
Ready to monitor your unmanaged networks? Deploy Obkio and get visibility into every remote worker, branch office, and third-party connection your organization depends on.

- 14-day free trial of all premium features
- Deploy in just 10 minutes
- Monitor performance in all key network locations
- Measure real-time network metrics
- Identify and troubleshoot live network problems


 Obkio Blog


