Table of Contents
Table of Contents
Whether you're troubleshooting performance issues or aiming for proactive management, measuring CPU usage is a key skill for network administrators. In the world of networking, CPU usage serves as a vital indicator of system health, resource allocation, and potential bottlenecks.
In this comprehensive guide, we delve into the intricacies of measuring CPU usage in networking. From demystifying the significance of CPU metrics to providing practical insights into monitoring tools and techniques, this blog post aims to empower both novice and seasoned network administrators. Let’s dive in!
At the heart of this operational efficiency of all modern networks lies the often-overlooked yet integral metric—CPU usage. The central processing unit (CPU) serves as the brain of a network, executing commands, processing data, and managing resources. Consequently, understanding and measuring CPU usage emerge as critical elements in the pursuit of optimal network performance.
CPU usage serves as a litmus test for the overall health and functionality of a system. By delving into CPU usage statistics, network administrators gain valuable insights into resource utilization, system responsiveness, and potential bottlenecks. It is a key performance indicator that not only reflects the current state of the network but also aids in predicting and preventing issues that may hinder its seamless operation.
As we embark on this exploration, envision CPU usage as the pulse of your network, a rhythmic beat that encapsulates the vigor and vitality of your digital infrastructure. Through diligent measurement and analysis, administrators can uncover inefficiencies, allocate resources judiciously, and fortify the network against potential disruptions.
Let’s first review what this metric actually is - and to do that, we need to understand two things.
The Central Processing Unit (CPU), often referred to as the "brain" of a computer, is a crucial component responsible for executing instructions from computer programs. It performs the fundamental arithmetic, logical, control, and input/output operations specified by these instructions.
CPU usage is a metric that quantifies the percentage of time a computer's central processor is actively engaged in executing tasks.
The CPU usage percentage indicates the proportion of time the processor spends actively performing computations compared to its idle time. This metric is crucial for assessing the workload and efficiency of a computer or a network's central processing unit. It provides valuable insights into the demand placed on the CPU and helps administrators monitor system performance, identify potential issues, and allocate resources optimally.
Monitoring CPU usage is essential for maintaining system health, preventing bottlenecks, and ensuring a responsive and efficient computing environment. Administering tasks such as video editing, running complex applications, or handling numerous concurrent processes can result in increased CPU usage, emphasizing the importance of understanding and managing this metric for overall system performance.
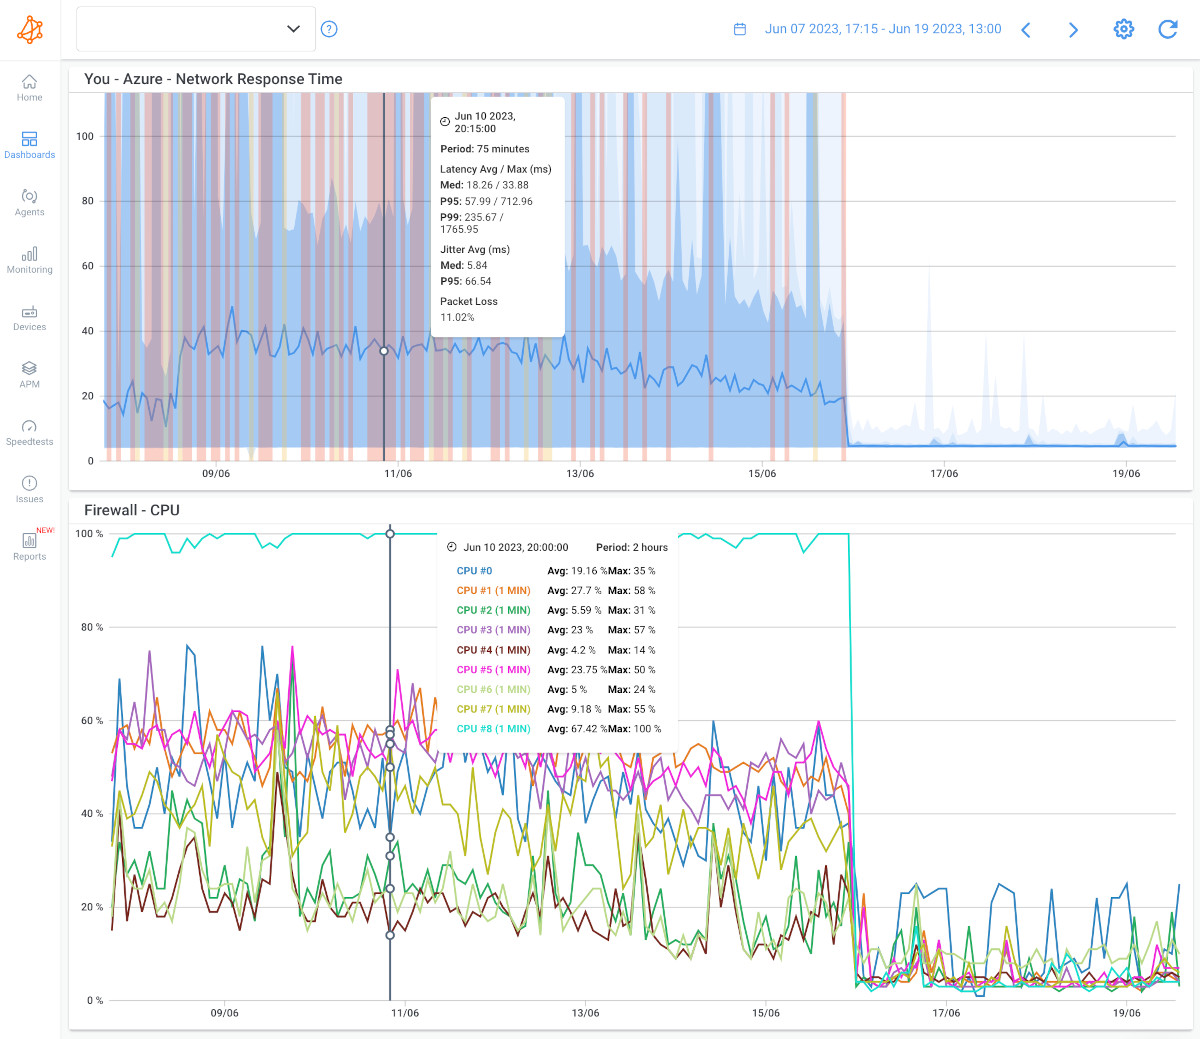

CPU usage is typically measured as a percentage over a specific time interval. It provides a snapshot of how actively the processor is handling tasks during a specific time period.
This percentage is calculated by comparing the amount of time the CPU spends executing instructions to the total time in the given interval.
1. CPU Time:
- User Time: The time the CPU spends executing instructions in user-mode processes. These processes are typically associated with applications and tasks initiated by the user.
- System Time (Kernel Time): The time the CPU spends executing system-level operations, including handling interrupts, managing hardware, and performing other kernel-related tasks.
2. Elapsed Time:
The total time elapsed during the monitoring interval. This is the overall duration for which CPU activity is being measured.
CPU usage is typically calculated as a percentage of time that the CPU spends processing instructions compared to the total time available. The calculation involves monitoring the CPU's activity over a specific interval, usually measured in seconds. Here's how it's calculated:
Collect CPU Time Metrics:
- User Time: The time the CPU spends executing user processes.
- System Time: The time the CPU spends executing system/kernel processes.
- Idle Time: The time the CPU is idle, not executing any processes.
- I/O Wait Time: The time the CPU waits for input/output operations to complete.
- Interrupt Time: The time spent handling hardware interrupts.
The CPU usage percentage is calculated using the formula:

- Total CPU Time: The sum of User Time and System Time during the monitoring interval.
- Total Elapsed Time: The duration of the monitoring interval.
This formula provides the ratio of CPU time to the elapsed time, expressing it as a percentage to represent the portion of time the CPU was actively engaged in processing.
Understanding this calculation is crucial for interpreting CPU usage percentages:
100% CPU Usage: This indicates that the CPU was actively processing instructions for the entire monitoring interval. This could suggest that the CPU is fully utilized and may be a sign of heavy workload or potential resource constraints.
Less than 100% CPU Usage: This indicates that the CPU was not continuously processing instructions during the monitoring interval. This can occur during periods of inactivity or when the system has available processing capacity.
Monitoring CPU usage over different intervals helps capture variations in workload and provides insights into how system resources are utilized during different operational states.
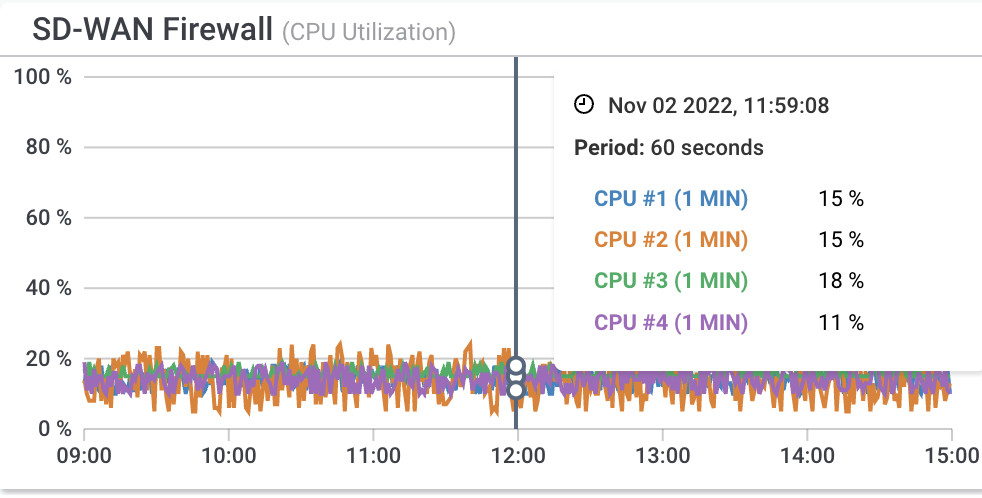
Higher CPU Usage indicates that the CPU is working more intensively, executing a greater number of instructions and processing tasks. This can occur when running resource-intensive applications, multitasking with numerous programs simultaneously, or performing computationally demanding operations.
High CPU usage isn't inherently problematic; it's expected when the system is under heavy load. However, sustained high CPU usage may lead to performance issues, sluggish response times, and, in extreme cases, system instability. Monitoring these spikes in usage is crucial for identifying potential bottlenecks or resource constraints.
Lower CPU Usage suggests that the CPU has available processing capacity during the specified time interval. In such cases, the system is not fully utilizing the processing power, indicating potential room for additional tasks or improved efficiency.
While low CPU usage is generally desirable during periods of system inactivity, consistently low usage when running demanding applications may signify underutilization of available resources. In such instances, it might be possible to optimize the system for better performance or allocate resources more efficiently.

The perception of what constitutes normal or good CPU usage can vary based on factors such as the type of system, its purpose, and the specific tasks it's handling. However, here are some general guidelines:
Idle State: During periods of inactivity, a healthy system should ideally have low CPU usage, often close to 0%. This indicates that the CPU has ample capacity and is not under significant load.
Regular Operation: For a system handling routine tasks and applications, average CPU usage may range from 10% to 50%. This indicates that the CPU is actively processing tasks without being overly burdened.
Peak Usage: During periods of increased demand, such as opening multiple applications or running resource-intensive tasks, CPU usage may temporarily spike to higher percentages (e.g., 70% to 100%). This is acceptable as long as the system returns to lower levels during normal operation.
Server Environments: Servers, especially those handling critical applications or services, may have consistently higher CPU usage. Levels around 70% to 80% can be normal in such scenarios, as long as there is room for occasional peaks without causing performance degradation.
It's crucial to note that what is considered normal can vary based on the specific hardware, operating system, and applications in use. Additionally, certain tasks or applications may naturally lead to higher CPU usage.
For an accurate assessment of normal CPU usage for a specific system, it's beneficial to establish a baseline during typical operation and monitor for deviations.

Alright, let's talk shop in the world of networks. Do you know that feeling when your computer seems to be working a bit too hard? That's the CPU flexing its muscles. Now, imagine you could not only peek behind the scenes but also figure out what's making it break a sweat. Enter network monitoring tools – your backstage pass to the drama that unfolds in the digital universe.
Measuring CPU usage with network monitoring tools is a crucial aspect of maintaining and optimizing the performance of networked systems. Network monitoring tools offer insights into various aspects of system health, and CPU usage is a key metric in this regard.
First, you need to choose the right CPU monitoring tool to help you measure CPU usage, but always metric performance as a whole.
Agent-Based Tools: Some network monitoring tools require the installation of agents on individual devices to collect detailed performance metrics, including CPU usage. These agents continuously gather data and send it to a centralized Agent-based network monitoring system.
Agentless Tools: Other tools operate in an agentless fashion, leveraging protocols like SNMP (Simple Network Management Protocol) to remotely gather information from network devices, including CPU usage.
Then there are tools that do both - enter Obkio’s Network Monitoring tool.

Obkio is an active, end-to-end Network Monitoring solution that continuously monitors network, device and application performance to proactively identify and troubleshoot performance issues. Obkio uses Monitoring Agents deployed in key network locations that exchange synthetic traffic to measure performance from the end-user perspective.
Additionally, Obkio also monitors device performance and metrics, like CPU usage, using SNMP monitoring.
Ready to dive in?

Before monitoring network devices and measuring CPU usage, you need to deploy at least one Monitoring Agent in your network.
Monitoring Agents are a unique software developed by Obkio to monitor network performance in key network locations (data centers, branch offices, clouds etc.). They continuously exchange synthetic traffic in your network to measure performance using key network metrics, and identify performance issues.
Monitoring Agents communicate with your network device to measure performance, so we always recommend deploying an Agent closest to the device you want to monitor. Additionally, you can also deploy Agents in all your network locations to monitor end-to-end network performance.
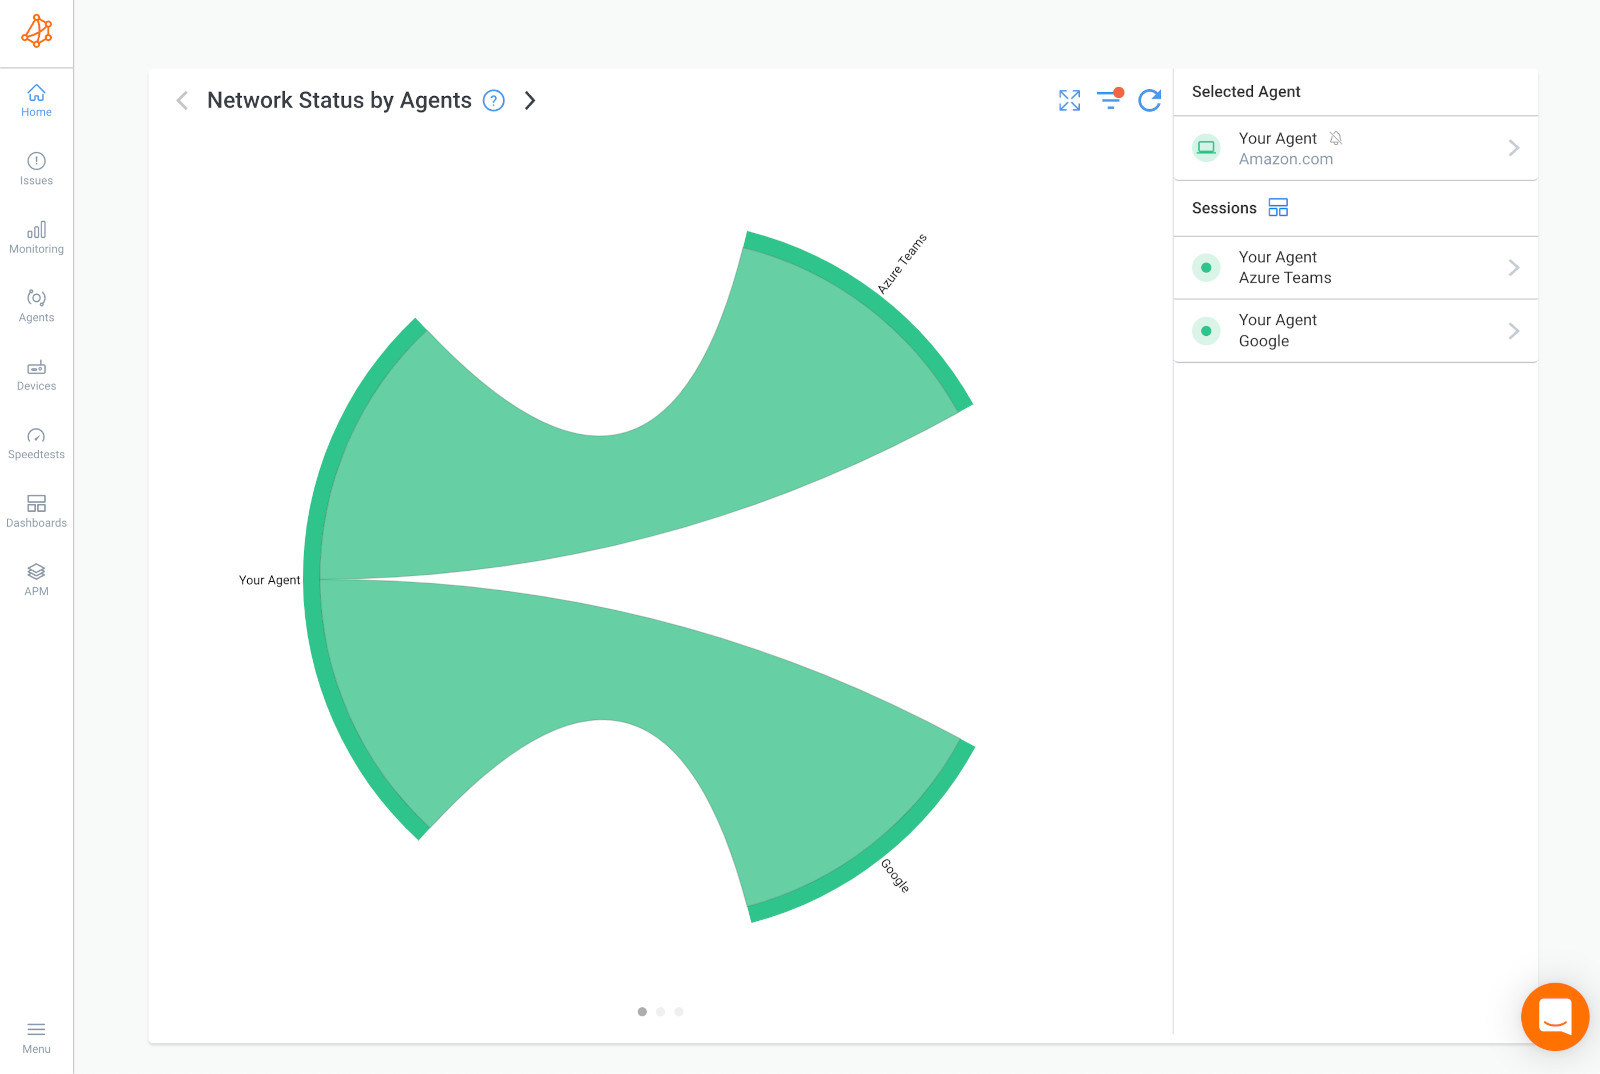
Obkio’s Network Device Monitoring feature is a fast and easy solution to get detailed information about the health of your core network devices. It uses SNMP polling to monitor network devices and measure performance metrics like CPU usage.
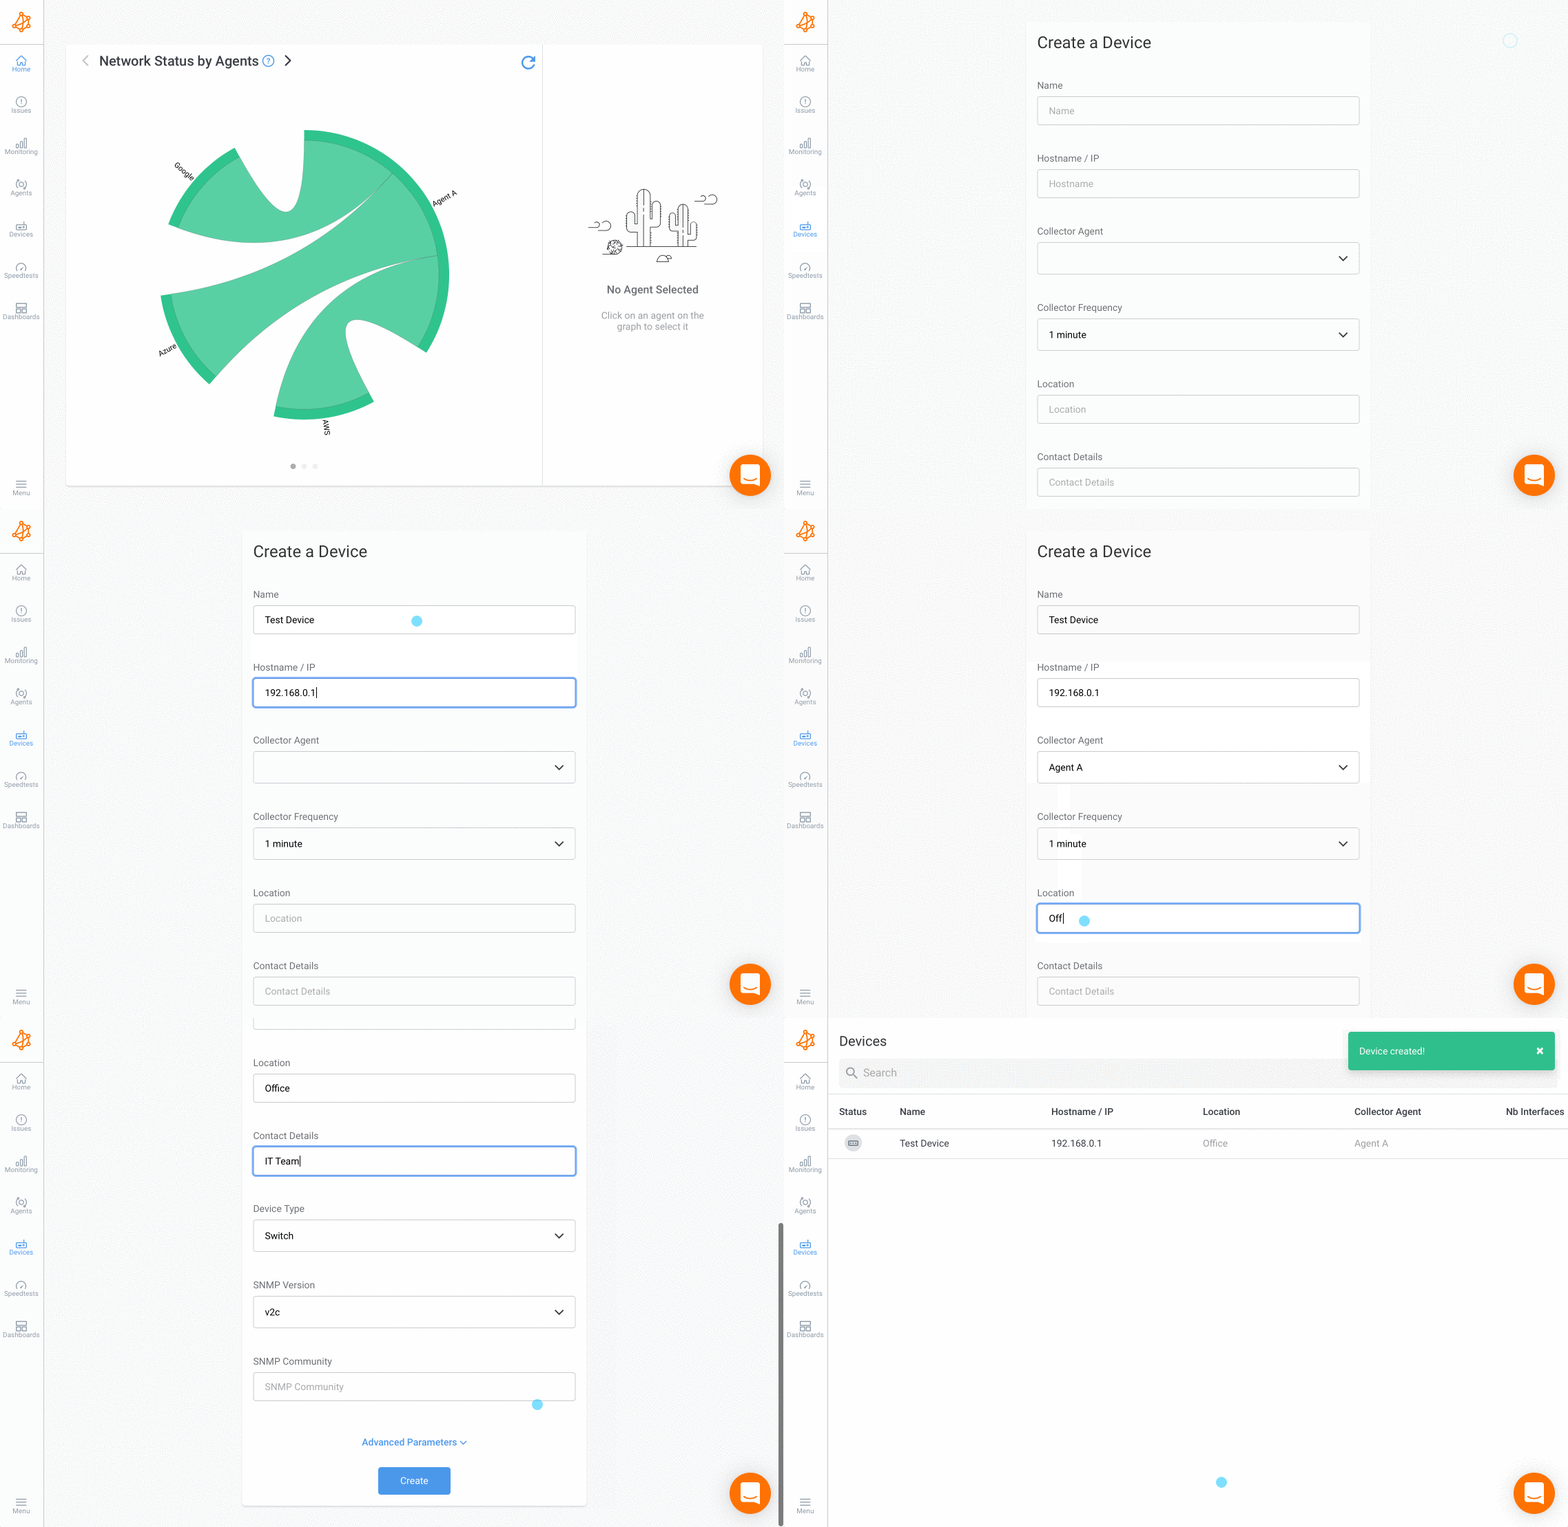
Once you’ve installed your monitoring agents, you can then start monitoring your network devices using SNMP by adding the devices inside the Obkio App. No technical expertise in SNMP and OID Detection is required. All you have to do is add your network devices and Obkio’s network device monitoring feature adapts to any type of equipment.
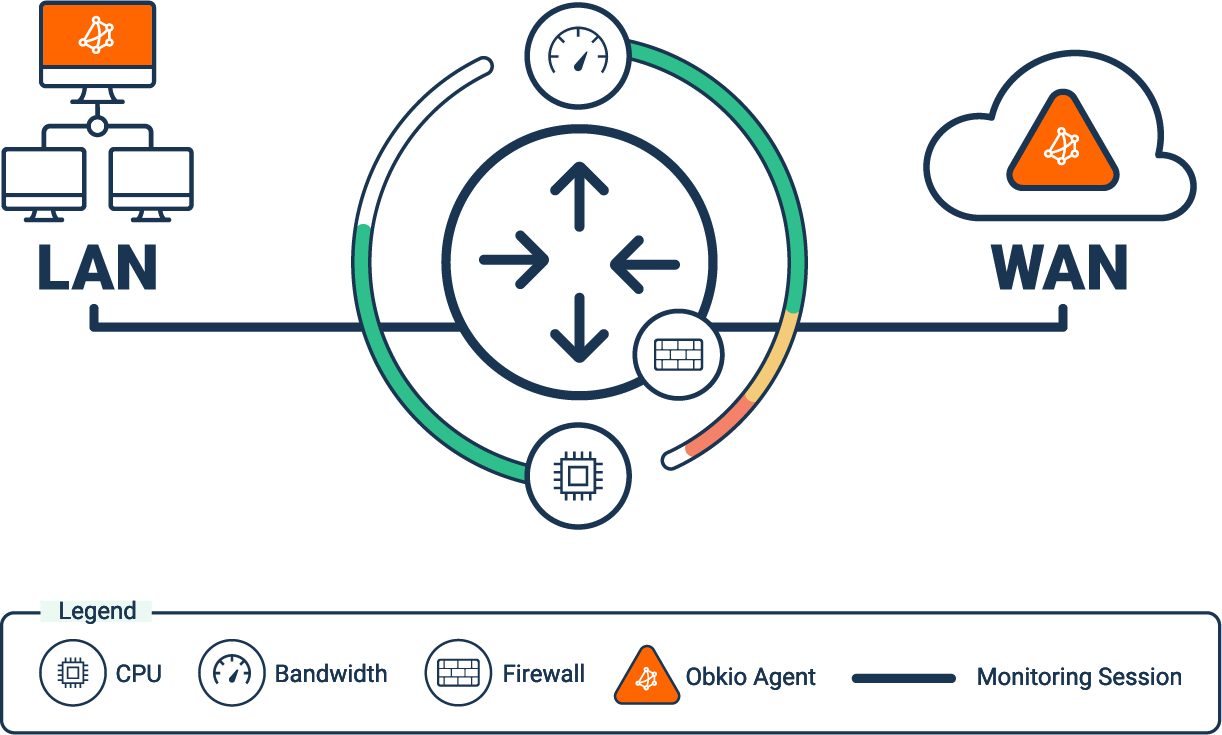
Here's a list of network devices for which monitoring CPU usage is typically essential:
- Routers: Routers play a central role in directing traffic between different networks. Monitoring CPU usage helps ensure efficient packet forwarding and routing.
- Switches: Switches manage local network traffic efficiently. Monitoring CPU usage is vital to identify potential bottlenecks and ensure smooth data transfer within the network.
- Firewalls: Firewalls inspect and filter network traffic. Monitoring the CPU usage on firewalls helps ensure that security policies are enforced without compromising network performance.
- Load Balancers: Load balancers distribute network traffic across multiple servers to optimize resource usage. Monitoring CPU usage ensures the load balancer itself doesn't become a performance bottleneck.
- Wireless Access Points (WAPs): WAPs manage wireless network connections. Monitoring CPU usage is crucial to ensure seamless connectivity and identify potential issues in wireless networks.
- Servers: Servers, including those hosting applications, databases, and other services, are critical components. Monitoring CPU usage on servers is essential for optimizing resource allocation and ensuring responsive applications.
- Network Attached Storage (NAS) Devices: NAS devices store and manage network data. Monitoring CPU usage helps ensure efficient data access and identifies potential performance issues.
- VoIP Gateways: Voice over Internet Protocol (VoIP) gateways handle voice communication over the network. Monitoring CPU usage ensures smooth voice transmission and call quality.
- Network Appliances (e.g., WAN Optimizers): Specialized network appliances often handle specific optimization tasks. Monitoring CPU usage on these devices ensures they can effectively perform their designated functions.
- Security Appliances (e.g., Intrusion Prevention Systems): Security appliances inspect and protect the network against threats. Monitoring CPU usage ensures these devices can handle the computational demands of security protocols.
- Virtual Machines (VMs): In virtualized environments, monitoring the CPU usage of virtual machines is crucial for efficient resource allocation, ensuring that VMs receive the necessary processing power.
- Edge Devices (e.g., Edge Routers, IoT Gateways): Devices at the edge of the network are critical for connecting local networks to external networks or the internet. Monitoring CPU usage ensures these devices can handle local and external traffic efficiently.
Obkio uses SNMP polling within its Network Device Monitoring features to monitor network devices and network device metrics.
To enable this, just ensure that the network device you want to monitor supports SNMP. Obkio supports all versions of SNMP (v1, v2c and v3) and of course, read-only access is needed.
Once you’ve added your network devices, Obkio's Network Performance Monitoring tool sends an SNMP request to a device, asking it to provide information about a specific metric, such as CPU usage, bandwidth utilization, or uptime. The device receives the request, responds with the requested information, and sends it back to Obkio.
Obkio uses Ultra-Fast Polling (every 30 seconds) to provide results that are far more precise than the traditional software polling, which occurs every 5 minutes. This frequency more accurately detects short bursts of traffic (packet bursts) or CPU usage that affect network performance and identifies the root cause of the performance issue.
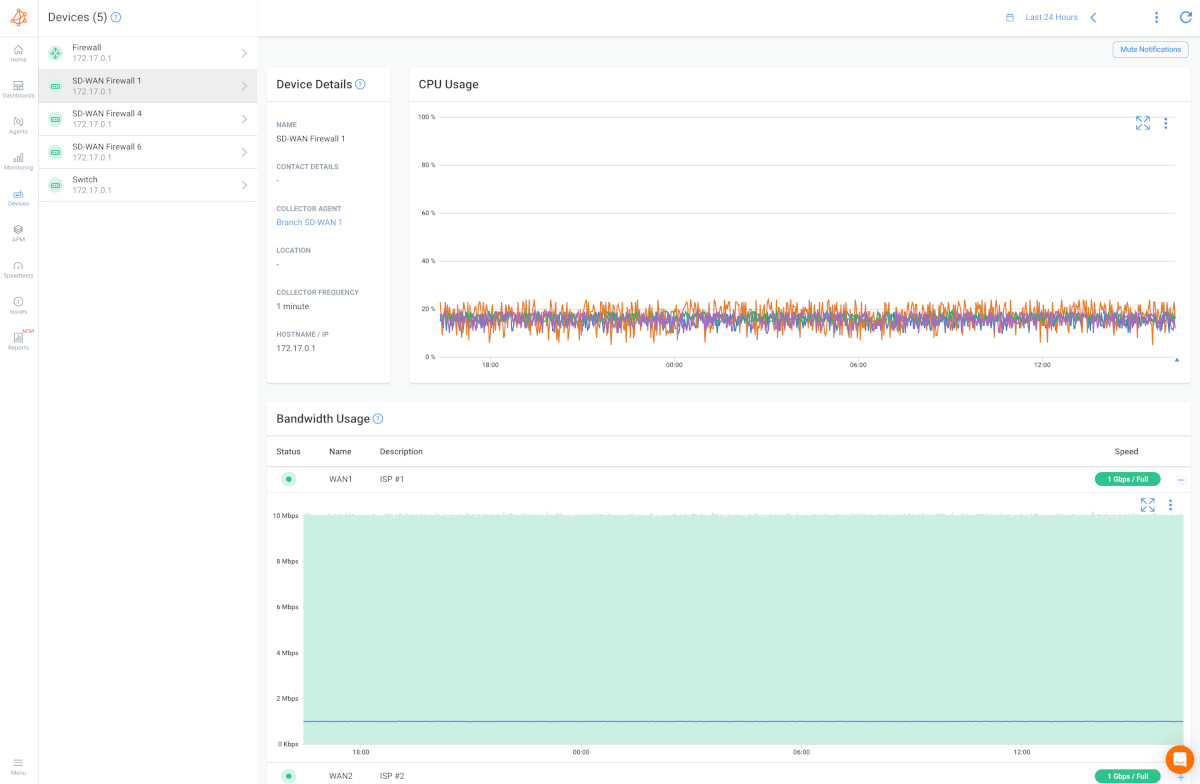
Once you’ve deployed network, device and CPU monitoring with Obkio, Obkio’s Monitoring Agents will continuously monitor performance to provide real-time insights into CPU usage across devices. This real-time visibility is invaluable for promptly identifying spikes in CPU usage, potential performance bottlenecks, or abnormal behaviour.

Historical CPU Data:
Obkio also stores historical data, allowing administrators to analyze trends and patterns in CPU usage over time. This historical perspective is crucial for identifying long-term performance issues, planning resource upgrades, and implementing proactive measures.
Threshold Alerts:
Obkio allows you to set threshold values for CPU usage. When CPU usage surpasses predefined thresholds, the tools can trigger network monitoring alerts, notifying administrators of potential issues. This proactive approach helps in addressing problems before they impact overall system performance.
Integration with Performance Dashboards:
Obkio offers customizable dashboards that integrate various performance metrics, including CPU usage. These dashboards provide a centralized view of the entire network's health, making it easier for administrators to identify and address issues promptly.
By leveraging network monitoring tools, like Obkio, network admins gain a comprehensive understanding of CPU usage within their networked environments. This proactive and data-driven approach empowers them to make informed decisions, enhance system performance, and ensure the reliability of their network infrastructure.
Alright, let's talk about why keeping an eye on CPU usage is more than just a tech checklist item. Picture it as getting a feel for the heartbeat of your network. Now that we know how to measure CPU usage, we'll chat about the real reasons why measuring CPU usage is the secret sauce for network administrators.
Proactive Performance Management: Monitoring CPU usage provides network administrators with real-time insights into the performance of network devices. Proactively managing CPU utilization allows for early detection of potential issues and the implementation of preemptive measures.
System Health and Stability: CPU usage is a crucial indicator of system health. High or sustained CPU usage may signify performance bottlenecks, potential hardware issues, or inefficient resource allocation. By measuring CPU usage, administrators can maintain system stability and prevent unexpected network outages.
Resource Allocation Efficiency: CPU usage metrics offer valuable information about how network resources are allocated. This insight is instrumental in optimizing resource distribution, ensuring that critical applications receive the necessary processing power while avoiding resource contention.
Early Detection of Performance Bottlenecks: High CPU usage can be a symptom of performance bottlenecks, where network devices struggle to handle the incoming workload. Measuring CPU usage aids in the early detection of bottlenecks, allowing administrators to address issues before they impact overall network performance.
Capacity Planning and Scalability: CPU measurement is essential for capacity planning, enabling administrators to assess current usage patterns and predict future resource requirements. This information is crucial for scalability planning, ensuring that the network can accommodate growth without sacrificing performance.
Optimizing Application Performance: CPU usage metrics provide insights into the performance of applications running on the network. By understanding how much CPU resources each application consumes, administrators can optimize configurations, prioritize critical applications, and enhance overall application performance.
Energy Efficiency and Cost Savings: Measuring CPU usage contributes to energy efficiency by identifying opportunities to optimize resource utilization. By ensuring that CPUs are neither overutilized or underutilized, organizations can achieve cost savings through improved energy efficiency and reduced hardware requirements.
Enhanced Troubleshooting: When performance issues arise, CPU measurement serves as a valuable diagnostic tool. Administrators can analyze CPU usage patterns during specific events or incidents, helping pinpoint the root cause of problems and streamline the troubleshooting process.
Maintaining Quality of Service (QoS): In networks where Quality of Service (QoS) is crucial, monitoring CPU usage becomes vital. By ensuring that devices enforcing QoS policies have sufficient CPU resources, administrators can uphold service levels and prevent degradation in the quality of network services.
Preventing Downtime and Service Disruptions: Timely measurement of CPU usage aids in preventing downtime and service disruptions. By identifying and addressing issues that could lead to high CPU usage, administrators can maintain continuous service availability and a seamless user experience.
In essence, measuring CPU usage in networking is not just about tracking numbers—it's a strategic approach to maintaining the health, efficiency, and reliability of the entire network ecosystem. The impact of CPU measurement extends beyond immediate performance concerns, influencing long-term planning, scalability, and the overall resilience of network infrastructure.
A major part of CPU monitoring is measuring key network metrics that affect CPU usage. If you’re measuring CPU usage using a monitoring tool, like Obkio, your network monitoring solution will continuously measure these metrics for you. But it’s still important to understand what they mean.
So, now we’ll venture into the core of CPU monitoring, exploring key metrics that go beyond the surface-level percentage of usage. From the dance between user and kernel time to the moments of reprieve during idle periods, each metric tells a unique story about the health and efficiency of a networked system.
- CPU Usage:
CPU usage represents the percentage of time the CPU spends actively executing instructions. It indicates how much of the CPU's processing power is currently in use. High CPU usage may suggest that the system is under heavy load, potentially leading to performance issues. Monitoring trends in CPU usage helps in capacity planning and resource allocation.
- Idle Time:
Idle time refers to the percentage of time the CPU remains idle, not actively executing instructions. High idle time suggests that the CPU has available processing capacity. While some idle time is normal, excessively high idle time might indicate underutilization of resources.
- User Time and Kernel Time:
User time is the percentage of CPU time spent executing user-mode processes (applications). Kernel Time is the percentage of CPU time spent executing system-level operations in kernel mode.
Monitoring user and kernel time helps distinguish between application-specific CPU usage and system-level processes. An imbalance may indicate issues with either applications or system-level tasks.
- Wait Time:
Wait time refers to the percentage of time the CPU spends waiting for I/O operations to complete (e.g., reading from or writing to disk). High wait time may indicate that the CPU is spending a significant amount of time waiting for data, potentially due to slow I/O operations.
- Interrupt Time:
Interrupt time refers to the percentage of CPU time spent servicing hardware interrupts. Monitoring interrupt time helps identify the impact of hardware events on CPU performance. Sudden spikes may indicate hardware issues.
- Context Switches:
Context Switches is the number of times the CPU switches between different tasks or processes. High context switch rates may indicate a system handling multiple tasks or processes, potentially impacting performance. It's crucial to distinguish between normal multitasking and excessive context switches.
Understanding the key metrics around CPU usage goes far beyond mere definitions; its focus lies in interpreting the language of CPU metrics to extract practical insights. Now that we know what metrics you should be looking at, let’s dive into the hidden meaning embedded within these metrics, discerning indicators of bottlenecks, imbalances, and potential issues that might exist beneath the surface.
- Balancing Act: A well-balanced system maintains an equilibrium between user time, kernel time, and idle time. Significant imbalances might indicate issues with application efficiency or system-level tasks.
- Identifying Bottlenecks: Spikes in CPU usage, especially sustained high usage, may indicate network bottlenecks. Identifying these network bottlenecks helps in optimizing resource allocation and troubleshooting performance issues.
- Proactive Resource Management: By understanding CPU metrics, administrators can proactively manage resources. This includes optimizing applications, redistributing workloads, and ensuring that critical processes receive adequate CPU resources.
- Capacity Planning: Trend analysis of CPU metrics aids in capacity planning. It helps administrators anticipate future resource requirements and ensures the network is prepared for growing workloads.
- Troubleshooting Performance Issues: When network performance issues arise, interpreting CPU metrics helps narrow down the root cause. Whether it's an application hogging resources or a system-level task causing disruptions, understanding CPU metrics is key to effective network troubleshooting.
In essence, understanding CPU metrics goes beyond looking at a single percentage. It involves dissecting the various components of CPU activity to gain nuanced insights into system health and performance. This knowledge equips administrators to make informed decisions, optimize resource usage, and maintain a resilient and efficient computing environment.

Understanding how a computer's or server's CPU operates involves deciphering two key metrics: CPU usage and CPU load. CPU usage and CPU load are related concepts, but they represent different aspects of a computer's or server's performance.
So, we of course already covered this, but for the sake of comparison: CPU usage refers to the percentage of time the CPU is actively executing processes or tasks. It indicates how much of the CPU's processing capacity is currently in use.
- Measurement: CPU usage is typically measured as a percentage, where 100% indicates that the CPU is fully utilized, and 0% means that it is idle.
- Usage Types: CPU usage can be broken down into categories such as user processes, system processes, and idle time, providing insights into how different types of tasks are utilizing the CPU.
CPU load, often expressed as a load average, represents the average number of processes in a runnable or waiting state over a specific time period. It reflects the system's workload and the demand for CPU resources.
- Measurement: CPU load is measured in numerical values, where a load average of 1.0 means the system's CPU capacity is fully utilized. Values greater than 1.0 indicate a workload that exceeds the CPU's capacity.
- Load Types:
- 1-minute Load Average: Represents the average load over the last minute.
- 5-minute Load Average: Represents the average load over the last five minutes.
- 15-minute Load Average: Represents the average load over the last 15 minutes.
CPU usage focuses on how much of the CPU's processing power is actively in use by tasks. It provides a percentage-based view of immediate activity.
CPU load, on the other hand, focuses on the demand placed on the system over time. It provides an averaged representation of the system's workload.
In summary, CPU usage measures the current activity of the CPU, while CPU load provides a more averaged and historical perspective on the demand placed on the system's CPU resources. Both metrics are valuable for assessing and managing system performance.
Analyzing the historical cadence of CPU usage unveils patterns, rhythms, and subtleties that are crucial for proactive management. From recognizing seasonal shifts to discerning growth trajectories, administrators gain a panoramic view of their network's evolution.
Let’s dive in!
- Consistency and Variation:
Long-term CPU trend analysis involves observing patterns of consistency or variation in CPU usage over extended periods. Identifying consistent trends provides insights into the typical workload, while variations may signal changes in demand or application behaviour.
- Seasonal Patterns:
Some networks experience seasonal fluctuations in usage. Analyzing long-term CPU trends helps administrators anticipate and prepare for these patterns, ensuring that resources are appropriately allocated during peak times.
- Growth and Scalability:
Monitoring CPU trends over time helps assess the growth trajectory of network activity. This information is critical for scalability planning, enabling administrators to anticipate resource needs as the network expands.
Discover the power of SNMP Polling for robust network monitoring. Learn best practices & leverage SNMP monitoring tools like Obkio’s Network Monitoring tool.
Learn more

But it's not just about hindsight; interpreting long-term CPU trends serves as an early warning system. By discerning anomalies, spikes, and deviations, administrators can anticipate potential issues, optimize resource allocation, and steer their networks with precision.
- Performance Baselines:
Establishing performance baselines through long-term trend analysis provides a benchmark for normal CPU behavior. Deviations from these network baselines can indicate potential issues or changes in the network environment.
- Spikes and Anomalies:
Identifying sudden spikes or anomalies in CPU usage is crucial. These deviations may signal unexpected events, such as a sudden increase in network traffic, a malfunctioning application, or a security incident that requires immediate attention.
- Capacity Planning:
Trend analysis assists in capacity planning by revealing how CPU usage evolves over time. It helps administrators predict future resource requirements, preventing situations where the network might face performance bottlenecks due to insufficient resources.
- Early Warning Signs:
Long-term trend analysis serves as an early warning system. Recognizing gradual shifts in CPU usage patterns allows administrators to address issues before they escalate, promoting proactive management and minimizing the impact on network performance.
- Resource Optimization:
Understanding long-term CPU trends aids in optimizing resource allocation. It helps administrators identify underutilized resources or areas where additional network capacity may be needed, ensuring a balanced and efficient network
- Adaptive Strategies:
Recognizing patterns in CPU trends enables the development of adaptive strategies. For example, if certain applications consistently demand more resources during specific periods, administrators can adjust configurations or allocate additional resources accordingly.
In essence, interpreting CPU trends is akin to reading the pulse of a network over time. It goes beyond immediate concerns, providing a strategic view of how CPU resources are utilized and what the future may hold. Administrators armed with insights from long-term trend analysis can proactively manage their networks, making informed decisions to ensure sustained performance and mitigate potential issues before they impact users.
CPU spikes are like unexpected plot twists—sudden, impactful, and sometimes a bit mysterious. When you’re looking into CPU usage, you’re bound to notice spikes at some point or anything.
CPU usage spikes refer to sudden and temporary increases in the percentage of CPU utilization on a system. These spikes can occur for various reasons and are a common phenomenon in computing environments. Understanding the causes of CPU spikes is crucial for troubleshooting performance issues and ensuring the overall health of a system.
- High Workload or Resource-Intensive Tasks:
Running resource-intensive applications or tasks, especially those that require substantial computational power, can lead to sudden spikes in CPU usage.
Solution: Identify and optimize resource-heavy applications, consider spreading the workload across multiple cores, or schedule resource-intensive tasks during periods of lower activity.
- Background Processes and Updates:
Background processes, automatic updates, or maintenance tasks initiated by the operating system or applications can lead to temporary spikes in CPU usage.
Solution: Configure update settings to occur during off-peak hours, prioritize critical tasks, and review background processes to minimize their impact.
- Malware or Security Scans:
Malware infections or security scans by antivirus software can cause a sudden increase in CPU usage as the system scans for, detects, and removes threats.
Solution: Ensure that antivirus software is up to date, schedule regular scans during periods of lower activity, and perform thorough malware scans.
- Insufficient System Resources:
Inadequate CPU power, memory, or other hardware limitations can lead to spikes when the system struggles to meet the demands of running applications.
Solution: Upgrade hardware components, optimize system configurations, and monitor resource usage to prevent resource contention.
- Interrupts and Hardware Events:
Hardware events, interrupts, or I/O operations can temporarily increase CPU usage, especially when the system interacts with peripherals or handles external events.
Solution: Monitor hardware performance, ensure drivers are up to date, and address any hardware-related issues that may contribute to spikes.
- Application Bugs or Issues:
Bugs, glitches, or inefficient coding in applications can lead to unexpected CPU spikes during certain operations.
Solution: Keep applications updated, work with developers to address coding issues, and regularly test applications for performance.
- Network Traffic and Communication:
High network traffic or communication between networked devices can result in increased CPU usage, especially in situations like data transfers or network-intensive tasks.
Solution: Optimize network configurations, implement traffic management strategies, and ensure efficient routing to minimize the impact on CPU.
- Virtualization Challenges:
In virtualized environments, improper resource allocation, or contention among virtual machines can lead to CPU spikes.
Solution: Optimize virtual machine configurations, ensure proper resource allocation, and monitor virtualized environments for performance bottlenecks.
Understanding the specific context and triggers for CPU spikes is essential for effective troubleshooting. Monitoring tools, performance logs, and analysis of concurrent events can help pinpoint the root cause and guide appropriate remedial actions.

High CPU usage can occur in various components of a network, often depending on the specific circumstances, demands, and issues the network is facing. Let’s briefly review common areas within a network where high CPU usage may manifest:
- Routers: Inefficient routing protocols, network topology changes, or high packet processing demands can lead to high CPU usage on routers.
- Switches: Broadcast storms, VLAN misconfigurations, or excessive traffic can result in high CPU usage on network switches, particularly in broadcast domains.
- Firewalls: Deep packet inspection, content filtering, or the enforcement of complex security policies can cause high CPU usage on firewalls, especially during periods of intense network activity.
- Load Balancers: Uneven distribution of traffic, sudden spikes in requests, or misconfigurations can lead to high CPU usage on load balancers responsible for distributing network traffic across multiple servers.
- Servers: Intensive computational tasks, inefficient applications, or high user loads can cause high CPU usage on individual servers within the network.
- Security Appliances: Continuous scanning for malware, intrusion detection, or other security-related tasks can contribute to high CPU usage on security appliances.
- Network Monitoring Devices: Intensive packet capture, deep packet inspection, or real-time analysis by network monitoring tools can lead to high CPU usage on monitoring devices.
- Wireless Access Points: A high number of connected devices, excessive broadcast traffic, or interference issues can result in high CPU usage on wireless access points.
- Virtualized Environments: In virtualized setups, resource contention, misconfigurations, or an inadequate allocation of virtual resources can cause high CPU usage on virtual machines or hypervisors.
- Edge Devices: Network edge devices, such as edge routers or gateways, may experience high CPU usage during periods of intense data transfer, security processing, or when managing a large number of connected devices.
- VoIP Gateways: Processing and handling a high volume of voice traffic, especially during peak call times, can lead to high CPU usage on VoIP gateways.
- Network Attached Storage (NAS) Devices: Concurrent access, file transfers, or intensive I/O operations can contribute to high CPU usage on NAS devices.
It's important to note that the specific scenarios leading to high CPU usage can vary widely based on network design, the nature of applications, security policies, and the overall network architecture. Regular monitoring, analysis, and targeted troubleshooting are essential for identifying and addressing high CPU usage in a network effectively.
Alright, let's get into the nitty-gritty of dealing with CPU usage challenges in network management.
We're going to talk about the everyday issues – from applications being a bit too greedy with resources to network complications that can throw your system off balance. It's not rocket science, but it's crucial for keeping things running smoothly.
We'll explore how to spot these challenges and, more importantly, how to tackle them. Whether it's a hardware hiccup or some messy code causing trouble, we've got practical solutions to get your network back on track.
Common CPU usage issues or bottlenecks can arise from various factors, impacting the performance and responsiveness of a system. Here are some common scenarios that lead to CPU-related problems:
- High CPU Usage by Specific Applications:
Certain applications may consume excessive CPU resources, leading to overall system slowdown.
Identify resource-intensive applications through monitoring tools and optimize or update these applications. Consider limiting the CPU affinity for such applications.
- Insufficient Hardware Resources:
Inadequate CPU power, memory, or other hardware limitations can result in bottlenecks.
Upgrade hardware components, such as installing a more powerful CPU, adding more RAM, or optimizing the storage subsystem.
- Network-Related CPU Bottlenecks:
Network-related factors, such as excessive data transfer demands or network congestion can lead to high CPU usage and CPU bottlenecks.
To troubleshoot, optimize network configurations, implement load balancing, and ensure efficient routing to alleviate network-related CPU bottlenecks.
- Unoptimized Code and Applications:
Inefficient or poorly optimized code in applications can lead to increased CPU usage.
To try and mitigate this, work with developers to optimize code, improve algorithms, and reduce unnecessary computations. Regularly update and patch applications for improved performance.
- Malware or Security Threats:
Malware, viruses, or security threats can cause abnormal CPU usage as they attempt to execute malicious operations.
To avoid this, use robust antivirus and anti-malware software, regularly update security patches, and conduct thorough security audits to detect and remove any threats.
- Background Processes and Services:
Unnecessary background processes or services running on the system can consume CPU resources.
Identify and disable unnecessary background processes. Review and optimize startup programs and services to reduce CPU overhead.
- Operating System Issues:
Operating system-related issues, such as outdated drivers, bugs, or compatibility issues, can lead to increased CPU usage.
Keep the operating system and drivers up to date, and regularly apply patches and updates to address any known issues.
- Inefficient Virtualization:
In virtualized environments, improper allocation of resources to virtual machines or insufficient host resources can lead to CPU bottlenecks.
To mitigate this, optimize virtual machine configurations, ensure proper resource allocation, and consider scaling up resources if needed.
- Configuration and Resource Contention:
Improper system configurations, resource contention, or conflicts between applications can lead to CPU performance issues.
Review and adjust system configurations, resolve resource contention issues, and ensure that applications are compatible and well-behaved in the shared environment.
Inadequate Cooling and Overheating:
Inadequate cooling solutions can lead to CPU overheating, causing performance degradation.
Ensure proper cooling solutions, clean cooling components regularly, and monitor system temperatures to prevent thermal throttling and overheating.
Learn how to identify network bottlenecks, troubleshoot performance issues, and optimize your network with Obkio's Network Performance Monitoring tool.
Learn more

Addressing CPU usage issues involves a combination of monitoring, optimization, and troubleshooting strategies. Identifying the specific cause of high CPU usage is crucial for implementing effective solutions and maintaining a responsive and efficient system.
How do you do that? Let’s get into it:
1. Network Performance Monitoring:
Continuous monitoring of CPU performance metrics is essential for detecting bottlenecks. Unusual spikes in CPU usage or consistently high levels may indicate a bottleneck that requires investigation.
NPM tools like Obkio are essential for this strategy! Following the implementation steps we outlined earlier, you can deploy end-to-end Network Performance Monitoring to continuously measure network performance metrics and identify CPU usage spikes, as well as what’s causing them anywhere in your network.
An NPM tool is the most effective and efficient way to proactively identify CPU usage, providing you with all the data you need to troubleshoot.

2. Application Profiling:
Profiling applications to understand their resource demands helps pinpoint if specific applications are the cause of CPU bottlenecks. This involves analyzing how much CPU time each application consumes and identifying resource-intensive processes.
3. Network Traffic Analysis:
Examining network traffic can reveal if high CPU usage is a result of increased data transfer demands. Addressing network-related issues, such as congestion or inefficient routing, can alleviate CPU bottlenecks.
4. Load Balancing:
Distributing network traffic evenly across servers or resources through load balancing can prevent individual components from becoming overloaded, mitigating CPU bottlenecks.
Lowering CPU usage is crucial for maintaining optimal system performance and preventing issues such as slowdowns and bottlenecks. Here are several tips for optimizing CPU usage:
Identify Resource-Hungry Applications: Use system monitoring tools to identify applications consuming high CPU resources. Pinpointing resource-intensive applications is the first step in optimization. Address or replace these applications as needed.
Optimize Application Code: Collaborate with developers to optimize code, improve algorithms, and reduce unnecessary computations. Well-optimized code reduces CPU workload, improving overall application and system performance.
Utilize Multithreading and Parallel Processing: Leverage multithreading and parallel processing to distribute tasks across multiple CPU cores. Parallelizing tasks allows the system to handle multiple operations simultaneously, optimizing CPU usage.
Implement Load Balancing: Distribute network traffic evenly across servers or resources using load balancing. Load balancing prevents individual components from becoming overloaded, ensuring a more balanced distribution of CPU resources.
Manage Background Processes: Control and prioritize background processes to minimize their impact on CPU resources. Background processes, especially those running continuously, can contribute to sustained CPU usage. Prioritize critical processes and minimize unnecessary ones.
Monitor and Manage Network Traffic: Optimize network configurations, implement traffic management strategies, and ensure efficient routing. Efficient network management reduces the strain on the CPU caused by excessive data transfer demands.
Consider Hardware Upgrades: Evaluate the possibility of hardware upgrades, such as installing a more powerful CPU or increasing RAM. Upgrading hardware components enhances the system's processing capabilities, potentially lowering CPU usage.
Review Power Plans and Energy Settings: Adjust power plans and energy settings to balance performance and power consumption. Optimizing power settings can influence CPU behaviour, especially in mobile devices where power management is crucial.
Implement Caching Mechanisms: Use caching mechanisms to reduce the need for repetitive computations. Caching stores frequently accessed data, reducing the CPU load by minimizing the need for recalculations.
Regularly Monitor and Analyze Performance: Use performance monitoring tools to regularly analyze CPU usage and identify patterns. Regular monitoring provides insights into CPU behaviour, facilitating proactive optimization and troubleshooting.
By incorporating these tips into your system management strategy, you can effectively lower CPU usage, enhance system responsiveness, and create a more efficient computing environment.
As network architects, administrators, and engineers strive to keep digital landscapes thriving, understanding the specific scenarios that lead to elevated CPU demands is paramount.
This section ventures into real-life examples, dissecting the circumstances that can cause spikes in CPU usage. As network pros, these are circumstances you should be keeping an eye out for when you’re analyzing and assessing your business’ network infrastructure.
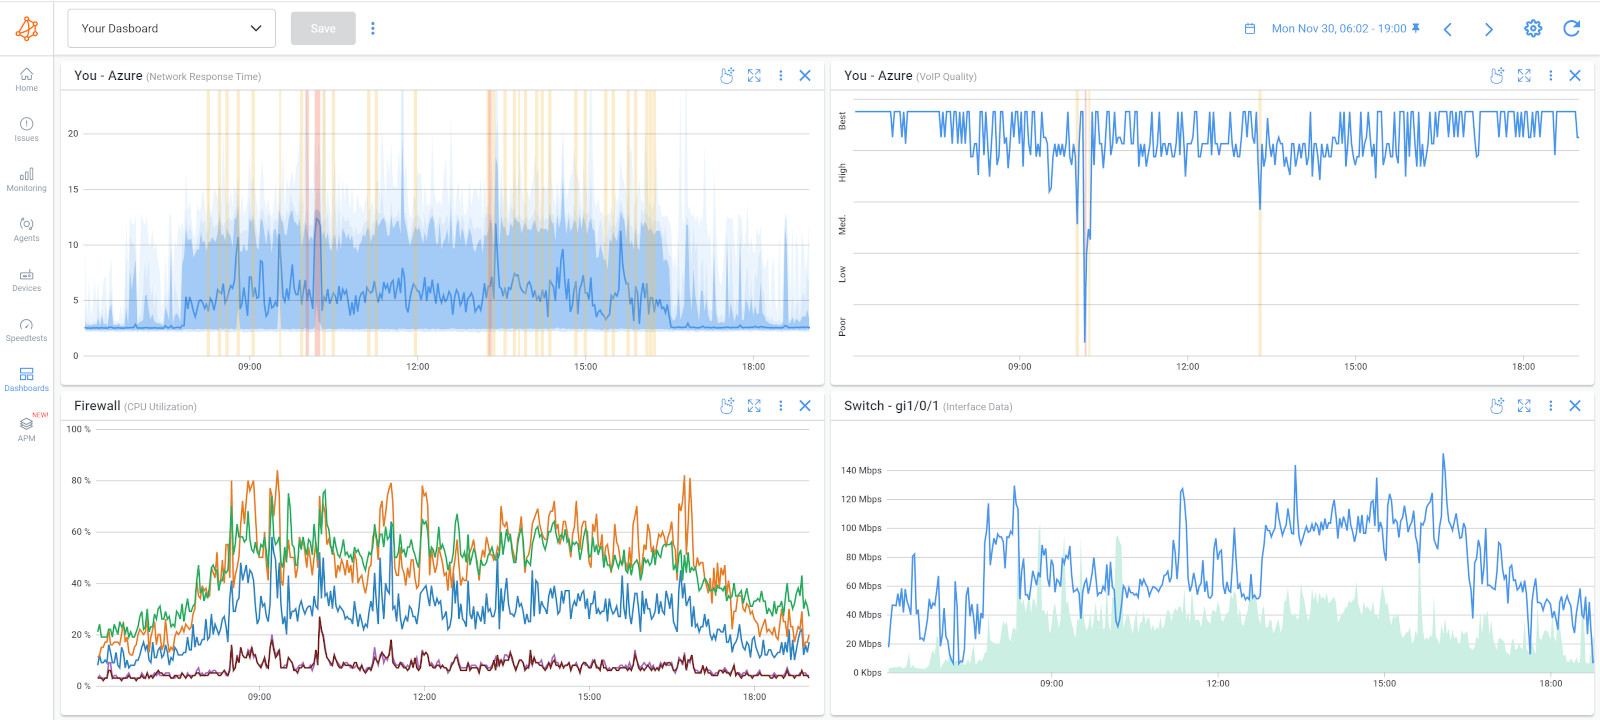
Sudden increases in network traffic, such as during peak hours or due to unexpected demand, can lead to high CPU usage as routers and switches process and forward a large volume of data.
Example: An online retail platform experiences a sudden surge in traffic during a flash sale event, causing increased CPU usage on the load balancers, routers, and web servers as they handle the elevated number of requests.
DDoS attacks overwhelm network resources with a flood of traffic, causing routers, firewalls, and other security devices to work intensively, resulting in high CPU usage.
Example: A website becomes the target of a DDoS attack, leading to a massive influx of traffic from botnets. This overwhelms the network infrastructure, causing routers, firewalls, and intrusion prevention systems to work overtime, resulting in high CPU usage.
Infected devices within the network can generate excessive network traffic or launch attacks, leading to increased CPU usage on network security appliances as they attempt to identify and mitigate threats.
Example: A computer within the network is infected with malware that spreads laterally, generating additional network traffic. Security appliances, such as firewalls and intrusion detection systems, experience high CPU usage as they inspect and mitigate the threat.
Inefficient routing protocols or network topology changes can cause routers to recalculate routes frequently, consuming significant CPU resources.
Example: A misconfiguration in the Border Gateway Protocol (BGP) leads to frequent route or network flapping, causing routers to continually recalculate routes. This results in increased CPU usage on the routers as they adapt to the changing network topology.
Network devices continuously broadcasting a large volume of packets can create broadcast storms, saturating the network and causing routers and switches to handle excessive broadcast traffic, resulting in high CPU usage.
Example: A malfunctioning network device continuously sends broadcast messages, creating a broadcast storm. Switches and routers in the affected segment experience high CPU usage as they process and forward the excessive broadcast traffic.
Insufficient CPU power, memory, or other hardware limitations in networking devices can lead to bottlenecks and high CPU usage when trying to handle the demands of network traffic.
Example: An organization experiences network slowdowns during periods of high user activity. Upgrading routers and switches with insufficient resources, such as increasing RAM or CPU power, alleviates the bottleneck and reduces CPU usage.
Misconfigurations or intense demands on QoS policies can lead to high CPU usage on devices responsible for enforcing QoS rules, such as routers or firewalls.
Example: Misconfigured QoS policies prioritize all traffic equally, leading to inefficient use of network resources. Routers enforcing QoS rules may experience high CPU usage as they attempt to manage the traffic according to the misconfigured policies.
Stringent security policies, especially when inspecting and filtering deep packet content, can cause high CPU usage on firewalls as they analyze each packet for compliance.
Example: A firewall configured with rigorous content filtering policies experiences high CPU usage during peak hours when users access multimedia-rich content. Adjusting the policies or upgrading the firewall hardware helps manage the increased load.
Improper VLAN configurations or excessive VLAN activity can strain network devices, leading to increased CPU usage.
Example: An organization's VLAN configuration is not optimized, leading to unnecessary broadcast traffic between VLANs. Routers and switches handling VLAN communications experience high CPU usage due to the inefficiencies in the VLAN setup.
Software bugs or glitches in network operating systems or applications can result in inefficient resource utilization and cause high CPU usage.
Example: A network device undergoes a software update with an unintended bug. The bug causes the device to inefficiently process certain types of packets, resulting in high CPU usage until the bug is addressed in a subsequent update.
Failures or malfunctions in network devices, such as a sudden surge in errors or packet drops, can lead to increased CPU usage as devices handle the increased load caused by the failure.
Example: A sudden failure in a core network switch leads to an increase in CPU usage on the redundant switch as it takes on the additional load, while other devices in the network may experience disruptions.
Intensive network monitoring or packet capture activities, especially with high sampling rates, can contribute to increased CPU usage on monitoring devices.
Example: Network administrators deploy a high-frequency packet capture solution for forensic analysis. The constant capture of detailed packet information places a significant load on the capturing device, leading to spikes in CPU usage during capture sessions.
Security appliances performing intensive virus scans or content inspection may experience spikes in CPU usage when processing files or data packets.
Example: An enterprise security appliance performs deep content inspection on incoming and outgoing emails. During a scheduled virus scan, the appliance experiences spikes in CPU usage as it analyzes attachments and checks for malware.
Identifying the specific circumstances leading to high CPU usage is crucial for network administrators to implement targeted solutions, optimize configurations, and ensure the overall health and resilience of the network infrastructure.
Explore the world of network administration with insights on network load testing, network load balancing, and the role of NPM. Optimize your network today!
Learn more

Why is maximizing CPU usage important? Well, think of it this way: when your CPU is working efficiently and handling tasks effectively, everything on your computer runs faster and smoother. Applications open quickly, games run without lag, and you can multitask without slowing down.
In this section, we'll explore ways to make sure your CPU is working at its best. From using smart techniques like multithreading to optimizing how programs use the CPU, we'll show you how to get the most out of your computer's brainpower.
1. Multithreading and Parallel Processing: Utilize multithreading and parallel processing techniques in applications to divide tasks into smaller sub-tasks that can run concurrently on multiple CPU cores or threads. This approach can significantly increase CPU usage by distributing workload across available CPU resources.
2. Optimize Task Scheduling: Use efficient task scheduling algorithms and techniques to prioritize and schedule tasks based on their priority, resource requirements, and dependencies. This helps in ensuring that CPU resources are allocated effectively and tasks are processed in a timely manner.
3. Increase Workload: Increase the workload on the system by running multiple applications or processes simultaneously. This can be achieved by launching additional applications, services, or background tasks that require CPU resources. However, ensure that the system remains stable and responsive under increased workload.
4. Optimize Algorithms and Code: Optimize algorithms and code in applications to reduce CPU overhead, improve execution efficiency, and minimize unnecessary computations. Use profiling tools to identify performance bottlenecks and optimize critical code paths for better CPU utilization.
5. Use Performance Monitoring Tools: Monitor system performance using tools like Task Manager (Windows), Activity Monitor (macOS), or top/htop (Linux) to track CPU usage and identify processes consuming significant CPU resources. Analyze resource-intensive processes and consider optimizing or optimizing their resource usage.
6. Enable Hyper-Threading (if available): If your CPU supports hyper-threading technology, enable it in the system BIOS/UEFI settings. Hyper-threading allows a single physical CPU core to execute multiple threads simultaneously, improving overall CPU utilization and performance.
7. Optimize System Configuration: Ensure that the system configuration is optimized for performance, including appropriate CPU, memory, and storage resources. Adjust system settings, power management options, and BIOS/UEFI settings to maximize CPU performance and responsiveness.
8. Monitor and Manage Resource Contention: Monitor resource contention and conflicts that may affect CPU usage, such as excessive context switching, memory bottlenecks, or I/O delays. Implement strategies to mitigate resource contention and ensure smooth operation under varying workload conditions.
By implementing these strategies, you can maximize CPU usage and improve system performance, efficiency, and responsiveness across various workloads and applications.
CPU time refers to the amount of time that a central processing unit (CPU) spends processing instructions for a specific task or process. It is a measure of the actual time the CPU devotes to executing code and performing computations on behalf of a program or system.
There are different types of CPU time that are commonly tracked:
User CPU Time: This is the time the CPU spends executing user-space processes, which are programs or tasks initiated by users or applications. User CPU time includes executing application code, handling user inputs, and performing computations related to user-initiated activities.
System CPU Time: System CPU time, also known as kernel CPU time, refers to the time the CPU spends executing system-level processes or kernel operations. These processes manage system resources, handle hardware interactions, and perform essential operating system functions such as memory management, I/O operations, and scheduling tasks.
Idle CPU Time: Idle CPU time represents the duration during which the CPU is not actively processing any tasks. This occurs when there are no tasks or processes requiring CPU attention, and the CPU remains idle until a new task is scheduled.
I/O Wait Time: I/O (Input/Output) wait time is the time the CPU spends waiting for input/output operations to complete, such as reading from or writing to storage devices like hard drives or SSDs. During I/O wait time, the CPU may be idle or perform other tasks that do not require significant processing.
Interrupt Time: Interrupt time refers to the time the CPU spends handling hardware interrupts, which are signals generated by hardware devices to request CPU attention. Interrupts can include signals from devices like network adapters, storage controllers, and input devices (e.g., keyboard, mouse). Handling interrupts involves temporarily suspending the current task to address the device's request.
CPU time is a critical metric used in performance monitoring and analysis to assess the workload and efficiency of CPU utilization. By tracking CPU time for different types of activities, administrators and developers can identify performance bottlenecks, optimize resource allocation, and improve overall system responsiveness and efficiency.
And there you have it, our journey through the twists and turns of measuring CPU usage in your network. It's not just about numbers on a screen; it's about steering your ship through the ever-changing currents of network performance.
We've discovered how monitoring CPU usage isn't just a task; it's your network's heartbeat. It tells you when it's running smoothly, when there might be a hiccup, and how to optimize for the journey ahead.
But, here's the real secret sauce—proactive monitoring. That's where Obkio's Network Monitoring tool becomes your first mate. It's not just about numbers; it's about understanding the nuances of your network's performance.

Ready to set sail? Don't let the waters of high CPU usage throw you off course. Measure, optimize, and navigate your network with the precision of a seasoned captain. Obkio is your trusted shipmate for the voyage.
- 14-day free trial of all premium features
- Deploy in just 10 minutes
- Monitor performance in all key network locations
- Measure real-time network metrics
- Identify and troubleshoot live network problems


 Obkio Blog


