Table of Contents
Table of Contents
When it comes to running a reliable IT infrastructure, network devices are at the center stage. They sit quietly in the background (routing packets, securing traffic, and keeping teams connected) until something goes wrong. The truth is, without them, nothing works.
Every network device has a specific role: some connect users, some protect data, others balance traffic or bridge different protocols. Together, they form the backbone of modern business operations, making sure people can access applications, communicate, and stay productive.
But as any network admin knows, it’s not enough to just know what these devices are. You need to understand how they work, the risks when they fail, and most importantly, how to keep an eye on their health before issues turn into outages. That’s where monitoring comes in, since it gives you visibility into performance, reliability, and security so you’re not left guessing when the network slows down or breaks.
This article is written for network admins, engineers, and system pros who want to sharpen their toolkit. We’ll look at the 10 most common network devices, break down how they work, and explain why monitoring them is critical to keeping your infrastructure resilient and your users happy.
Network devices are hardware components that enable devices to communicate and share resources on a computer network. They manage the flow of data, direct traffic, provide connectivity, and ensure the security and efficiency of network operations.

In practice, this means network devices handle core functions like:
- Connectivity: Linking end-user devices (PCs, smartphones, IoT) to local and wide area networks.
- Traffic management: Using rules, tables, and protocols to decide where data packets should go.
- Security: Filtering, inspecting, and protecting traffic against unauthorized access or malicious activity.
- Optimization: Making sure bandwidth and resources are used efficiently to keep applications running smoothly.
It’s also useful to distinguish between two types of devices:
- End-user devices (like laptops or phones): These consume network services but don’t manage traffic.
- Infrastructure devices (routers, switches, firewalls, access points, etc.): These form the backbone of the network, making sure everything stays connected, fast, and secure.

Together, these devices form the nervous system of your business IT infrastructure. Without them, data would never reach its destination, applications would stall, and business operations would suffer.
Setting up your network devices is only half the job, keeping them healthy is where the real work begins. A router, switch, or firewall may look fine one minute and then start dropping packets the next. Without proper monitoring, you’re left reacting to complaints instead of preventing problems.
This is where network device monitoring comes in. Using tools and protocols like SNMP (Simple Network Management Protocol), admins can collect performance metrics, track device health, and spot issues before they impact users. (We’ll dive deeper into SNMP later in this article.)
Unlock the secrets to network device monitoring! From routers to switches, discover insights to monitor core network devices with tools, tips & techniques.
Learn more

1. Performance: Detect bandwidth hogs, CPU spikes, and interface errors that can slow the network down.
2. Reliability: Spot failing hardware or overloaded links early, before they bring down services.
3. Security: Monitor for unusual traffic patterns or configuration changes that might signal an attack.
4. Optimization: Analyze usage trends to plan capacity, balance loads, and scale infrastructure efficiently.
5. Compliance: Provide audit trails, logs, and reporting for IT governance or regulatory requirements.
In short, monitoring isn’t just about uptime, it’s about having visibility and control. A well-monitored network gives admins confidence that devices are doing their jobs and users are getting the seamless experience they expect.
Your routers, switches, firewalls, and other critical devices keep your business running. But without proper visibility, issues can go unnoticed until they cause downtime.
Obkio’s SNMP Device Monitoring makes it simple to track the health and performance of all your network devices in real-time. Obkio collects key SNMP metrics like CPU, memory, bandwidth, and interface errors — and then correlates that data with active network performance monitoring (like latency, packet loss, and jitter) to get to the real root cause of network problems.

With Obkio, you get:
Seamless SNMP Monitoring: Monitor the health of routers, switches, firewalls, and more.
Performance Correlation: Combine device data with network performance metrics for deeper insights.
Real-Time Alerts: Detect outages, bottlenecks, and abnormal behavior before they impact users.
Visual Dashboards: Understand device health and performance trends with clear graphs and reports.
Quick Deployment: Lightweight agents and a cloud-based platform for fast, hassle-free setup.
With Obkio, you don’t just see symptoms — you uncover the root cause of network and device issues, so you can resolve them faster and keep your network reliable.
Start your free trial of Obkio today and take control of your network devices and performance!

Routers are the traffic directors of a network. They connect different networks together, most often your internal LAN to the outside world (the Internet), and make sure data packets find the right path.

Routers use routing tables and protocols like OSPF (Open Shortest Path First) or BGP (Border Gateway Protocol) to determine the most efficient path for data to travel. They also perform NAT (Network Address Translation), converting private IP addresses into public ones so internal devices can access the internet securely.
Think of a router as both a GPS and a translator: it not only decides where packets should go, but also makes sure they can be understood on the other side.
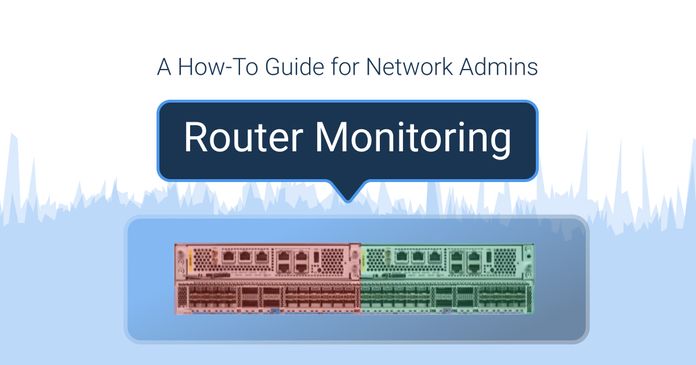
Master router monitoring for Network Admins! Learn how to monitor router performance, detect faults, and optimize WAN connectivity using SNMP device monitoring.
Learn more

If a router fails, users instantly lose access to external networks. Even if it doesn’t fully crash, misconfigurations, high CPU load, or saturated links can cause packet loss, latency spikes, or outages that are just as painful. Since routers are the gateway to everything outside the LAN, they’re often the first point users blame when “the internet is down.”
What to Monitor
When monitoring routers, keep a close eye on:
- CPU and memory usage – to spot overloads before they cause performance drops.
- Interface status and errors – identify failing ports, drops, or flaps.
- Routing table changes – unexpected shifts can signal misconfigurations or malicious activity.
- Latency and packet loss – direct indicators of network performance issues.
- Bandwidth utilization – track saturation, bottlenecks, and capacity planning.

A healthy router equals a healthy network. By keeping tabs on these metrics, admins can prevent small issues from snowballing into full-blown outages.
Switches are the connectors of your LAN. They link multiple devices (servers, workstations, printers, VoIP phones) into a single local area network and manage how data flows between them.

Operating mainly at Layer 2 (Data Link Layer), switches forward frames based on MAC addresses. Instead of blasting traffic to every device (like legacy hubs used to), a switch intelligently directs data only to the intended destination port.
Some advanced switches can also work at Layer 3, handling limited routing tasks (such as inter-VLAN routing). In enterprise networks, this is common for segmenting traffic between different departments or functions.
If a switch has problems, the impact is immediate: bottlenecks, broadcast storms, VLAN misconfigurations, or even complete breakdowns in internal communication. Since they carry nearly all internal traffic, monitoring network switches ensures your LAN stays fast, reliable, and free from hidden issues.
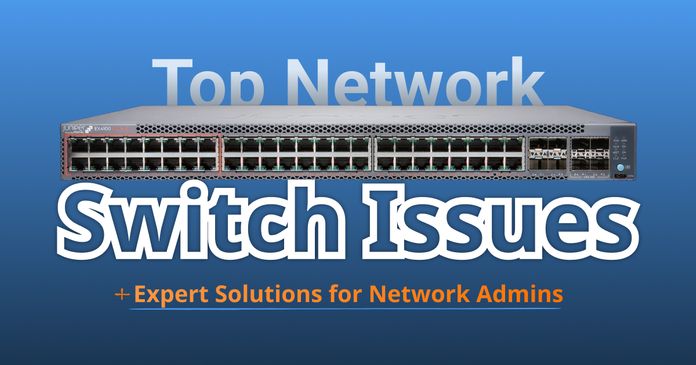
Learn how to spot, troubleshoot, and fix common network switch issues, from slow connections to VLAN errors, and keep your network running smoothly.
Learn more

What to Monitor
When monitoring switches, pay attention to:
- Port status (up/down): A downed port may mean a disconnected device or a hardware failure.
- Packet errors / dropped frames: Indicate faulty cables, interference, or overloaded ports.
- Per-port bandwidth usage: Detect bandwidth hogs or abnormal traffic patterns.
- VLAN configurations: Ensure segmentation is correct and consistent.
- Switch CPU/memory: Overloaded switches can lead to dropped connections and degraded performance.
In short, switches are the circulatory system of your LAN. Monitoring them helps admins prevent slowdowns, keep traffic flowing smoothly, and ensure the network core stays stable.
Firewalls are the security guards of your network. They sit between your internal network and external traffic (like the internet) and decide what gets in, what gets out, and what gets blocked.

Firewalls operate across multiple OSI layers, from Layer 3 (Network Layer) to Layer 7 (Application Layer). At the simplest level, they use ACLs (Access Control Lists) to allow or deny traffic based on IP addresses, ports, or protocols.
More advanced firewalls perform stateful inspection (tracking the state of active connections) and even deep packet inspection, analyzing packet contents to detect malicious patterns, malware, or policy violations. Modern Next-Gen Firewalls (NGFWs) can also handle intrusion prevention, SSL inspection, and application-layer filtering.
An overloaded or misconfigured firewall can block legitimate business traffic or, worse, let dangerous traffic through. Firewalls are also prime targets for cyberattacks, so keeping an eye on their performance and behaviour is critical for both security and availability.
Learn how to effectively monitor firewall performance, identify common issues, troubleshoot, and choose the right toolset.
Learn more

What to Monitor
When monitoring firewalls, focus on:
- CPU and memory usage – firewalls under heavy load may drop traffic or delay inspection.
- Active sessions/connections – to ensure they aren’t maxing out session limits.
- Blocked vs. allowed traffic – gives visibility into suspicious or unexpected flows.
- Policy/rule changes – misapplied rules can open security gaps or cause outages.
- Security logs and intrusion attempts – catch potential threats in real-time.
Firewalls protect your entire infrastructure, but they’re only as good as their configuration and capacity. Monitoring ensures they stay sharp, effective, and ready to respond.
Learn how Station 22 solved their network issue from a 15-minute installation to a resolution in 48-hours with Obkio’s Network Performance Monitoring tool.
Learn more

Wi-Fi Access Points are the wireless bridges of your network. They extend the wired LAN into the airwaves, allowing laptops, smartphones, and IoT devices to connect without plugging in.
An AP broadcasts a wireless signal (SSID) that end-user devices can join. Once connected, the AP authenticates the client, then forwards traffic between the wireless device and the wired LAN. Modern APs also handle tasks like band steering (pushing devices to 5GHz instead of 2.4GHz), channel selection to avoid interference, and encryption to keep traffic secure.

In enterprise environments, APs are often managed by a Wireless LAN Controller (WLC) for centralized configuration, roaming, and security enforcement.
If an AP is overloaded, misconfigured, or failing, users will experience dropped connections, weak signals, and frustratingly slow speeds. For many organizations, Wi-Fi is the primary way employees and guests access the network, so downtime or poor performance gets noticed instantly.
What to Monitor
When monitoring APs, keep track of:
- Number of connected clients – to prevent overload and balance traffic.
- Bandwidth per client – spot hogs or abnormal usage.
- Signal strength and coverage – ensure reliable connectivity across the office.
- Interference and error rates – detect competing signals or environmental issues.
- AP uptime and health – confirm APs are online and responsive.
Wi-Fi is the front door to your network for most users. By monitoring APs, admins can ensure the experience stays fast, stable, and secure.
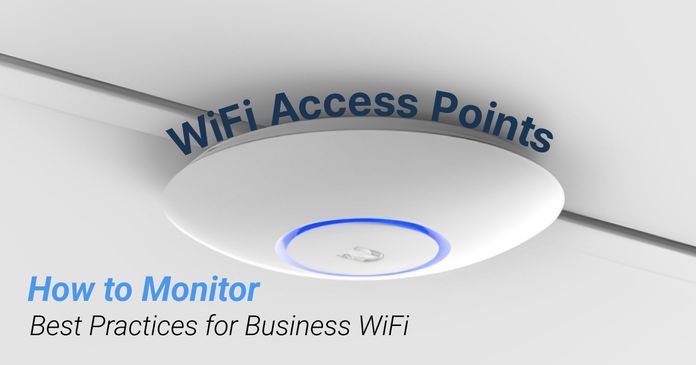
Struggling with WiFi issues? Learn how to monitor WiFi access points, with Wifi monitoring best practices to improve coverage, speed, and reliability.
Learn more

Modems are the gateways to your ISP. They connect your internal network to your Internet service provider, converting signals between your LAN and the medium your ISP uses (cable, DSL, or fibre).

A modem’s job is to modulate and demodulate signals, turning digital data from your network into analog (or optical) signals that can travel across ISP infrastructure, and then back into digital signals your devices understand. While they don’t manage internal traffic like routers or switches, modems are critical for keeping the entire organization online.
If a modem goes down, your whole business loses internet connectivity. Even if it’s not a full outage, issues like line noise, poor signal quality, or intermittent drops can degrade performance for everyone. Monitoring helps admins quickly tell whether connectivity issues are internal or with the ISP.
What to Monitor
When monitoring modems, focus on:
- Connection uptime – detect drops or restarts that interrupt service.
- Line quality (signal-to-noise ratio, attenuation) – poor quality leads to instability and packet loss.
- Bandwidth throughput – confirm you’re actually getting the speed your ISP promised.
- Packet loss and error rates – spot degraded performance before users start complaining.
A modem may seem like a simple device, but it’s a single point of failure between your network and the internet. Monitoring ensures you can quickly escalate to your ISP with data in hand when things go wrong.
Load balancers are the traffic managers for servers. They sit between clients and your backend servers, distributing incoming requests so no single server gets overwhelmed.

Load balancers use algorithms like round robin, least connections, or weighted balancing to decide which server should handle each request. They also perform health checks to make sure only healthy, available servers receive traffic. Modern load balancers may also handle SSL/TLS termination, caching, and application acceleration.
A failing or misconfigured load balancer can cause downtime, overload specific servers, or create bottlenecks that frustrate users. Since they’re often deployed in high-availability environments, their reliability is critical for uptime and performance.
What to Monitor
When monitoring load balancers, keep an eye on:
- Server health checks (backend availability): Ensure traffic isn’t sent to failing servers.
- Traffic distribution: Confirm requests are spread evenly across resources.
- Latency and response times: Spot slowdowns that affect user experience.
- CPU and memory load: Prevent overload that could cause dropped requests.
- SSL/TLS certificate validity: Expired certificates can block secure connections.
Load balancers keep services responsive and scalable, but only if they’re healthy themselves. Monitoring ensures they continue balancing traffic smoothly while providing redundancy.
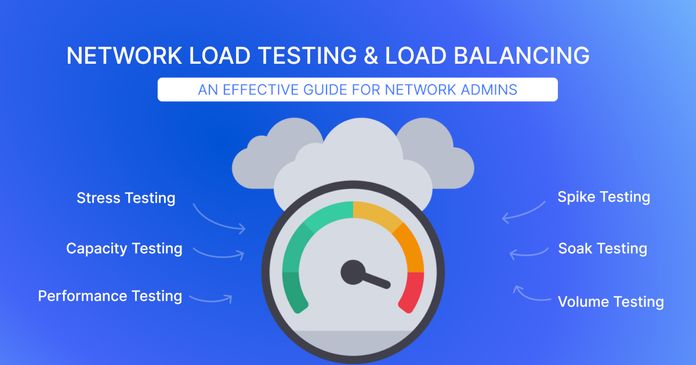
Explore the world of network administration with insights on network load testing, network load balancing, and the role of NPM. Optimize your network today!
Learn more

Hubs are the old-school connectors of a network. They were once widely used to link multiple devices together, but unlike switches, hubs don’t direct traffic intelligently. Instead, they broadcast every data packet to all connected ports.

Operating at Layer 1 (Physical Layer) of the OSI model, hubs simply act as repeaters: they take incoming electrical signals and send them out to all devices. This leads to collisions when multiple devices try to talk at once, reducing efficiency.
Because of these limitations, hubs have been almost entirely replaced by switches in modern networks, but you may still run into them in older infrastructures or legacy setups.
Even though hubs are largely obsolete, if one still exists in your network, it’s a weak link. They can cause bottlenecks, high collision rates, and poor performance. Monitoring helps identify issues so you can either troubleshoot or (better yet) plan a replacement.
What to Monitor
For hubs still in use, focus on:
- Uptime and connectivity: Ensure the hub is online and forwarding signals.
- Collision rates: High collisions mean poor efficiency and degraded performance.
- Bandwidth utilization: Check if the hub is saturated and slowing traffic.
In short: hubs are more of a liability than an asset today. If you find one in your network, monitoring is good, but migrating to switches is even better.
Gateways are the protocol translators of a network. They connect two networks that use different communication protocols, allowing them to talk to each other. Common examples include connecting a LAN to a VoIP network, or bridging IPv4 traffic to IPv6.

Gateways operate across multiple OSI layers depending on the translation needed. They can convert data formats, handle protocol conversions, and sometimes even translate at the application level. For example, a VoIP gateway converts voice data into IP packets for transmission over an IP network.
Think of a gateway as an interpreter in a meeting — without it, the two sides might as well be speaking different languages.
If a gateway fails or is misconfigured, communication between different systems breaks down. This can disrupt critical services like voice calls, video conferencing, or cloud applications that rely on seamless protocol conversion. Latency introduced at the gateway can also drag down performance for real-time applications.
What to Monitor
When monitoring gateways, focus on:
- Protocol translation errors: Detect incompatibility or misconfiguration.
- Traffic throughput: Ensure the gateway can handle expected volumes.
- Latency across the gateway: Spot performance bottlenecks.
- CPU and memory load: High usage may cause dropped sessions or degraded translations.
Gateways are the bridge between otherwise incompatible systems. Monitoring them ensures those bridges stay strong, reliable, and efficient.
Wireless LAN Controllers (WLCs) are the command centers for enterprise Wi-Fi. Instead of configuring and monitoring each access point individually, a WLC allows admins to manage all APs from one central platform.

WLCs handle critical wireless tasks such as:
- Centralized configuration: Push settings (SSID, security, channels) to all connected APs.
- Client roaming: Seamlessly transfer users between APs without dropping their connection.
- Channel and power management: Automatically adjust to minimize interference and maximize coverage.
- Authentication: Enforce user access policies across the wireless network.
In large environments (campuses, hospitals, airports), WLCs make it possible to scale Wi-Fi without chaos.
If a WLC goes down, it can disrupt hundreds or even thousands of wireless clients at once. Misconfigurations or overloads may cause roaming failures, authentication errors, or inconsistent AP behaviour. Monitoring helps ensure your wireless network remains reliable and secure.
What to Monitor
When monitoring WLCs, focus on:
- Connected APs and clients: Spot failing APs or overloaded areas.
- Controller CPU and memory usage: Prevent overload that disrupts wireless operations.
- Authentication logs: Detect login failures or misconfigurations.
- AP configuration consistency: Ensure policies are applied correctly across all APs.
A WLC is the brain of your wireless network. Keeping it monitored ensures every AP, and every user behind it, stays connected without interruption.
Intrusion Detection Systems (IDS) and Intrusion Prevention Systems (IPS) are the watchdogs of your network. They specialize in identifying suspicious activity, attacks, or policy violations in real-time.
- IDS (Intrusion Detection System): Monitors traffic and generates alerts when malicious or unusual behavior is detected.
- IPS (Intrusion Prevention System): Goes a step further by actively blocking or mitigating those threats.
These appliances are often deployed alongside firewalls as part of a layered security strategy.

IDS/IPS appliances use deep packet inspection (DPI) and signature-based or behavior-based detection to identify threats such as malware, DDoS attacks, and unauthorized access attempts. Modern solutions also integrate with threat intelligence feeds and use machine learning to detect zero-day exploits.
If an IDS/IPS is overloaded, misconfigured, or outdated, it may:
- Miss real attacks (false negatives).
- Overreact to normal traffic (false positives).
- Introduce latency that slows down applications.
Monitoring ensures your security appliances are both effective and efficient, protecting the network without disrupting legitimate traffic.
What to Monitor
When monitoring IDS/IPS devices, focus on:
- Security events (alerts, detected attacks): Spot patterns or repeated threats.
- Packet inspection performance: Ensure the system can keep up with traffic volume.
- Policy/rule changes: Detect misconfigurations or unauthorized modifications.
- Resource utilization (CPU/memory): Prevent overloads that reduce effectiveness.
IDS and IPS appliances are critical to proactive defense. Monitoring them ensures they stay sharp, up-to-date, and responsive against evolving threats.
A network isn’t just a pile of devices, it’s a system where each piece has a specific role. To see this in action, let’s walk through a simple data flow example:
Laptop → Switch → Router → Firewall → Internet
- Laptop: A user sends an email. The laptop generates data packets and sends them out to the local network.
- Switch: The switch receives the packets and forwards them to the right port, making sure the traffic gets to the router without flooding every device.
- Router: The router looks at the destination address, consults its routing table, and decides the best path for those packets to travel out to the internet.
- Firewall: Before leaving the network, traffic passes through the firewall. Here, it’s inspected against security rules — safe traffic gets allowed, suspicious traffic gets blocked.
- Internet: Once cleared, the packets travel across the ISP’s infrastructure to their final destination (the mail server).
This is just one example. In larger networks, you may also see traffic go through load balancers, gateways, wireless APs, or security appliances depending on the application and design.
Why It Matters?
Each device plays a distinct but interconnected role. If one fails, the whole chain suffers:
- A faulty switch cuts off entire groups of users.
- A misconfigured router breaks external connectivity.
- An overloaded firewall slows down or blocks legitimate traffic.
- A weak AP leaves wireless users stranded.
In short, network devices are only as strong as their weakest link. Monitoring all of them together gives admins the visibility to prevent small issues from cascading into full-blown outages.
So far we’ve talked about what to monitor on each device, but how do you actually collect all that data? The answer is SNMP (Simple Network Management Protocol), the industry standard for monitoring network devices.
What is SNMP?
SNMP is a protocol built into almost every network device, from routers and switches to firewalls, APs, and even older legacy gear. It allows monitoring systems to query devices and retrieve key performance data like CPU, memory, bandwidth, error counts, and interface status.

SNMP is built around three main components: managed devices, agents, and a network management system (NMS).
- Managed Devices: These include routers, switches, servers, printers, and any other SNMP-enabled hardware that requires monitoring.
- Agents: A lightweight software process that runs on each managed device, responsible for gathering and maintaining performance and status information.
- Network Management System (NMS): The centralized platform that queries agents, collects their data, and presents it through dashboards and analysis tools for administrators.
Learn about what SNMP monitoring is & how to use it to monitor performance of networking devices like firewalls, routers, switches and wifi access points.
Learn more

Obkio brings a smarter take to SNMP device monitoring. With clear insights into your key network devices, you can spot and resolve problems like CPU strain, bandwidth spikes, or interface errors before they turn into outages.
Unlike traditional monitoring tools that only collect raw SNMP metrics, Obkio combines device performance data with real user experience measurements. The result is total network visibility, you don’t just know that a router is running hot, you can also see how that impacts packet loss, latency, and application performance.

Here’s how it works step by step:
To start, you’ll deploy at least one Obkio Monitoring Agent. These lightweight agents are installed at critical points in your network — branch offices, data centers, or cloud environments.
- Local Agents (Windows, MacOS, Linux, or hardware) monitor from inside your LAN.
- Public Monitoring Agents (in AWS, Google, Azure) monitor your connection to the Internet and external networks.
Agents generate synthetic traffic through your network, simulating real user activity. This traffic is then correlated with SNMP device data to give you a complete picture of both performance and user experience.
Next, you enable SNMP polling for your devices. Obkio supports all SNMP versions (v1, v2c, v3) and only requires read-only access for security.
Obkio’s Monitoring Agents send SNMP requests every 30 seconds (much faster than the typical 5-minute interval of legacy tools). This Ultra-Fast Polling captures short bursts in CPU or bandwidth usage that traditional systems miss — the kind of spikes that actually cause performance issues.

Once your agents are running, simply add your network devices into the Obkio App. No need to be an SNMP or OID expert , Obkio automatically adapts to different vendors like Cisco, Fortinet, Meraki, or SonicWall and pulls the right metrics.
From there, you’ll see key performance indicators such as:
- CPU and memory utilization
- Bandwidth usage
- Interface errors and status
- Uptime and availability

After setup, Obkio continuously monitors all your devices, combining real-time SNMP metrics with synthetic traffic results. This hybrid approach allows you to:
- Detect device problems: Spot CPU spikes, memory leaks, or port failures.
- Uncover external issues: Identify packet loss or latency caused by the ISP or external networks.
- Correlate performance: Understand exactly how device health impacts user experience.
- Establish baselines: Learn what “normal” looks like for your network, so anomalies stand out.
- Receive proactive alerts: Get notified before small issues escalate.
- Optimize resources: Use historical data to plan capacity and make smarter scaling decisions.

Traditional SNMP tools treat devices like isolated black boxes. Obkio connects the dots: device performance + user experience = total visibility. This means you can troubleshoot faster, prove whether an issue is internal or ISP-related, and keep your network running at its best.
Routers, switches, firewalls, access points, modems, and load balancers these aren’t just boxes with blinking lights. They’re the backbone of your IT infrastructure, each one carrying a piece of the load that keeps businesses connected, secure, and productive.
But as we’ve seen, even the most powerful device can become a single point of failure. A misconfigured router can block internet access, an overloaded switch can slow down an entire office, and a neglected firewall can expose the network to threats.
That’s why monitoring isn’t optional, it’s essential. By keeping an eye on performance, reliability, and security, you gain the visibility to act before users notice a problem. With tools like SNMP monitoring and platforms like Obkio, IT teams can move from reactive firefighting to proactive management.
In the end, the goal is simple: a network that just works quietly, reliably, and securely, so your users never have to think about it.
👉 Ready to see how Obkio makes network device monitoring effortless?
Start a free trial and get full visibility into your devices and network performance in minutes.

Explore our Device Monitoring Tool!
- 14-day free trial of all premium features
- Deploy in just 10 minutes
- Monitor performance in all key network locations
- Measure real-time network metrics
- Identify and troubleshoot live network problems


 Obkio Blog


