


Application Performance Monitoring Tool
Monitor URLs and applications like Microsoft Teams. Test application performance, identify issues in minutes and troubleshoot immediately.
4.96 Average Rating (169 Reviews)


Introducing Application Performance Monitoring
Monitoring Built to Answer the Question: Is it the Application, Network or User?
You're troubleshooting slow application performance. Users are complaining. The developers blame the network. The network team blames the application. Sound familiar?
That's the blame game that
Application Performance Monitoring was built to end.
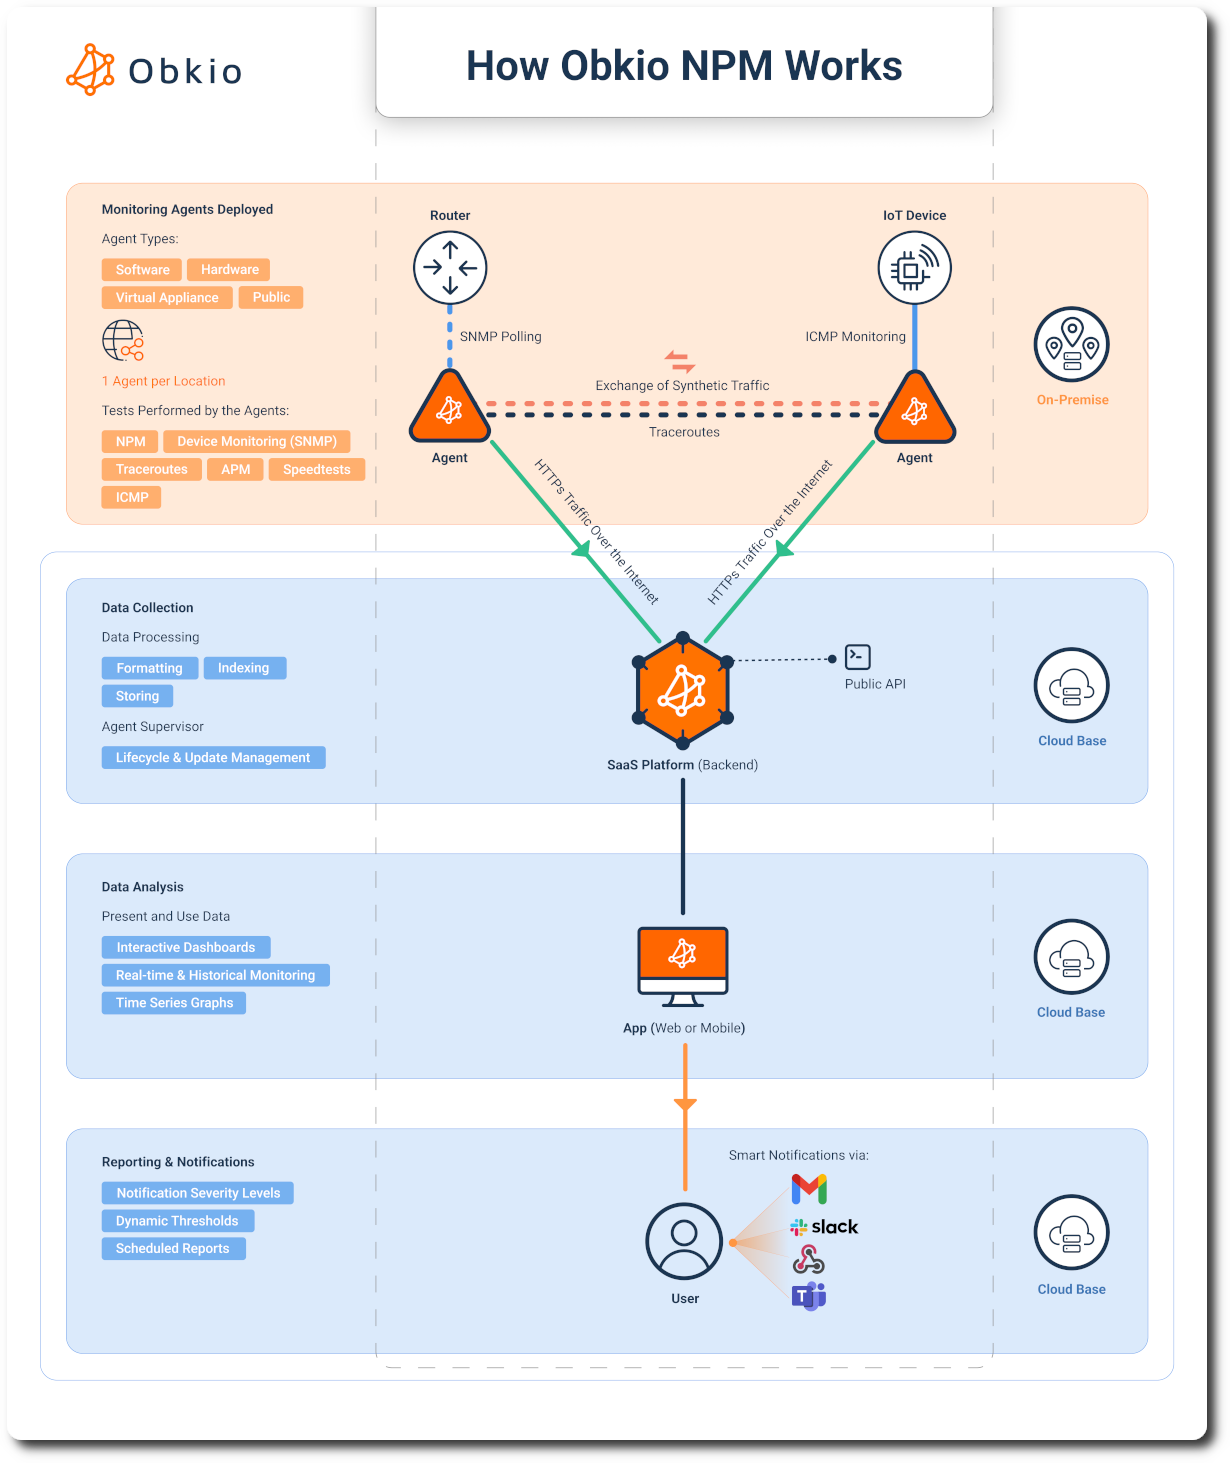
Obkio's strength is showing you exactly what's happening across your entire infrastructure; network AND applications. While our network performance monitoring reveals what's happening on your network paths with continuous synthetic monitoring, APM uses that same synthetic traffic to show you what's happening at the application layer.
You need proof. Hard data. Not just "is the network slow?" but "is this an application issue or a network issue?"
Application Performance Monitoring gives you that answer. Test any URL and get a complete breakdown of the HTTP transaction. Monitor Microsoft Teams with real audio and video traffic. Test complex web workflows with browser automation. All from your existing Obkio agents.
No more guessing. No more finger-pointing. One timeline showing network metrics and application metrics side by side.
What is Application Performance Monitoring?
Application Performance Monitoring (APM) is the practice of tracking and measuring the performance, availability, and user experience of software applications.
APM helps IT teams detect performance issues, identify bottlenecks, and ensure applications meet performance standards before users notice problems. The problem is: most traditional APM tools are complicated, expensive and come with features you don't need. Obkio wanted to change that.
Obkio's Application Performance Monitoring is a simple but comprehensive. solution for testing applications, websites, web services, and Microsoft Teams from your network. Our approach uses synthetic monitoring from your existing Obkio agents to continuously test application performance and provide detailed transaction breakdowns.
Unlike basic uptime monitors that only tell you "up" or "down," APM shows you complete transaction breakdowns, real meeting quality metrics, and detailed performance data; from any network locations where Monitoring Agents are deployed.
What Can You Monitor with Obkio’s Application Performance Monitoring Tool?
Test any application or HTTP/HTTPS endpoint your agents can reach. If it has a URL, you can monitor it. These are just some of the most common use cases, but there are many more.
SaaS Applications & Cloud Services
Monitor login pages, dashboards, and API endpoints for Microsoft 365, Salesforce, ServiceNow, Slack, or any cloud platform your business relies on.
APIs & Web Services
Monitor REST APIs, SOAP services, webhooks, and microservices. Test authentication endpoints, data retrieval, and integration points with custom HTTP methods and headers.
Public Websites & Payment Gateways
Monitor your company website, customer-facing portals (E-Commerce & Payment Gateways), support pages, and marketing sites. Test from multiple locations using different agents.
VPN & Remote Access Portals
Monitor VPN login pages, remote desktop gateways, and secure access points to ensure remote workers can connect reliably.
Microsoft Teams & UC Platforms
Test Microsoft Teams meeting quality with real audio/video traffic simulation. Monitor UC platform performance for remote collaboration.
Key Features of Obkio's Application Performance Monitoring
Synthetic Traffic-Based Testing
Like all Obkio monitoring, APM uses synthetic traffic to continuously test application performance. Your Obkio agents generate controlled HTTP requests and simulated communication traffic at regular intervals. No reliance on real user traffic, no waiting for users to report issues. Just consistent, reliable performance data that shows you exactly how your applications are performing from your network locations.
Multi-Location Geographic Testing
Deploy agents in different offices, regions, or cloud locations and test the same URL from each one. Identify regional performance differences, and location-specific issues. See if your London office has slower response times than your New York office, or if your Asia-Pacific users experience different performance than European users.
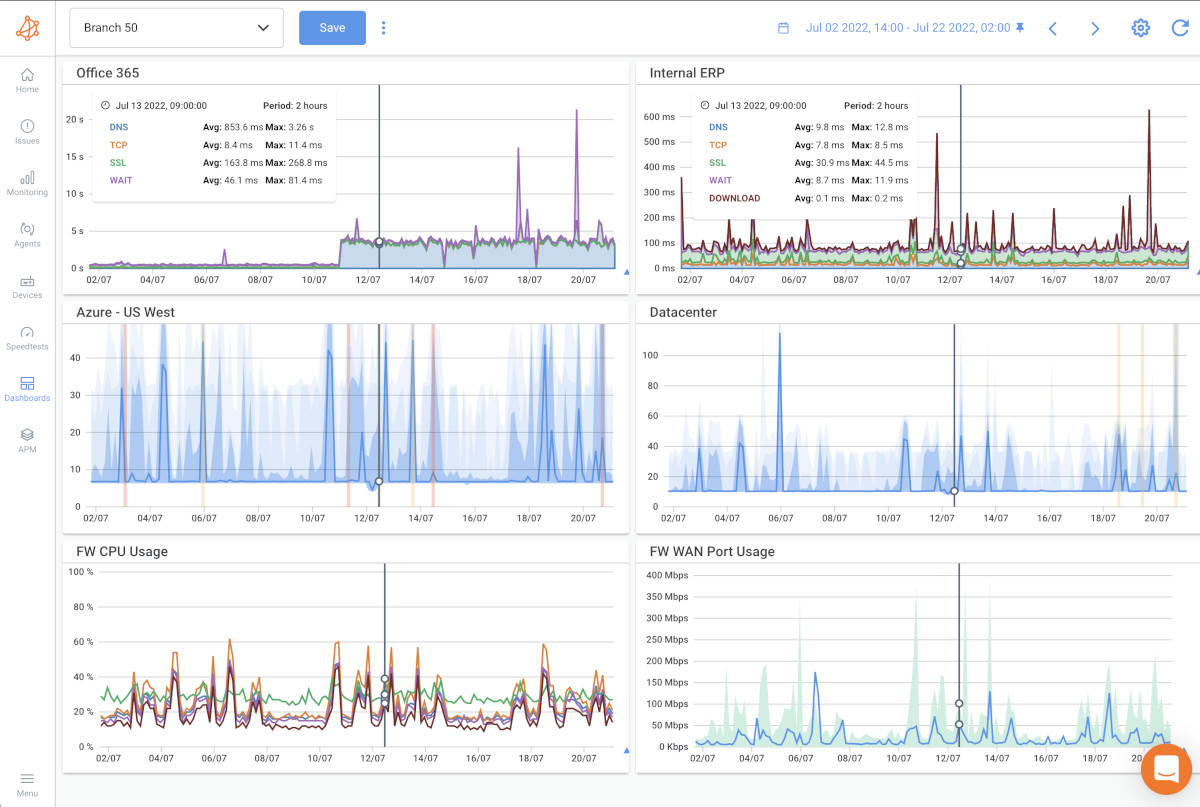
Six-Metric HTTP Transaction Breakdown
- DNS: Resolution delays
- TCP: Connection establishment time
- SSL: Certificate negotiation
- WAIT: Time to first byte (server response)
- DOWNLOAD: Content transfer speed
- Status Code: HTTP response codes
Network vs. Application Clarity
Correlate APM data with network performance metrics. See if slow response times are network latency or slow servers. Add to dashboards alongside NPM sessions and SNMP data.
Download Speed Monitoring
Measure actual bandwidth usage per HTTP call. Test throughput consistency over time. Use large file downloads to verify available bandwidth.
Three Types of APM Tests: HTTP, Web, and Teams
Obkio offers three types of Application Performance Monitoring tests, designed for different monitoring needs.

Let's Discuss Your Needs
Want to see how Obkio monitors Application performance? Let's chat.
Application Performance Monitoring HTTP: Lightweight URL Testing for Everyone
APM HTTP is Obkio's standard application monitoring solution that tests a single HTTP URL periodically to extract detailed performance metrics. This is the primary way most teams use APM and requires no assistance from the Obkio team to set up.
What APM HTTP Does: APM HTTP tests a single HTTP URL at your specified frequency and extracts six transaction metrics: DNS, TCP, SSL, WAIT, DOWNLOAD, and Status Code. It provides both real-time and historical URL performance data.
Best For:
- API endpoint monitoring
- Login page performance
- Internal application health checks
- SaaS service availability
- Simple URL response time tracking
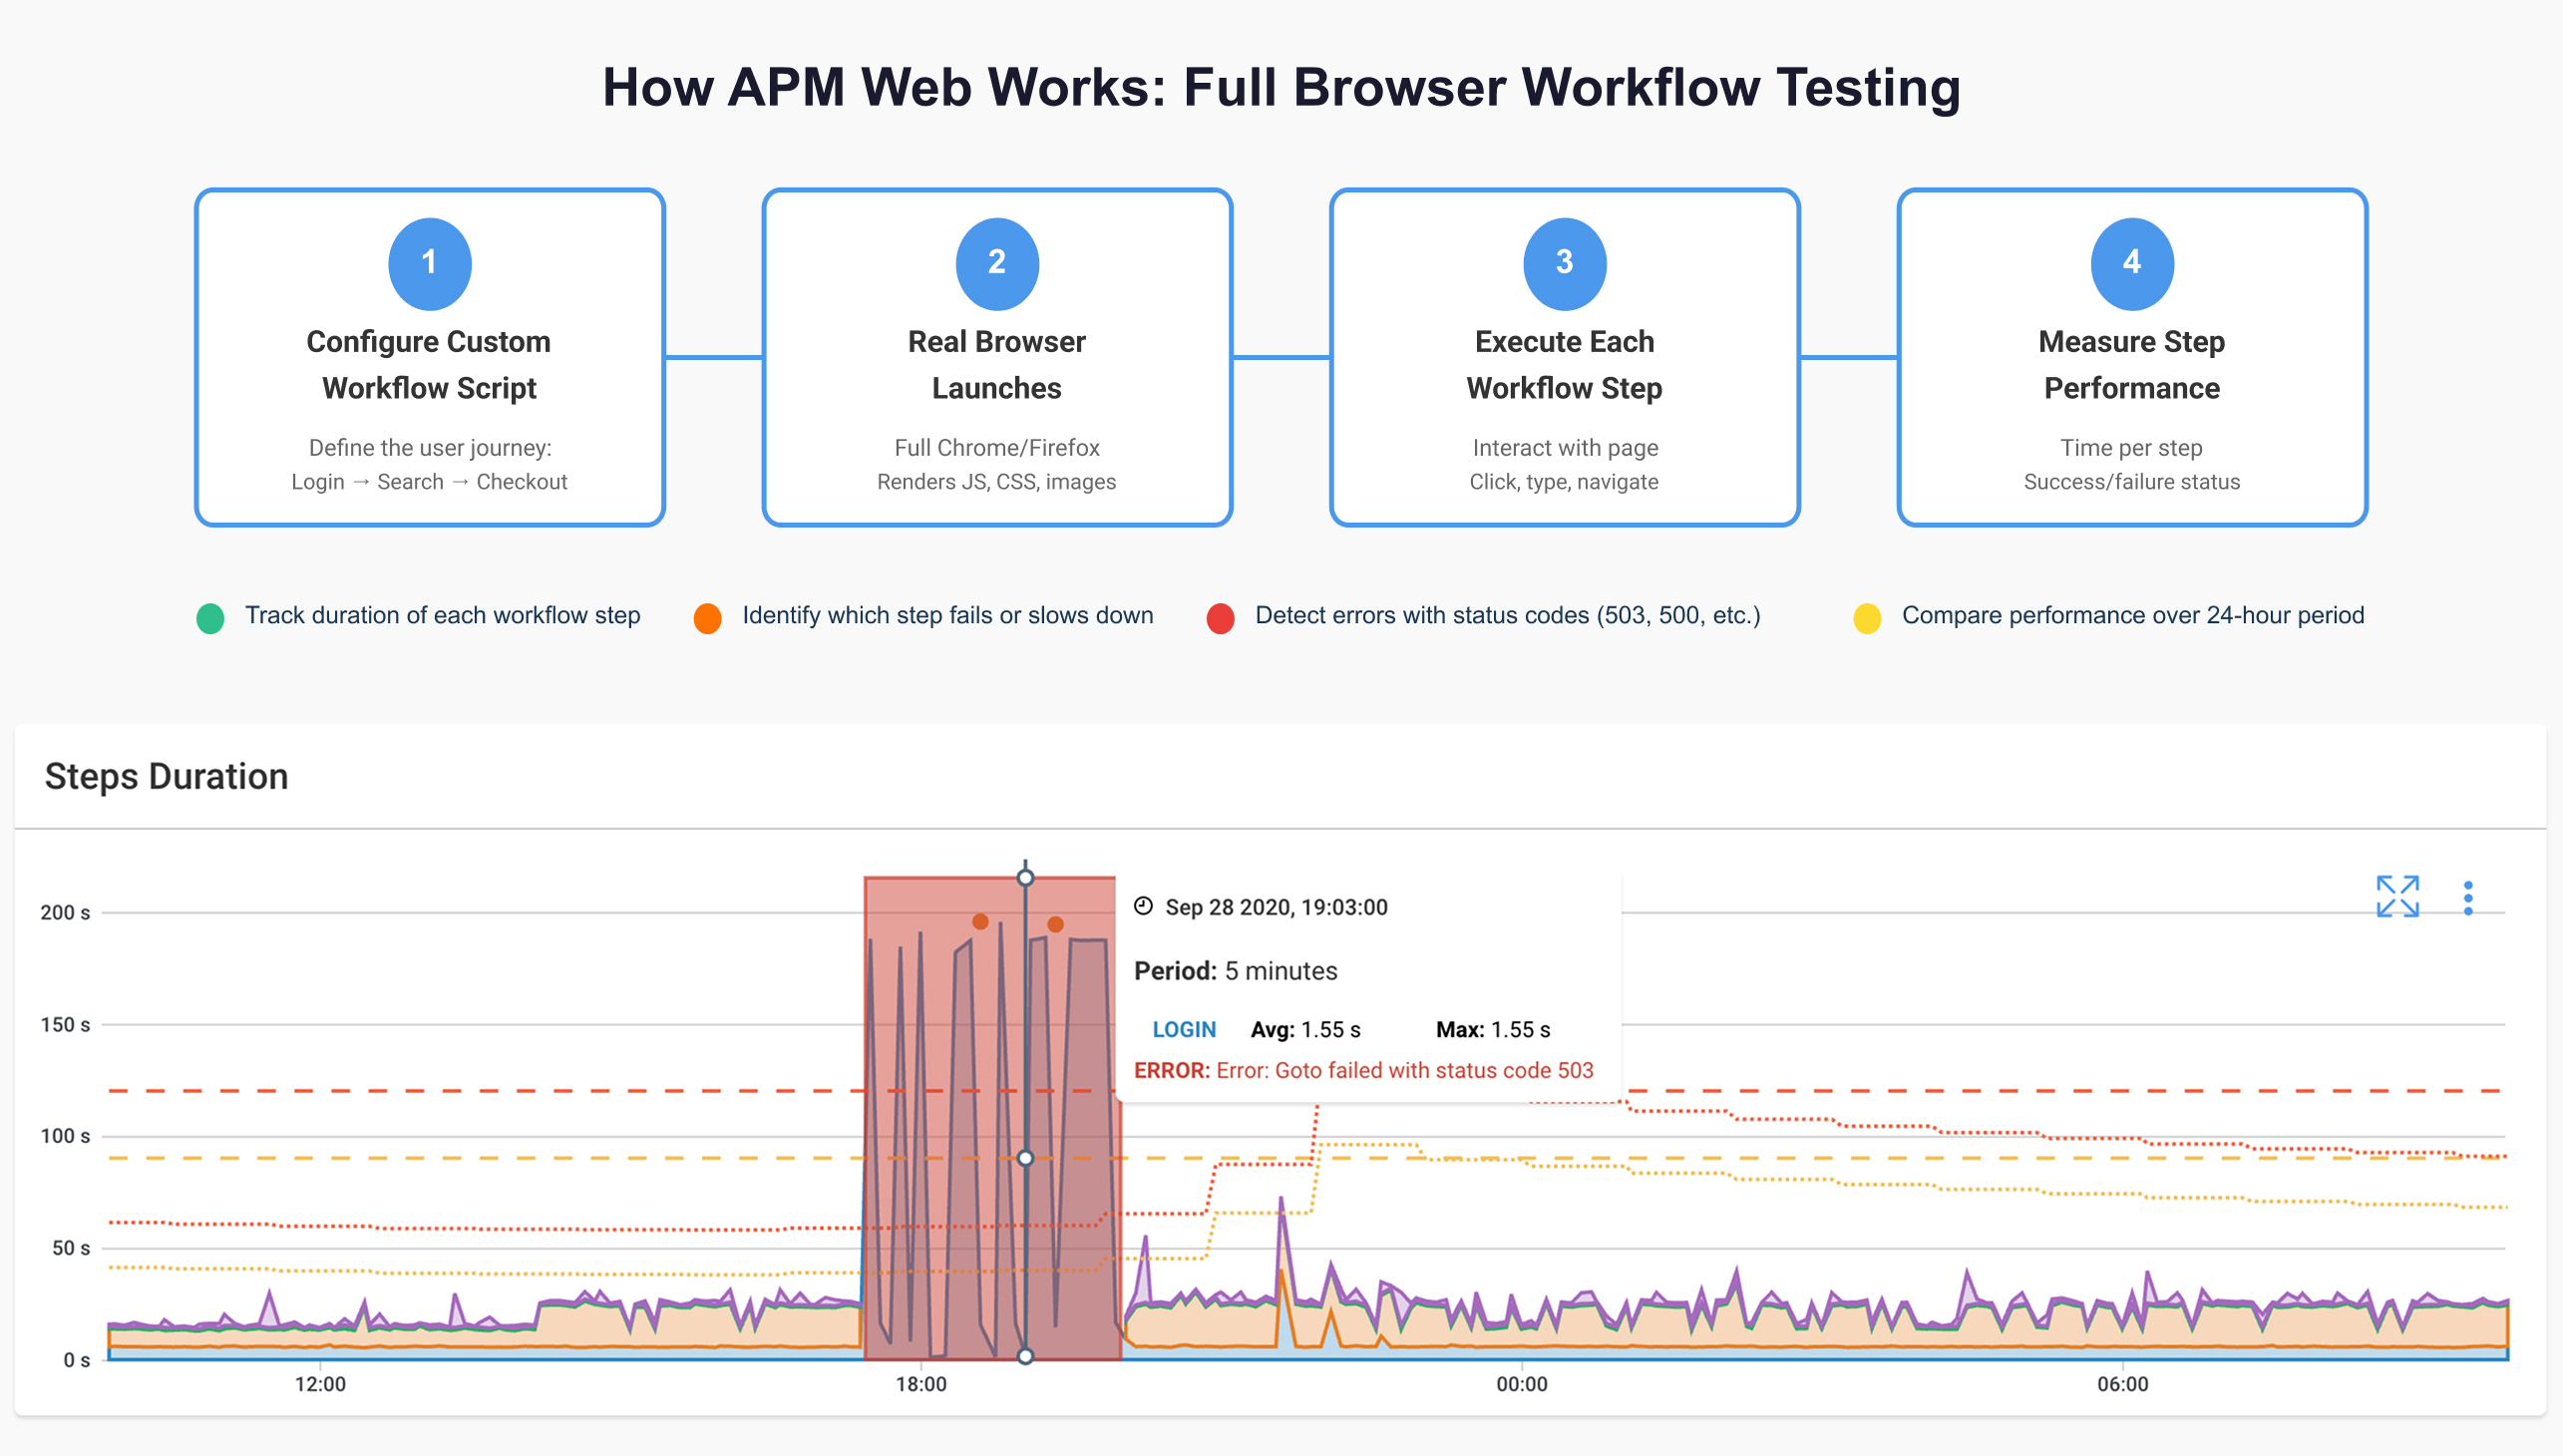
Application Performance Monitoring Web: Full Browser Workflow Testing for Enterprise
APM Web is an advanced application monitoring feature available exclusively for Enterprise customers. It uses a full web browser to test specific multi-step workflows with custom scripting.
What APM Web Does: APM Web simulates complete user workflows (login → navigate → submit → logout) by executing custom scripts in a real browser environment. It tests complex interactions that require JavaScript execution and monitors multi-page application flows that go beyond simple URL testing.
Best For:
- E-commerce checkout flows
- Multi-step authentication processes
- Complex web application workflows
- Scenarios requiring JavaScript/CSS rendering
- Custom business-critical user journeys
Note: Available on-demand for Enterprise customers only
Application Performance Monitoring for Microsoft Teams Meeting Quality Testing
APM Teams monitors Microsoft Teams meeting performance using real audio and video traffic simulation. This specialized test type validates network readiness for Teams and identifies performance issues affecting remote collaboration.
How APM Teams Works:
The Obkio initiates a Microsoft Teams meeting and Obkio Agents (equipped with Obkio's Office 365 licenses) join the meeting. The agents inject real audio and video traffic to simulate actual communication, assess network performance, and collect and analyze meeting quality metrics.
Best For:
- Validating network performance for Teams deployments
- Monitoring remote worker collaboration quality
- Troubleshooting Teams call quality issues
- Ensuring consistent UC platform performance
- Pre-deployment network readiness testing
Customers Love Obkio's APM Tool


Deploy Obkio’s Application Performance Monitoring Tool In Minutes
First, you’ll need to deploy Obkio. Get started with Obkio's 14-day free trial: no credit card required, full feature access, and expert support included. Deploy monitoring agents at your key network locations to begin continuous performance monitoring.
Quick Start:
- Sign up for your free trial
- Deploy Obkio agents at your offices, data centers, or remote locations
- Agents automatically begin monitoring network performance
- Access the Obkio dashboard to configure APM tests
Where to Deploy Agents:
- Office locations: Monitor from where your users work
- Data centers: Test from where your applications are hosted
- Remote sites: Ensure remote workers have good application performance
- Multiple regions: Test geographic performance differences
Once your agents are deployed and online, you're ready to configure APM tests.


Create Your Application Performance Tests
The APM tab displays all your HTTP URL tests with a status overview at the top showing how many tests are healthy, warning, error, or down.
What You'll See:
- Status overview with filtering (OK, Waiting for Data, Warning, Error, Down)
- List view of all APM tests with current status
- Template name, URL, and agent(s) running each test
- Click any status to filter and find tests needing attention

Step 2.5: Create an Application Performance Monitoring Template
APM templates control what gets tested, by which agents, and how often. Here's how to create your first template:
To Create a Template:
- Click the APM tab
- Click the gear icon (top right)
- Click the plus icon to add a new template
- Select your APM type: APM HTTP (standard), APM Web (Enterprise), or APM Teams (Teams monitoring)
- Click Next
Configure Your Template:
Required Settings:
- Template Name: Descriptive name for your monitoring test
- URL: Full URL to test (e.g., https://yourapp.com/api/status) - for HTTP tests
- Agent Selection:
- Check "All agents" to run on every agent in your organization
- Or select specific agent(s) or agent group(s)
- Frequency: How often to run tests (default: 1 minute)


Analyze Your Application Performance Metrics
Once your template is saved, tests begin running immediately. Click any APM test from the APM tab to see detailed performance graphs.
For APM HTTP Tests - Six Critical Metrics:
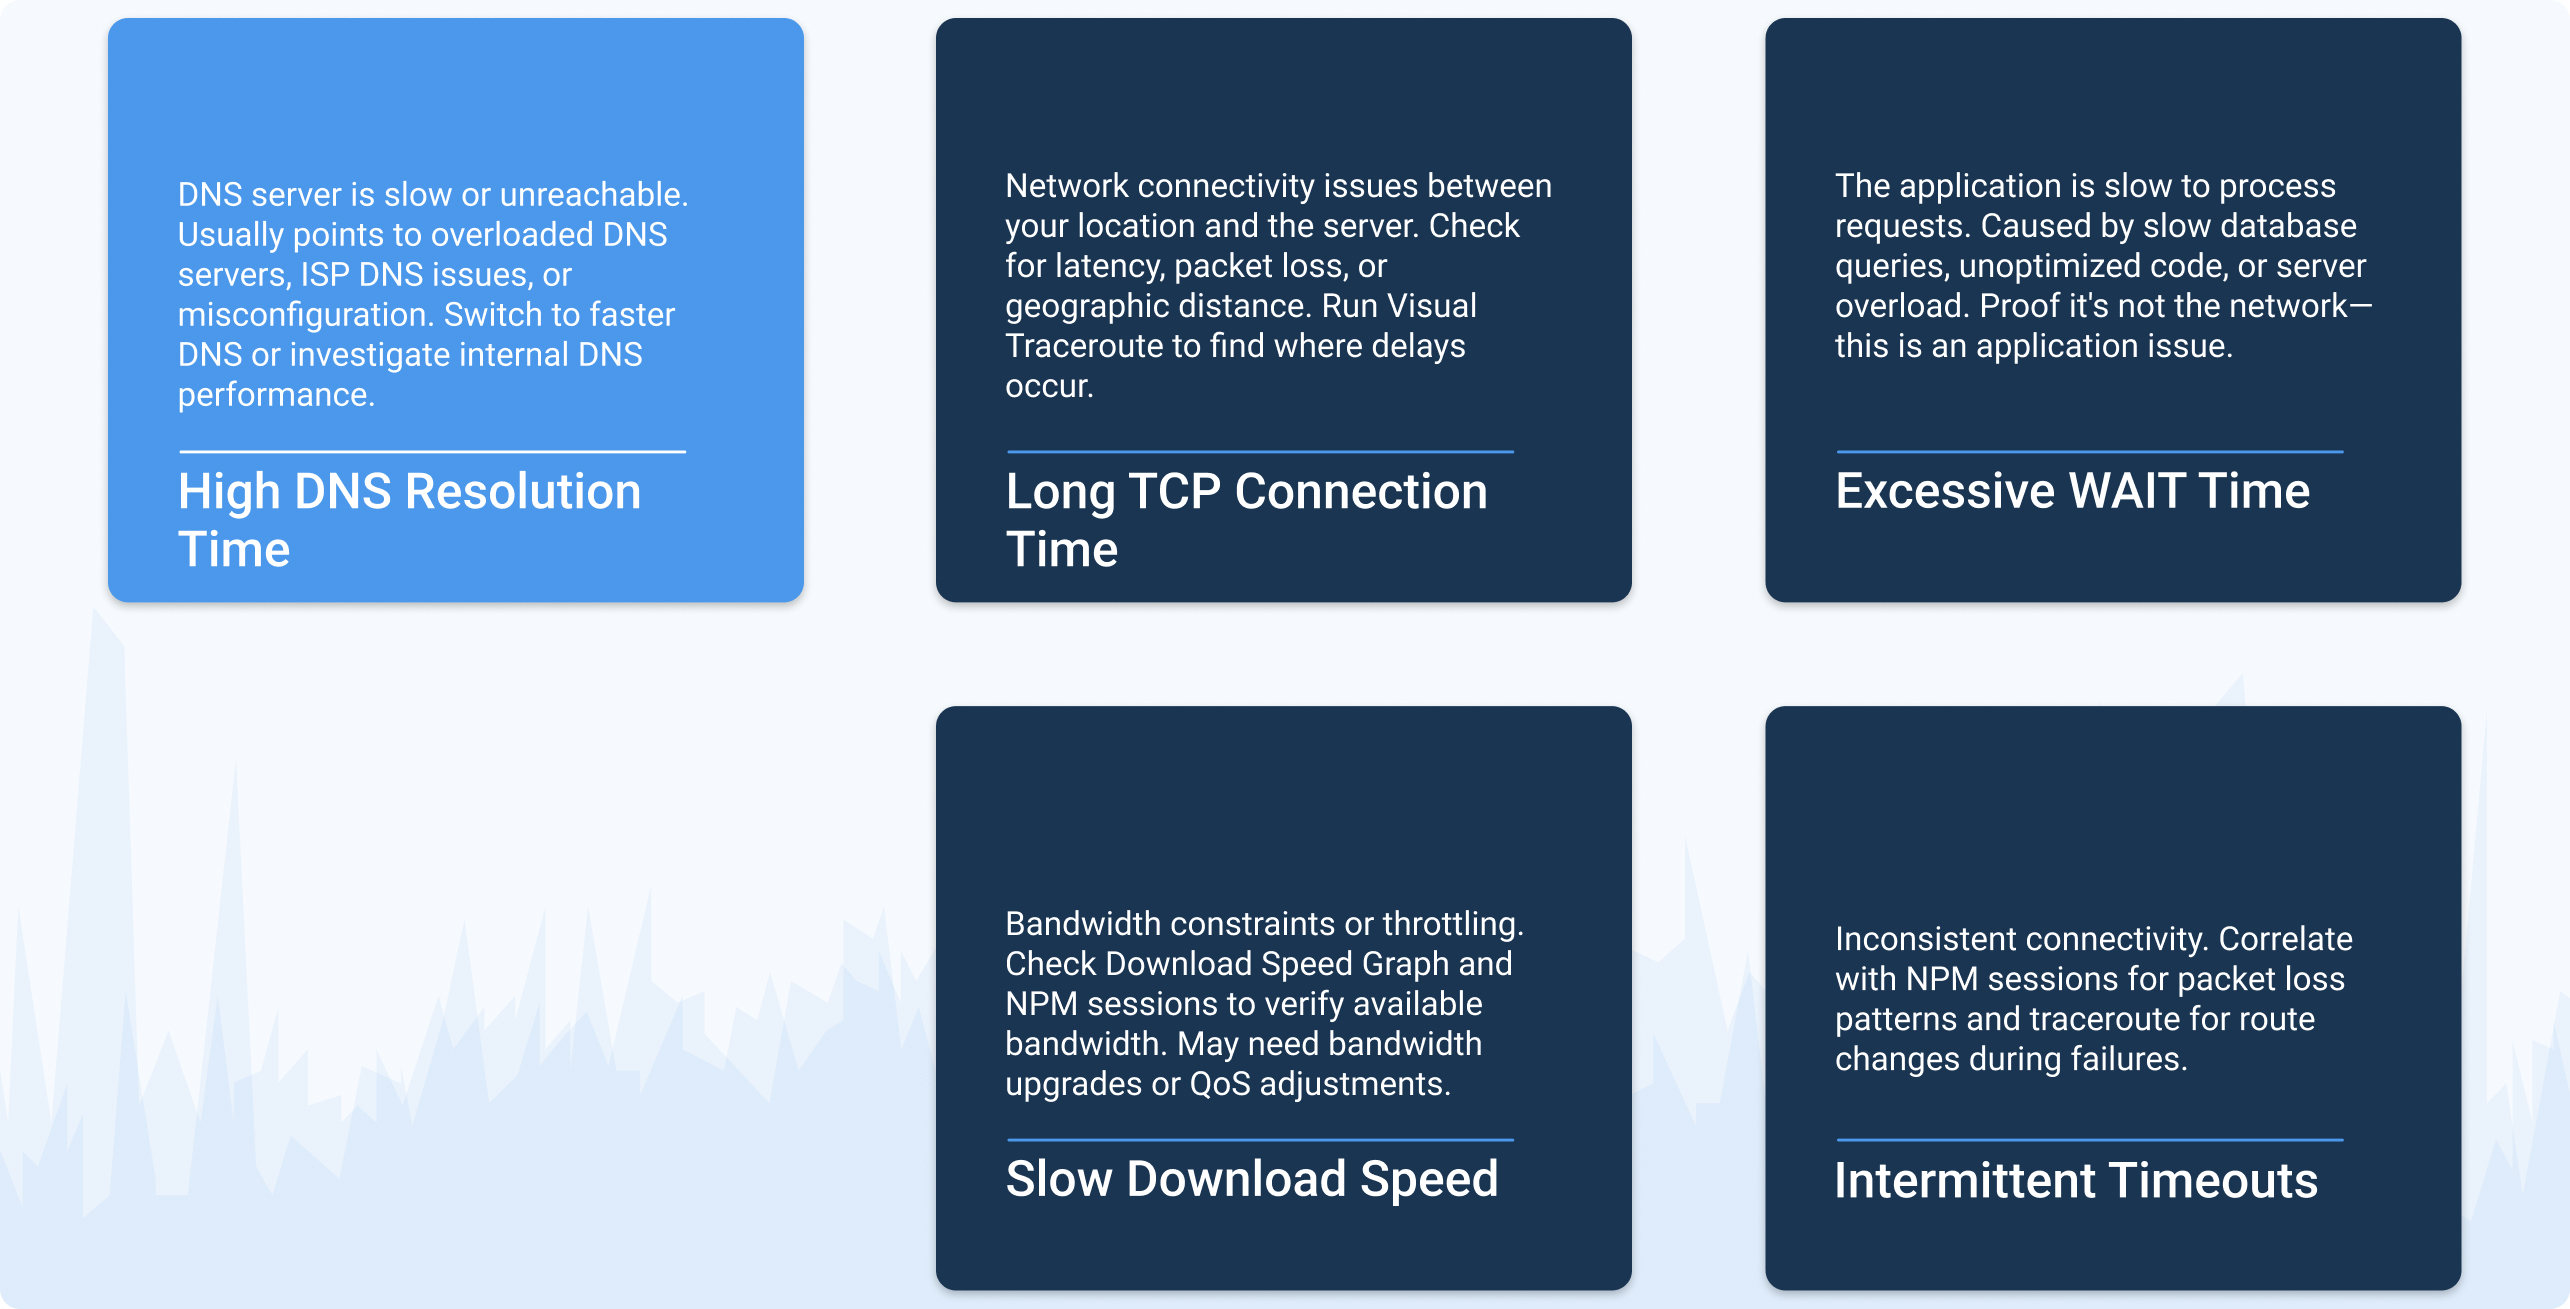
- DNS: Time to resolve domain name to IP address (identifies DNS issues)
- TCP: TCP 3-way handshake time (indicates network latency or packet loss)
- SSL: SSL negotiation time (shows server load during handshake)
- WAIT: Time to first byte / server response time (reveals application processing delays and database query performance)
- DOWNLOAD: Content download time (shows transfer speed)
- Status Code: HTTP response codes (200 = success, 4xx/5xx = errors, 3xx = redirects)
Download Speed Graph: Shows bandwidth used during the DOWNLOAD phase
More APM Metrics By Test Type
For Microsoft Teams APM Tests:
- Audio and video quality metrics from Microsoft's API
- Meeting performance data including jitter, packet loss, and latency
For APM Web Tests:
- Expected status code is 200 (OK)
- 4xx codes indicate client-side issues (404 Not Found, 401 Unauthorized, etc.)
- 5xx codes indicate server-side errors (500 Internal Server Error, 503 Service Unavailable, etc.)
- 3xx redirect codes mean the URL redirects to another page—APM only tests the configured URL, so use the final destination URL for accurate results
Step 3.5: Add Application Performance Data to Dashboards
The real power of Application Performance Monitoring emerges when you correlate application performance with network performance. Add APM metrics to your dashboards for unified visibility.
How to Add APM to Dashboards:
- Go to the Dashboards tab
- Click Add Widget
- Select Application Performance Monitoring from the widget list
- Choose your APM test and select graph type (HTTP Duration or Download Speed)
- The APM widget appears on your dashboard
Create a comprehensive view by adding the APM HTTP Duration widget at the top, then add corresponding network session graphs from the same agent below it, and include SNMP device metrics for relevant network equipment. With everything on one timeline, you can quickly identify root causes by comparing application and network performance side by side.
- When APM shows slow WAIT times but network latency is normal → application issue
- When APM shows normal metrics but network sessions show degradation → network issue
- When both degrade simultaneously → network is affecting application performance


Correlate Application Performance with Network Performance Data
The complete picture emerges when you analyze APM results alongside your network monitoring data. Correlation reveals whether issues stem from the network, the application, or both.
How to Correlate APM with Other Obkio Tests:
APM + NPM Sessions: When an APM test shows slow performance, check the corresponding NPM session data from the same agent:
- Both show degradation? Network issue affecting application performance
- NPM normal, APM slow? Application or server issue
- NPM shows packet loss, APM shows errors? Network is causing application failures
APM + Visual Traceroutes: If APM shows high DNS or TCP delays, run a traceroute to see the complete path:
- Identify which hops are causing latency
- Determine if delays are internal network or ISP-related
- Pinpoint routing issues affecting application access
APM + Network Destinations (ICMP Monitoring): Combine URL testing with ICMP monitoring to the same destination:
- APM tests application-layer performance (HTTP transaction)
- Network Destinations tests network-layer reachability (ICMP)
- Together, they show if both network connectivity AND application performance are healthy
APM + SNMP Device Monitoring: Check network device performance when APM tests show issues:
- High router/switch CPU? Might be causing packet loss affecting APM
- Interface errors or bandwidth saturation? Could slow down application response times
- Device issues often manifest in both APM and device metrics simultaneously


Identify the Root Cause of Application Performance Issues
Now it’s time to identify the causes of issues affecting your key application. When you identify an APM issue, check NPM sessions, Visual Traceroute, and SNMP device metrics from the same timeframe.
- Network metrics healthy + APM issues → Application problem
- Network metrics degraded + APM issues → Network problem
- Only WAIT time high → Likely application problem


Set Up APM Alerts for Application Issues
APM automatically alerts you when URLs become unreachable or exceed the performance thresholds you defined in your template configuration.
Automatic Alerts Notify You When:
- A URL returns error status codes (4xx, 5xx)
- Total transaction time exceeds warning or error thresholds
- Connection or total timeouts are reached
- Microsoft Teams meeting quality degrades
Alert Configuration:
Set alert thresholds when creating or editing your APM template: - Failure Alerts: Minimum severity level for notifications (Information, Warning, Error, or Critical)
- Total Duration Warning Alerts: Performance threshold before warning alerts trigger
- Total Duration Error Alerts: Performance threshold before error alerts trigger
Smart Notifications: APM uses the same alerting system as your NPM sessions and device monitoring. Each user controls their minimum severity level, so your inbox only receives alerts that matter to you.


Continuously Monitor Application Performance
Once configured, APM tests run automatically 24/7 at your specified frequency. APM HTTP tests run every minute by default, Teams tests simulate meetings every minute, and Web workflows execute on your custom schedule, no manual intervention needed.
Smart notifications alert you when performance degrades or thresholds are exceeded. Each user sets their own notification preferences, and every alert includes full context: URL, status, severity, timestamp, and a direct link to investigate. Integrate with PagerDuty for critical alerts that need immediate escalation.
Historical data retention lets you identify performance patterns over time. Does your CRM slow down every Monday morning? Do API response times spike at quarter-end? The data tells the story and helps you validate fixes after deployment.
The result: you catch issues before users report them, correlate application performance with network data automatically, and always have the evidence you need when troubleshooting.

Use Cases: When to Use Application Performance Monitoring

No Matter Your Network Issue
We've Got the Solution For You
Obkio's solution is designed to be the easiest packet loss monitoring tool and packet loss testing tool on the market, making it the ideal choice for businesses of all sizes, from IT professionals working from home to managing the complexities of large-scale corporate networks.
- 14-Day Proof Of Concept
- Single and home offices
- SMEs with less than 3 locations
- Mid to large multisite networks
- MSPs & large businesses
- Non-Profit Organizations
- Colleges and Universities
Check out our plans, all available with a free 14-day trial, no credit card required!
Let's Discuss Your Needs
Want to see how Obkio monitors Application performance? Let's chat.
Network Monitoring, Troubleshooting & Diagnostics:
Expert Insights and How To's
Welcome to our blog, where we address the common challenge of identifying network issues and provide you with effective solutions. At times, network problems can be elusive, causing disruptions, performance bottlenecks, and frustration. But fret not, because we are here to help. Our team of experts has extensive experience in tackling network issues head-on, and we are excited to share our knowledge and insights with you.


Frequently Asked Questions
No. APM performs HTTP tests from your existing Obkio agents. No server-side installation required.
Agent-to-agent sessions provide bidirectional synthetic monitoring of network performance. APM tests application endpoints via HTTP to show transaction breakdown. Use both together for complete visibility.
Yes. Your Obkio agents can test any URL they can reach—internal web applications, APIs, SaaS platforms, anything accessible via HTTP/HTTPS.
APM only tests the configured URL. If it returns a 3xx redirect, you'll see that status code. For accurate performance data, use the final destination URL that doesn't redirect.
APM is included in your Obkio agent pricing. Basic plans include 2 APM tests per agent. Premium plans include 10 per agent. No separate fee.
Yes. APM can test any HTTP endpoint, including REST APIs. You can configure the HTTP method (GET, POST, etc.) and custom headers.
No. APM HTTP tests only the specified URL without downloading additional assets. This keeps tests lightweight and focused on transaction breakdown. For full browser rendering, APM Web is available for Enterprise customers.
APM HTTP tests single URLs with lightweight HTTP calls—perfect for most monitoring needs. APM Web uses a full browser to test complex multi-page workflows and is available exclusively for Enterprise customers with Obkio team assistance. APM Teams specifically monitors Microsoft Teams meeting quality using real audio/video traffic simulation.
APM Teams creates actual Microsoft Teams meetings, joins them with Obkio Agents (using Obkio's Office 365 licenses), injects audio and video traffic for 35 seconds, then retrieves performance metrics from Microsoft's API. This process repeats every minute to continuously monitor MS Teams performance.
Yes. When creating or editing APM templates, you can define warning and error thresholds for total duration, set minimum notification severity levels, and configure connection/total timeouts.
The default frequency is 1 minute, but you can customize this when creating your APM template.
Start Your Free 14-Day Trial Now!
Get a free POC with Obkio's 14-day trial. Identify network problems & collect data to troubleshoot.
Start Now Book a Demo