


Table of Contents
Table of Contents
As an IT professional, you know that Microsoft Teams is only as good as the network it runs on. Poor call quality (choppy audio, frozen video, or sudden disconnections) can disrupt productivity and frustrate users. But how do you pinpoint the root cause?
The answer lies in monitoring Microsoft Teams performance metrics. By understanding and measuring performance metrics like latency, jitter, packet loss, and bandwidth, you can proactively identify and resolve Microsoft Teams issues before they impact end-users.
In this article, we’ll break down:
- Why Microsoft Teams performance monitoring matters
- Key metrics to track (and their ideal thresholds)
- How these metrics affect call quality
- Where to access them (Teams Admin Center, CQD, and third-party tools like Obkio)
Let’s dive in.
Why Microsoft Teams Performance Monitoring Matters 
Microsoft Teams relies on real-time audio and video communication, which is extremely sensitive to network conditions. A slight spike in performance metrics like latency or a small amount of packet loss can turn a smooth call into a frustrating experience.
Without proper monitoring:
- Issues go undetected until users complain.
- Problems are misdiagnosed (Is it the network? ISP? Microsoft Teams? A user’s device?).
- Resolution takes longer, hurting productivity.
That’s where Microsoft Teams' call quality metrics come in. By measuring network and media performance, you gain visibility into what’s really happening during calls and where to focus troubleshooting efforts.
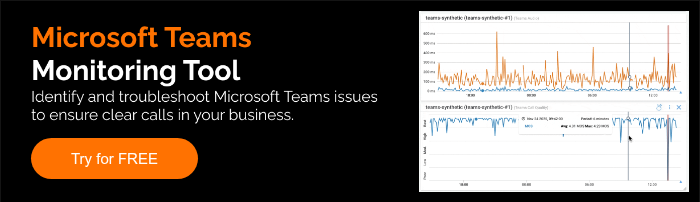
Introducing the Ultimate Microsoft Teams Monitoring Tool
At Obkio, we've spent years helping IT teams monitor and troubleshoot network performance with our enterprise-grade Network Performance Monitoring (NPM) solution. Now, we're applying that same proven technology to Microsoft Teams.
Why? Because we know how frustrating it is to troubleshoot Teams issues with incomplete data. Traditional tools show symptoms, Obkio’s Microsoft Teams monitoring tool reveals root causes by:
- Extending our synthetic monitoring approach to Teams performance metrics
- Correlating call quality with network health end-to-end
- Applying the same monitoring principles that enterprises trust for critical infrastructure

How It Works:
Obkio's Monitoring Agents join Teams meetings, exchange audio and video data, and perform Network Performance Monitoring tests from the Agent's point of view, both between Microsoft and other Agents. With end-to-end visiblity, Obkio covers up to 99% of the call path during Teams calls.
Microsoft tests don’t send network packets, but instead analyze audio and video data using SIP RTC to identify performance issues. Obkio then also connects to Microsoft’s API to download detailed call quality reports.
Obkio continuously monitors:
1. Network performance metrics
- Latency
- Jitter
- Packet loss
- CPU usage
- Bandwidth
2. Microsoft Teams Call Quality metrics
- VoIP Quality & MOS (Mean Opinion Score)
- Audio: Quality, Latency, and Jitter
- Video: Quality, Latency, and Jitter
- Average Call Quality Score

Why Microsoft Teams Users Love It:
🔹 End-to-End Visibility – See how your network impacts Teams in real time.
🔹 Proactive Alerts – Get notified before users complain.
🔹 Easy Troubleshooting – No more digging through logs, just clear, actionable insights.
Join Our Beta & See the Difference
We’re rolling out our Microsoft Teams monitoring feature in Beta to a select group of users. Want early access? Sign up for the Beta here.
Why Monitoring Network, Audio & Video Metrics is Critical for Microsoft Teams
When it comes to delivering a high-quality Microsoft Teams experience, it’s not enough to rely on the app alone. Behind every Teams call or meeting is a complex web of network traffic, audio encoding, and video streaming — all of which need to work seamlessly together. That’s why monitoring network, audio, and video metrics is absolutely critical.
1. Network Performance Metrics: The Foundation of Call Quality
Network metrics like latency, jitter, and packet loss are the foundation of Microsoft Teams performance. Every Teams call or meeting depends on real-time data traveling back and forth across your network.
- Latency → Delays in voice/video (echo, laggy responses)
- Jitter → Uneven packet delivery (choppy audio, frozen video)
- Packet Loss → Missing data (audio dropouts, garbled speech)
When latency is high, you’ll notice delays between when someone speaks and when others hear it. Jitter causes uneven packet delivery, which can lead to distorted audio or choppy video. And even minimal packet loss can result in missing audio, broken-up conversations, or frozen video frames.
Without monitoring these network health indicators, you risk blind spots that degrade the Teams experience across your business.
2. Microsoft Teams Audio Metrics: Clarity Matters
Even if your network is stable, poor audio processing can ruin calls. Audio is often the most critical element of any Teams call — if people can’t hear each other clearly, collaboration breaks down. Audio metrics, including audio quality, latency, and jitter, help you gauge how natural and intelligible conversations are.
- MOS Score → Measures perceived voice quality (1-5 scale)
- Audio Bitrate → Higher = clearer sound (below 45 kbps = noticeable degradation)
- Audio Packet Loss → Even 1% can cause robotic distortion
For example, excessive latency makes conversations feel out of sync, while jitter or low-quality audio can make speakers sound robotic or muffled. By tracking these metrics, you can ensure crystal-clear communication, which is especially crucial for client calls, remote teams, and voice-only meetings.
Example: If users report "muffled" audio, but your network looks fine, the issue could be a misconfigured audio codec or a device driver problem.
3. Microsoft Teams Video Metrics: Smooth Visuals Require More Data
Video quality plays a huge role in maintaining engagement and trust. Teams video streams rely on consistent bandwidth and stable connections, and video-specific latency and jitter can directly impact the viewing experience.
- Video Bitrate → 720p needs ~1.2 Mbps; 1080p needs ~2+ Mbps
- Frame Rate Drops → Caused by CPU bottlenecks or insufficient bandwidth
- Resolution Fluctuations → Teams downgrades quality dynamically if bandwidth dips
Without video monitoring, you might miss that a user’s "blurry" video is actually due to their home Wi-Fi congestion, not a Teams outage. Monitoring video metrics helps ensure smooth visual communication, supports screen sharing, and avoids the frustration that comes from low-quality video calls.
The Cost of Ignoring These Metrics
When you don’t track these metrics:
Issues go unresolved → Users assume "Teams is just unreliable."
Misdiagnosis wastes time → You spend hours checking the wrong thing.
Bandwidth bottlenecks persist → Congestion keeps degrading call quality.
The Solution: Proactive Monitoring with the Right Tools
To truly optimize MS Teams performance, you need:
✅ Real-time dashboards showing network, audio, and video health.
✅ Historical trends to spot recurring issues (e.g., daily 3 PM latency spikes).
✅ Alerts before users notice problems.
Next up: We’ll break down the exact metrics to monitor and their ideal thresholds, so you can keep every call crystal clear.
Which Microsoft Teams Performance Metrics Should You Monitor?
To maintain enterprise-grade call quality, you need to track these critical Microsoft Teams metrics. But beware – many IT teams monitor them incorrectly. Let's break down each one.
1. VoIP Quality
VoIP Quality general measure of the overall clarity, reliability, and smoothness of voice communications over an IP network. It reflects how good or bad a call sounds to users and is typically assessed using metrics like MOS, latency, jitter, and packet loss.

VoIP Quality is the overall experience of a voice call over the Internet, and the MOS (Mean Opinion Score) is the main way to measure it. A high MOS score (closer to 5) means the VoIP Quality is excellent, while a low score points to issues like delay, distortion, or dropped audio.
For Microsoft Teams (and VoIP in general), VoIP Quality thresholds are directly tied to MOS scores, since MOS is the standard way to express voice quality.
2. Mean Opinion Score (MOS)
MOS or Mean Opinion Score is a score from 1 to 5 that measures the perceived quality of a voice call, based on users' experience. A higher score means better call clarity.
Ideal Range:
- Excellent: >4.0
- Acceptable: ≥3.5
- Poor: <3.0 (users will complain)

Why It Matters:
For the best Microsoft Teams call experience, aim for a MOS score higher than 4.0.
A score between 3.5 and 4.0 is still acceptable, but anything lower can lead to noticeable voice quality issues. A MOS score below 3.5 means noticeable quality issues – think robotic voices or difficulty understanding words.
Common Monitoring Mistakes:
- Only checking MOS averages (masking intermittent issues)
- Ignoring location-specific MOS drops (e.g., remote offices)
- Not correlating MOS with network metrics when troubleshooting
Pro Tip: A sudden MOS drop during peak hours often indicates bandwidth contention.
3. Network Latency (Round-Trip Time)
Latency refers to the time it takes for data to travel from one device to another and back again. High latency causes delays and lag during conversations.
It can also measure the time for data to travel to Microsoft's servers and back.
Ideal Range:
- Excellent: <50ms
- Tolerable: <100ms
- Problematic: >100ms (noticeable delays)
At 150ms latency, conversations feel like talking over satellite phones with awkward pauses.

Where IT Teams Go Wrong:
- Only measuring latency to the nearest network hop (not end-to-end)
- Not accounting for VPN overhead (adds 20-50ms typically)
- Ignoring jitter when latency looks "acceptable"
Critical Insight: Wireless networks often show good latency but terrible jitter.
4. Network Jitter
Jitter refers to the variation in the time between packets arriving at their destination. High jitter makes audio choppy and video jumpy.
Ideal Range:
- Excellent: <15ms
- Tolerable: <30ms
- Problematic: >50ms (audio breaks up)
Jitter buffers can only compensate so much. High jitter means words get cut off.

Monitoring Pitfalls:
- Not monitoring jitter during peak usage times
- Assuming wired connections don't have jitter (they can)
- Overlooking that some jitter is normal (but should be consistent)
Key Fact: Jitter above 30ms requires investigation even if latency is good.
5. Network Packet Loss
Packet Loss is a phenomenon that occurs when data packets travelling over the network fail to reach their destination. Packet loss causes missing words, distorted audio, or frozen video.
Ideal Range:
- Perfect: 0%
- Tolerable: <1%
- Unacceptable: >1% (audio gaps occur)

Common Monitoring Mistakes:
- Only measuring packet loss in one direction
- Not checking for burst packet loss (short but severe drops)
- Missing that 0.5% sustained loss can be worse than 2% occasional spikes
Essential Knowledge: Packet loss is cumulative across network hops.
6. Audio Quality Metrics
Audio Bitrate is the amount of data (in kilobits per second) dedicated to transmitting voice signals. Higher bitrate = richer audio quality.
Ideal Ranges:
- Minimum functional quality: 45 kbps (barely acceptable)
- Good quality: ~100 kbps (clear, full-range audio)
- Optimal quality: 130+ kbps (when using premium codecs)
Critical Related Metrics:
- Audio Latency: Should match network latency thresholds (<100ms)
- Audio Jitter: Must stay under 30ms (same as network jitter)
- Audio Packet Loss: Keep below 1% (identical to network packet loss)

Common Monitoring Mistakes:
- Assuming negotiated bitrate = actual bitrate (Teams may downgrade mid-call)
- Overlooking noise suppression impact (AI noise reduction can consume 15-20kbps)
- Ignoring codec differences (G.722 vs. Opus have different efficiency curves)
- Not correlating with packet loss (high bitrate with 2% loss sounds worse than low bitrate with 0% loss)
Technical Note: Teams dynamically adjusts bitrate based on conditions.
7. Video Quality Metrics
Video Bitrate refers to the data throughput dedicated to video transmission, directly impacting clarity and smoothness.
Ideal Ranges:
- 720p video: 1.2–1.5 Mbps (per participant)
- 1080p video: 2+ Mbps (per participant)
- Screen sharing: 1.5–2.5 Mbps (varies by content)
Quality Thresholds:
- <1 Mbps: Visible pixelation and blurring
- <0.8 Mbps: Frequent freezing and artifacts
- <0.5 Mbps: Teams may disable video entirely
Critical Related Metrics:
- Video Jitter: Must stay <30ms (matches network standard)
- Video Packet Loss: Keep below 1% (identical to network threshold)
- Video Latency: Should remain <100ms (same as audio/network)
The Frame Rate Factor:
- Minimum: 15 fps (noticeably choppy)
- Standard: 24-30 fps (smooth motion)
- Drops below 15 fps indicate severe bandwidth or CPU constraints
Common Monitoring Pitfalls:
- Treating video and audio metrics as one (they have different tolerances)
- Overlooking resolution changes (Teams may silently downgrade from 1080p to 720p)
- Not accounting for screen sharing demands (spreadsheets need more bitrate than talking heads)
- Ignoring asymmetric issues (upload bandwidth often bottlenecks before download)
Key Technical Insights:
- Video streams show problems before audio in bandwidth constraints:
- First sign: Resolution drops (1080p→720p)
- Next: Frame rate decreases
- Last resort: Video cuts out entirely
- Background blur/virtual effects increase CPU load by 15-20%
- Gallery view (multiple participants) requires 20-30% more bandwidth than single view

8. Bandwidth (Audio and Video)
Good bandwidth is essential to support clear, uninterrupted Microsoft Teams calls, but different types of calls have different needs. Here’s what you should know:
Bandwidth: Audio Only
Audio-only Teams calls are very lightweight and efficient. They don't need much bandwidth, but they still depend on a stable, low-latency connection to maintain clear voice quality. Even if the bandwidth is technically enough, high jitter or packet loss can still cause choppy audio or dropped words.
Audio streams prioritize clarity and real-time delivery over size, making them relatively forgiving on slower networks, but sensitive to instability.
Recommended Bandwidth: ~70 kbps per stream (upload and download)
Minimum Requirement: ~60 kbps per stream

Bandwidth: Audio + Video
When you add video to a Teams call, bandwidth requirements increase dramatically. Video streams are much larger and require more consistent throughput to avoid pixelation, freezing, or delay.
Higher resolution video (such as 1080p HD or large group meetings with multiple video feeds) can push bandwidth needs even further, up to 2–2.5 Mbps or more per stream. If the network can't keep up, Teams will automatically downgrade the video quality to preserve call stability, but the overall meeting experience will suffer.
- Recommended Bandwidth for 720p Video: 1.2–1.5 Mbps per stream (upload and download)
- Minimum Requirement for Basic Video: ~1 Mbps per stream

Per Call Needs:
- Audio: ~70kbps
- HD Video: 1.2-1.5Mbps
- Screen Sharing: 1.5-2.5Mbps
These are per-stream requirements. A 10-person meeting needs 10x upstream bandwidth.
Fatal Mistakes:
- Calculating for download only (upload matters equally)
- Not accounting for other traffic (backups, cloud syncs)
- Assuming "minimum" means "recommended"
Bandwidth is necessary, but not enough by itself. Even with plenty of bandwidth, high latency, jitter, and packet loss can seriously impact Teams call quality.
Golden Rule: Always maintain 20% bandwidth headroom above requirements.
Why Three-Perspective Monitoring Matters
Traditional monitoring only tracks network metrics. But Teams issues often have multiple causes: Scenario: User reports "choppy video"
- Network view: Latency and packet loss normal
- Teams view: High jitter, MOS score 3.2
- User view: CPU at 92% (video encoding struggling)
Diagnosis: Device problem, not network. Three-perspective monitoring reveals this instantly instead of wasting hours checking the wrong things.
Microsoft Teams Monitoring Mindset Shift
Most IT teams make this fundamental error: They check these metrics after complaints surface. The winning approach?
- Establish baselines during normal operations
- Set proactive alerts for thresholds
- Correlate network metrics to see the full picture
- Document patterns and historical data (e.g., "Jitter always spikes at 2PM")
Remember: These metrics tell a story together. Good latency with high jitter? Probably Wi-Fi issues. Perfect network metrics but poor MOS? Check audio devices and codecs.
How Microsoft Teams Metrics Impact Real-World Call Performance
When Microsoft Teams calls degrade, users don’t complain about "high jitter" or "packet loss", they say things like:
- "I keep talking over people because there’s a delay."
- "The video keeps freezing while the audio continues."
- "My screen share looks fine to me, but others say it’s blurry."
As a network professional, you need to translate these user experiences into technical diagnoses. Here’s exactly how poor metrics manifest—and what’s really happening behind the scenes.
1. Voice Quality Breakdown: When Audio Goes Bad
🔴 Symptom: "Everyone sounds robotic or muffled."
📉 Likely Culprits:
- Packet Loss (>1%): Missing audio packets create digital artifacts. Teams tries to fill gaps with error correction, resulting in that "underwater" effect.
- Low Bitrate (<45 kbps): The codec aggressively compresses audio, stripping out vocal frequencies.
- Jitter (>30ms): Uneven packet delivery forces the jitter buffer to discard late packets, causing syllables to disappear.
💡 Pro Insight: Voice problems often appear suddenly (not gradually) because Teams switches codecs when crossing quality thresholds.
2. Video Performance Issues: More Than Just Bandwidth
🔴 Symptom: "Video is pixelated or freezes while audio continues."
📉 Root Causes:
- Insufficient Bitrate (<1 Mbps for 720p): Teams sacrifices detail first (backgrounds blur), then reduces frame rate.
- Packet Loss (Even 0.5%): Video codecs can’t recover lost frames like audio can, resulting in frozen blocks or green artifacts.
- CPU Bottlenecks: High CPU usage (from virtual backgrounds) forces Teams to reduce resolution before network conditions require it.
🛠️ Hidden Factor: Teams prioritizes audio over video during congestion. That’s why video fails first while voice continues.

3. Screen Sharing Failures: The Silent Bandwidth Killer
🔴 Symptom: "My PowerPoint animations are laggy for attendees."
📉 Why It Happens:
- Dynamic Content Needs More Bitrate: Moving elements (spreadsheets, video clips) require 2-3× more bandwidth than static slides.
- Asymmetric Bandwidth Issues: Most users have slower upload than download, and screen sharing consumes upload bandwidth.
- Resolution Scaling: Teams may downgrade to 720p without warning if it detects network strain.
⚠️ Critical Note: Screen sharing uses a different codec than video. High motion content can spike bitrate to 4+ Mbps temporarily.
The Domino Effect of Bad Metrics
Poor metrics rarely occur in isolation. A real-world example:
- Latency spikes to 120ms (ISP routing issue) → Users start talking over each other
- Jitter increases to 50ms as buffers overflow → Audio cuts out mid-sentence
- Teams compensates by reducing video bitrate → Faces become pixelated
- Packet loss hits 2% during peak hours → Screen sharing fails entirely
🔧 The Fix Hierarchy:
- Stabilize the network (latency/jitter/packet loss)
- Ensure sufficient bandwidth (especially upload)
- Verify endpoint performance (CPU, drivers)

Learn how to use Network Monitoring tools for Microsoft Teams troubleshooting to identify and fix common teams performance and connection issues.
Learn moreWhere to View Microsoft Teams Performance Metrics
As a network engineer, you need to know where to look before you can fix anything. Microsoft provides several native tools for monitoring Teams performance, each with different strengths.
Here's your tactical guide to accessing the right data at the right time:
1. Microsoft Teams Admin Center: Call Analytics
The Microsoft Teams Admin Center offers Call Analytics, where admins can review detailed data about individual Teams calls and meetings. You can see metrics like network latency, jitter, packet loss, audio/video quality, and device performance for each participant. It’s ideal for troubleshooting specific user issues or analyzing call experiences in depth.
Best for: Daily health checks and trend analysis
Access: https://admin.teams.microsoft.com → Analytics & reports
What You Get:
- Call quality trends across your organization
- Device usage statistics (hardware/software breakdown)
- User activity reports (peak usage times, feature adoption)
Pro Tip: Use the "Usage" and "Device Usage" reports to spot:
- Outdated Teams clients causing performance issues
- Problematic peripherals (specific headset models with high failure rates)
- Departments with chronic call quality complaints
⚠️ Limitation: Data is aggregated - you won't see individual poor calls here.
2. Microsoft Teams Admin Center: Call Quality Dashboard (CQD)
The Call Quality Dashboard (CQD) provides aggregated call and meeting data across your organization. It’s designed to help you spot patterns and trends rather than individual issues.
CQD is useful for monitoring overall Teams performance, identifying widespread problems (like a certain office with poor calls), and proactively improving network health
Best for: Root cause analysis
Access: https://cqd.teams.microsoft.com (requires admin rights)
Power Features:
- Advanced filtering by subnet, building, or ISP
- Quality metrics correlation (e.g., "Show me calls with both high jitter AND packet loss")
- Historical data (up to 28 days)
⚠️ Gotcha: CQD updates every 24 hours - not for real-time firefighting.
3. Microsoft Teams Admin Center: Real-Time Call Analytics
Real-Time Call Analytics is a feature inside the Microsoft Teams Admin Center that provides live and recent data about individual calls and meetings. Admins can monitor ongoing or just-completed calls to view key metrics like network latency, jitter, packet loss, audio quality, video quality, and device performance.
It’s especially useful for immediate troubleshooting when a user is reporting issues during or right after a Teams meeting.
Best for: Active call troubleshooting
Access: Teams admin center → Users → Select user → Call history → "Details"
Critical Intel During Outages:
- Live stream metrics (current jitter, packet loss)
- Endpoint details (IP address, MAC address, client version)
- Detailed timeline of quality fluctuations during call
Emergency Protocol:
- User complains → pull up their real-time analytics
- Check if issues are:
- Isolated to their device
- Affecting their entire subnet
- Correlated with specific actions (screen sharing, etc.)
⚠️ Warning: Only available for completed calls in the admin center. For truly live data, use...
4. Obkio's Network Performance Monitoring Tool
Third-party network monitoring tools, like Obkio and others, provide external end-to-end monitoring of network performance, including Teams traffic.
Obkio is a modern Network Performance Monitoring solution designed to continuously monitor end-to-end network and application performance, including Microsoft Teams traffic. It measures key metrics like VoIP Quality (MOS), network latency, jitter, and packet loss in real time to detect any performance degradation affecting Teams calls.
Obkio uses synthetic traffic to simulate Teams traffic and pinpoint issues between users, company locations, and Microsoft’s cloud infrastructure — even if the Microsoft Teams app itself shows no errors.
It’s ideal for businesses that want proactive troubleshooting, network visibility, and root cause identification before users start experiencing major problems.

Bonus: Obkio can also monitor overall Internet and WAN performance, making it a complete solution for ensuring a great Microsoft Teams experience across your entire network.
Best for: 24/7 monitoring with network correlation
Access: https://obkio.com (third-party SaaS)
Why IT Teams Add Obkio to Their Toolkit:
- Combines Teams metrics with network data
- Continuous synthetic monitoring between calls
- Detects anomalies before users notice
Key Advantages Over Native Tools:

How to Monitor Microsoft Teams Metrics with Obkio
Microsoft Teams performance is only as strong as your network's weakest link. Traditional reactive troubleshooting wastes precious time — by the time users report issues, productivity has already suffered. Obkio flips this model, giving you real-time visibility into call quality metrics before problems escalate.

Elevate Teams performance with Microsoft Teams monitoring. Discover how to optimize Microsoft Teams performance & identify Teams performance issues.
Learn moreStep 1: Deploy Obkio’s Microsoft Teams Monitoring Agents
Obkio uses lightweight Monitoring Agents to simulate Teams traffic across your network:
- Azure & AWS Agents: Hosted in Microsoft’s cloud (deploys in seconds)
- On-Premise Agents: Installed in offices, data centers, or cloud VMs
- Public Agents: Benchmark performance against global networks
Pro Tip: Place agents near Microsoft data centers (e.g., Quebec for Canadian teams) for accurate latency measurements.
Obkio combines network-level and Teams-specific monitoring to give you complete visibility:
Network Performance Monitoring (NPM) Foundation: Monitoring Agents continuously exchange synthetic traffic (UDP packets) to monitor network performance from all locations.
Microsoft Teams-Specific Monitoring: The Agents automatically join Microsoft Teams test calls using Microsoft's API to monitor Microsoft Teams call quality metrics.
Microsoft Teams monitoring was deisnged to work out-of-the-box to help you monitor and troubleshoot issues affecting Teams calls.
✅ No Teams admin privileges required - Obkio handles licensing and authentication automatically
✅ Zero configuration monitoring - Agents auto-discover optimal test paths to your Teams tenant
✅ True user experience monitoring - Tests follow the exact network path your users' calls take

Step 2: Monitor Microsoft Teams-Specific Metrics
Obkio Monitoring Agents join Microsoft Teams meetings and exchange audio and video data using synthetic traffic. Microsoft tests don’t send network packets, but instead analyze audio and video data using SIP RTC. Obkio complements this by also connecting to Microsoft’s API to download detailed call quality reports.
Obkio automatically tracks:
- Network Metrics: Latency (<50ms ideal), jitter (<15ms), packet loss (<1%)
- Call Quality: MOS scores (>4.0), audio/video bitrates
- Bandwidth Utilization: Per call, per location

Obkio’s dashboard allows you to view and compare metrics from the user, network, and Microsoft Teams perspectives all in one place. By displaying these metrics side-by-side, you can easily correlate issues and pinpoint when, where, why, and what is causing them.
Step 3: Set Smart Threshold Alerts for Metrics Affecting Microsoft Teams
Once Obkio is monitoring Microsoft Teams performance, the next important step is to set Smart Threshold Alerts. These alerts automatically notify you when critical performance metrics fall outside of optimal ranges, helping you identify and fix problems before users notice major issues.
Here’s how you can set it up:
- Jitter exceeds 30ms during peak hours
Jitter (variation in packet arrival times) can severely affect audio and video quality. If Internet jitter rises above 30 milliseconds — especially during busy work hours — it can cause choppy audio, frozen video frames, and overall poor meeting experiences.
Obkio automatically sends an alert so IT teams can investigate the cause (e.g., network congestion, routing problems).
- MOS (Mean Opinion Score) drops below 3.5
MOS is a critical measure of overall VoIP quality, with scores between 1 (worst) and 5 (best). A MOS score below 3.5 usually signals noticeable voice distortion, delays, or call quality issues.
Getting an early alert allows you to act quickly before users start complaining about garbled or robotic audio on Teams calls.
- Packet loss impacts 720p video streams
Even small amounts of packet loss can disrupt 720p video streams in Teams, causing pixelation, lag, or video freezing. Packet loss above 1–2% can significantly degrade video quality.
Obkio will alert you when packet loss reaches a threshold that could affect video performance, helping you maintain smooth high-quality video meetings.

Step 4: Troubleshoot Microsoft Teams Issues Based on the Source
Once you've identified the source of performance degradation through Obkio's monitoring, take targeted action based on where the problem originates:
1. Workstation-Level Issues
When metrics point to endpoint problems:
- Check hardware resources: CPU spikes during calls? Insufficient RAM?
- Validate peripherals: Faulty headsets, webcams, or drivers
- Verify client settings: Outdated Teams client or conflicting applications
- Pro Tip: Use Obkio's endpoint monitoring to compare against known-good configurations
2. Microsoft Teams Service Issues
When all metrics show green but problems persist:
- Check Microsoft 365 Status Center for ongoing incidents
- Verify through multiple test endpoints to rule out localized problems
- Review Microsoft's known issues documentation
- Key Indicator: Problems affect all users uniformly across different networks
3. Network Issues (Where Obkio Shines)
For latency, jitter, or packet loss problems:
3.1. Locate the trouble spot using Obkio Vision's visual traceroute:
🔴 Red alerts mark problematic hops
📊 Performance metrics for every network segment
🌐 Network map of routing paths
3.2. Solve the issue internally or with your ISP
- LAN Issues: Check QoS settings, switch configurations, or WiFi congestion causing LAN issues
- WAN Issues: Verify bandwidth policies and circuit health
- ISP/MSP Problems: Generate shareable reports with:
- Timestamped evidence
- Traceroute visuals
- Historical comparison data

- 14-day free trial of all premium features
- Deploy in just 10 minutes
- Monitor performance in all key network locations
- Measure real-time network metrics
- Identify and troubleshoot live network problems


Conclusion: The Essential Metrics for Flawless Microsoft Teams Calls
Microsoft Teams is only as reliable as the network and systems that support it. Without proper monitoring, call quality issues — choppy audio, frozen video, or sudden disconnections—can frustrate users and disrupt productivity. But by tracking the right metrics, you can proactively detect, diagnose, and resolve problems before they impact your business.
Key Metrics You Should Always Monitor:
✔ Network Health – Latency (<50ms), jitter (<15ms), packet loss (<1%)
✔ Call Quality – MOS score (>4.0), audio/video bitrates, resolution stability
✔ Bandwidth Utilization – Ensure sufficient headroom for peak usage
Why It Matters:
- Proactive troubleshooting prevents disruptions before users notice
- Data-driven decisions eliminate guesswork when optimizing performance
- Vendor accountability – Prove whether issues stem from your network, ISP, or Microsoft
With tools like Obkio’s Microsoft Teams monitoring, you gain real-time visibility into these critical metrics, helping you maintain seamless collaboration across your organization.
Ready to take control of your Teams performance?

