


Table of Contents
Table of Contents
Immerse yourself in a comprehensive exploration of the top 25 end user experience monitoring tools in our article. Gain valuable insights into enhancing user satisfaction.
As organizations strive to deliver exceptional digital interactions, they must constantly monitor and optimize their digital platforms to meet the expectations of their end users. End User Experience Monitoring (EUEM) tools have emerged as indispensable allies in this quest for excellence.
EUEM tools provide businesses with invaluable insights into the performance of their digital systems, enabling them to proactively identify and resolve issues that could potentially impact user satisfaction. By monitoring and analyzing critical metrics such as response times, transaction success rates, and user behavior patterns, these tools empower organizations to enhance their digital performance, boost customer satisfaction, and drive business success.
In this comprehensive article, we will explore the top 25 End User Experience Monitoring tools that have gained prominence in the industry. We will delve into their key features, advantages, and use cases, enabling businesses to make informed decisions about which tool suits their specific requirements.
Understanding End User Monitoring Tools: Enhancing Digital Experiences through User-Centric Insights 
End User Monitoring (EUM) tools, also known as End User Experience Monitoring tools, are software solutions designed to monitor and measure the experience of end users while interacting with digital systems, such as websites, applications, or services. These tools provide organizations with insights into how end users perceive and interact with their digital platforms, helping them understand and optimize the quality of the user experience.
End User Monitoring tools typically collect data from various sources, including user devices, browsers, networks, and application servers, to gain a holistic view of the end-to-end user experience. By measuring key performance indicators (KPIs) and user behavior metrics, these tools enable businesses to identify and address issues that may impact user satisfaction, conversion rates, or overall business objectives.
The Objective of End User Monitoring Tools
The primary objective of EUM tools is to monitor and analyze the performance, availability, and responsiveness of digital systems from the perspective of end users. This monitoring can be done in real-time or by collecting data over a specific time period. Some common metrics that EUM tools track include page load times, transaction success rates, error rates, network latency, and user interactions.
The Beneifts of End User Monitoring Tools
By leveraging EUM tools, organizations can proactively detect and diagnose issues that negatively impact user experiences. These tools provide actionable insights to IT teams and developers, enabling them to identify performance bottlenecks, troubleshoot problems, and optimize digital systems to deliver faster, more reliable, and user-friendly experiences.
Moreover, EUM tools support data-driven decision-making by providing comprehensive reporting and analytics capabilities. This allows businesses to measure the impact of performance improvements, track user satisfaction trends, and prioritize areas for optimization.
In summary, End User Monitoring tools are essential for businesses seeking to deliver superior digital experiences. By continuously monitoring and analyzing user interactions, these tools empower organizations to optimize performance, enhance user satisfaction, and drive business success.

Explore the power of end-user network experience monitoring in achieving user-centricity. Learn about metrics & best practices to optimize user experience.
Learn moreExploring the Two Categories of End User Monitoring Tools: Internal and External Perspectives
End User Monitoring (EUM) tools play a crucial role in measuring and enhancing the user experience of digital systems. These tools provide valuable insights into user behavior, performance metrics, and system health. When considering EUM tools, it is important to understand that they can be categorized into two distinct perspectives: internal and external.
1. External End-User Monitoring Tools
External EUM tools focus on measuring the behavior and experiences of external users, such as customers or visitors to your application or website. These tools are primarily concerned with monitoring user interactions and capturing data related to their experiences.
Popular examples of external EUM tools include Google Analytics, which provides comprehensive website analytics and user behavior insights. Additionally, Application Performance Monitoring (APM) software like Dynatrace, AppDynamics, and New Relic falls under this category, as they offer robust monitoring capabilities to optimize the performance of applications and services accessed by external users.
External EUM tools enable businesses to gain a deep understanding of how customers engage with their digital platforms. They track metrics such as page load times, transaction success rates, click-through rates, and user engagement to identify areas for improvement. These insights allow organizations to optimize the user experience, increase customer satisfaction, and drive conversion rates.
Functions of External End User Monitoring Tools (Customer-Focused):
- User Behavior Monitoring: These tools track user interactions, such as page visits, clicks, form submissions, and session duration, providing insights into user behavior and engagement patterns.
- Performance Metrics: External EUM tools monitor crucial performance metrics like page load times, transaction success rates, server response times, and API response times, allowing businesses to identify performance bottlenecks and optimize user experiences.
- Conversion Tracking: Tools in this category enable the tracking of conversion metrics, such as conversion rates, funnel analysis, and abandonment rates, helping organizations understand and optimize the effectiveness of their digital channels in driving conversions.
- Error Monitoring: These tools capture and analyze error messages, HTTP status codes, and other error-related data, aiding in identifying and resolving issues that negatively impact user experiences.
- Real-Time Monitoring and Alerts: External EUM tools provide real-time monitoring capabilities, enabling businesses to identify performance issues as they occur and receive instant alerts for quick remediation.
- Device and Browser Compatibility: These tools help monitor and analyze user experiences across various devices, browsers, and operating systems, ensuring compatibility and optimizing performance on different platforms. Integrating these insights with social media reporting allows businesses to align user behavior data with engagement metrics, enabling more strategic digital decision-making.
2. Internal End-User Monitoring Tools
While external EUM tools focus on customer experiences, internal EUM tools are designed to measure and optimize the performance of the tools and network infrastructure used by employees within an organization. These tools are essential for ensuring that employees have the necessary resources and network support to perform at their best.
Internal EUM tools monitor various aspects of the internal digital ecosystem, including network connectivity, application responsiveness, and system availability. By tracking metrics such as login times, application response times, and network latency, these tools provide IT teams with valuable insights into the performance and health of internal systems. This enables them to proactively detect and resolve issues that may hinder employee productivity and collaboration.
Internal EUM tools often include features like synthetic transactions, which simulate user interactions and measure system response times. These tools help organizations identify and address bottlenecks, optimize network infrastructure, and deliver a seamless digital experience for internal users.

Functions of Internal End User Monitoring Tools (Employee-Focused):
- Application Performance Monitoring (APM): Internal EUM tools offer APM functionalities to measure and optimize the performance of internal applications and services accessed by employees. This includes tracking response times, resource utilization, and database performance.
- Network Monitoring: These tools monitor network performance, bandwidth, latency, and packet loss, and other network-related metrics to ensure optimal connectivity and performance for internal users.
- Synthetic Transactions: Internal EUM tools often include the ability to simulate user transactions and interactions within internal systems, measuring response times and identifying any performance issues that may impact employee productivity.
- User Access and Security Monitoring: These tools monitor user logins, access privileges, and security events to ensure secure access to internal systems and protect against unauthorized activities.
- Infrastructure Health Monitoring: Internal EUM tools monitor the health and availability of critical infrastructure components, such as servers, databases, and network devices, to proactively identify and resolve issues that may affect employee productivity.
- Collaboration and Communication Monitoring: Some internal EUM tools provide insights into employee collaboration tools, such as email servers, instant messaging platforms, and video conferencing systems, ensuring smooth communication and collaboration experiences.
In conclusion, the categorization of End User Monitoring tools into internal and external perspectives reflects their intended focus. External tools primarily measure customer behavior and experiences, while internal tools aim to optimize the performance of tools and networks used by employees. By leveraging both categories of EUM tools, organizations can ensure an exceptional end-to-end user experience, both externally and internally, driving overall business success.

Top 19 Internal End User Monitoring Tools (Employee-Focused)
To ensure optimal performance and productivity within an organization, internal End User Monitoring (EUM) tools play a critical role. These tools enable businesses to monitor and optimize the experiences of their employees while interacting with internal systems, applications, and network infrastructure. By focusing on the needs of employees, these EUM tools empower organizations to identify and address issues that may hinder employee productivity, collaboration, and overall satisfaction.

In this section, we will explore the top 13 Internal End User Monitoring tools that have gained prominence in the industry. We will delve into their key features, advantages, and use cases, equipping organizations with the knowledge to select the right tool that aligns with their internal monitoring requirements. With these tools, businesses can ensure that their employees have the necessary resources and a seamless digital experience to perform at their best. Let's explore the leading internal EUM tools and unlock the potential for enhanced internal productivity.
1. Obkio Network Performance Montiroing
Obkio offers a synthetic network performance monitoring tool that provides real-time monitoring and performance analytics for all network types.
Obkio is designed to prioritize end-user experience by monitoring network performance from the end-user's perspective. By utilizing synthetic traffic, the tool simulates user behavior within the network, allowing organizations to proactively identify and address potential issues that may impact user satisfaction.
Obkio's NPM tool offers real-time insights into network performance, latency, and application responsiveness, ensuring that organizations can optimize their networks for seamless end-user experiences. With its focus on simulating actual user interactions, Obkio's NPM tool provides a proactive approach to monitoring and enhancing the overall digital experience within a network environment.
Obkio offers a range of dashboards and visualizations that provide real-time data on network performance. The platform offers a home page, agent details page, network session page, data center dynamic dashboard, branch dynamic dashboard, branch dashboard, visual traceroutes, thresholds, and notifications to help users monitor and optimize network performance.

Obkio’s Pricing:
- Free : 2 Agents | 1 Device | 1 User (Limited Functionality)
- $399 / month : 10 Agents | 5 Devices | 2 Users
- $699 / month : 10 Agents | 10 Devices | 5 Users
- Additional Fees for Additional Agent, Device and User
Obkio's pricing information is available on their website. They offer a range of pricing plans based on the number of agents required to monitor a network. The pricing is flexible, and the cost per agent decreases as the number of agents increases.

Use Obkio's Price Calculator to build your custom plan, and get a customized quote with the feautres you need. Additionally, Obkio offers a free trial for organizations to test out the platform and determine if it meets their needs before committing to a paid plan.
Learn more here : https://obkio.com/pricing/
Free Trial: https://obkio.com/signup/

Obkio’s App:


Be guided through how to identify and troubleshoot network problems with Obkio’s Network Monitoring app tour and features through screenshots.
Learn moreElevate your network's performance and prioritize end-user satisfaction with Obkio's Network Performance Monitoring (NPM) tool. Gain real-time insights into network performance, latency, and application responsiveness to ensure a seamless digital experience for your users. Try Obkio's NPM tool today and enhance the overall quality of your network for improved end-user satisfaction
- 14-day free trial of all premium features
- Deploy in just 10 minutes
- Monitor performance in all key network locations
- Measure real-time network metrics
- Identify and troubleshoot live network problems


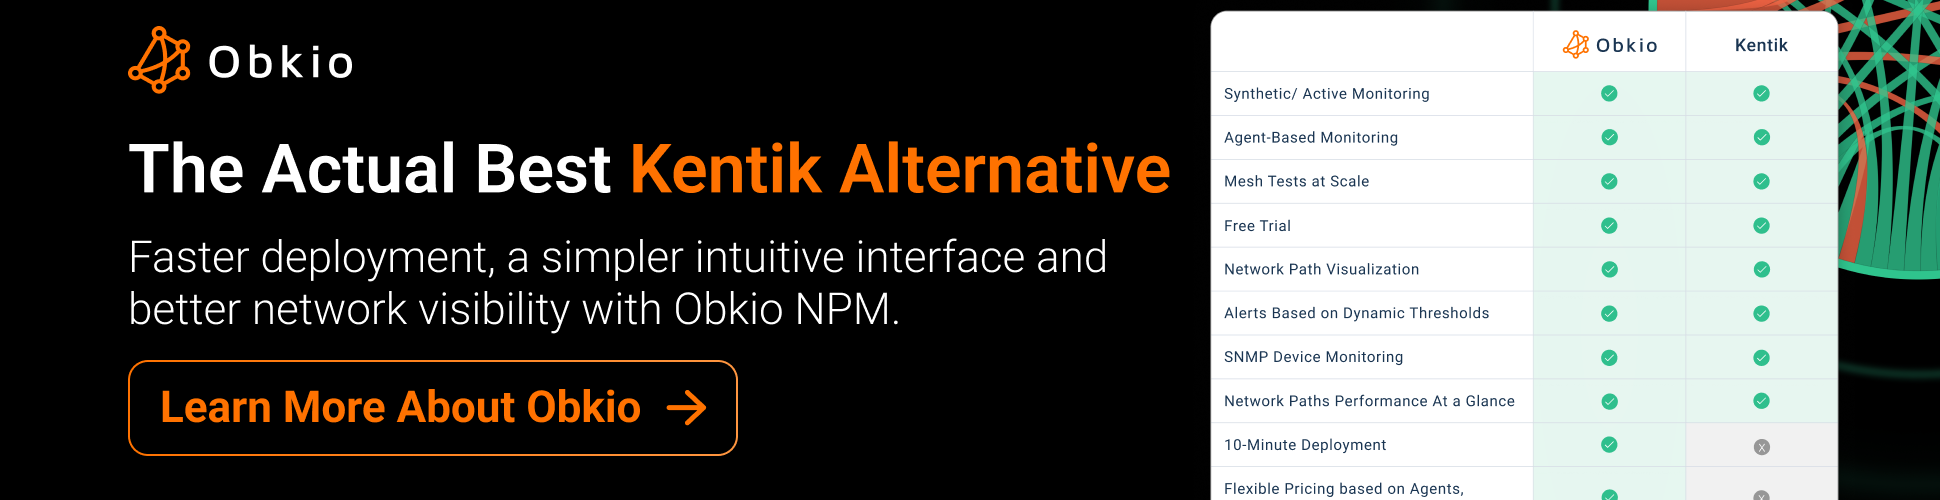
2. Kentik
Kentik is a network traffic intelligence platform that provides real-time network performance monitoring and analytics.
With its advanced capabilities in network traffic analysis, flow data processing, and real-time visibility, Kentik provides organizations with the tools needed to effectively monitor and enhance the end-user experience. The platform's focus on comprehensive insights into network performance and user interactions makes Kentik a valuable choice for optimizing digital experiences across diverse network environments.
Kentik App:


See how Obkio's Network Monitoring tool stands up against Kentik as the #1 Kentik Alternative.
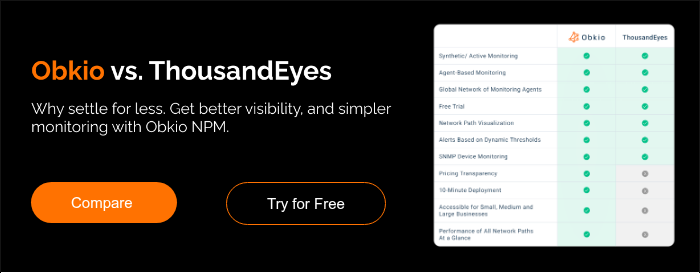
3. ThousandEyes
ThousandEyes is a network performance monitoring tool that offers real-time monitoring and analytics for network performance, application performance, and user experience. With its comprehensive network visibility, intelligent monitoring, and real-time analytics, ThousandEyes provides organizations with the capabilities to monitor and optimize end-user experiences. The platform excels in detecting and diagnosing performance issues across networks, ensuring organizations can proactively address potential disruptions and deliver a seamless digital experience for users.
ThousandEyes App::


See how Obkio's Network Monitoring tool stands up against ThousandEyes as the best ThousandEyes Alternative.
4. Catchpoint
Catchpoint is a cloud-based network and digital experience monitoring platform that provides real-time monitoring and analytics for network performance, web performance, and user experience. With a focus on providing comprehensive insights into the end-user experience, Catchpoint offers features such as real user monitoring, synthetic monitoring, and advanced analytics. The platform enables organizations to monitor and optimize digital experiences, ensuring responsive and reliable services for end-users across various network conditions.
Catchpoint App:


Experience the power of the Catchpoint platform in action! This demo provides an overview of Catchpoint's real-time visibility into global monitoring networks and its various platform dashboards. You'll discover how monitoring teams can leverage Catchpoint to perform synthetic tests, analyze real-time user data, and monitor full network performance to optimize the user experience.

5. AppNeta
AppNeta is a network performance monitoring tool that offers real-time monitoring and analytics for network performance and application performance. With features such as real user monitoring, application performance insights, and comprehensive analytics, AppNeta enables organizations to gain visibility into the end-user experience. It focuses on monitoring and optimizing application performance, ensuring a seamless and responsive digital experience for end-users.
AppNeta App:
- Capterra/GetApp/Software Advice 4.5 (2 Reviews)
- G2 4.3 (12 Reviews)
- Gartner 4.4 (29 Reviews)
- PeerSpot 4.7 (5 Reviews)
- TrustRadius 9 (9 Votes)


See how Obkio's Network Monitoring tool stands up against Appneta as the ultimate Appneta Alternative.

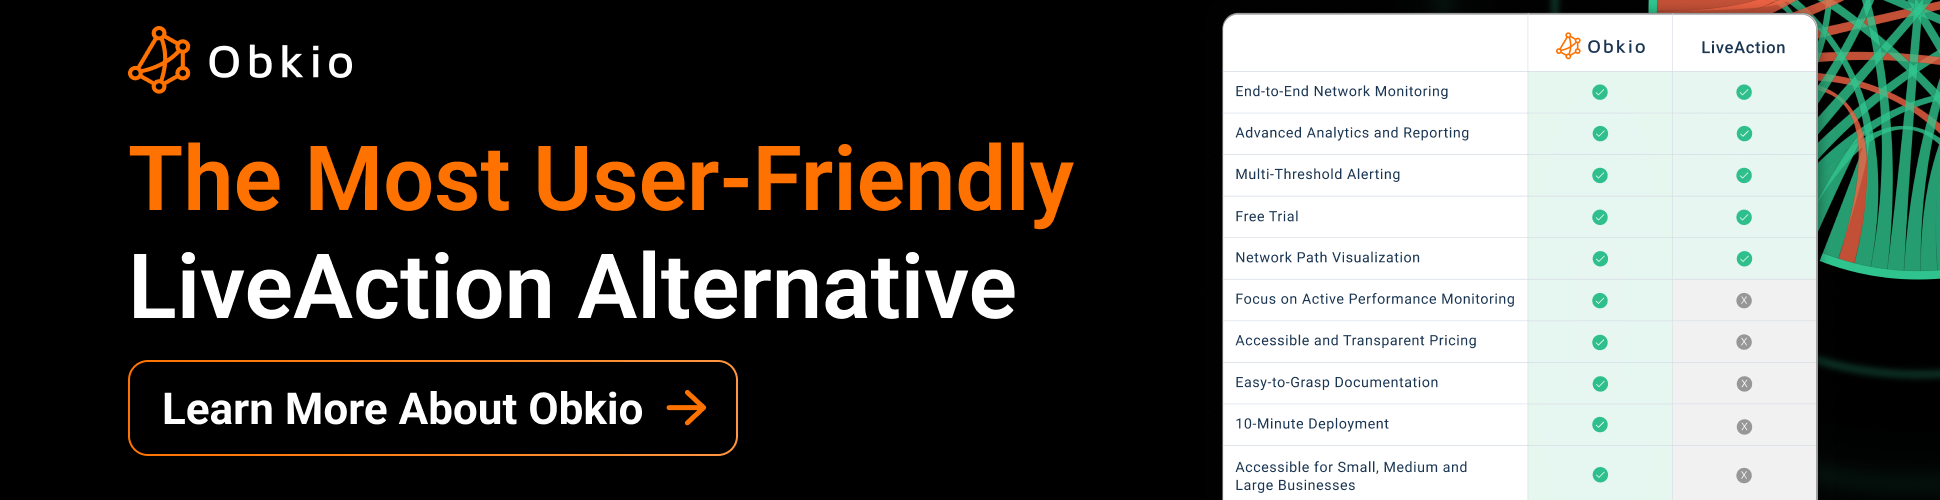
6. LiveAction
LiveAction is a cloud-based network performance monitoring and diagnostics tool that provides real-time monitoring and analytics for network performance. Its key features include real-time alerts, network topology mapping, application performance monitoring, and API integration which help organizations to monitor and optimize the end-user experience.
LiveAction App:
- Capterra/GetApp/Software Advice 4 (1 Reviews)
- G2 4.6 (41 Reviews)
- Gartner 4.9 (5 Reviews)
- PeerSpot 3.5 (3 Reviews)
- TrustRadius 9 (9 Votes)


7. PRTG Network Monitor
A comprehensive IT management software solution that offers network bandwidth monitoring capabilities. It provides real-time traffic analysis, bandwidth usage reports, device tracking, and more. It can monitor a variety of network devices and applications and offers customizable alerts and notifications to keep users informed of network performance issues. With features such as real-time performance monitoring, network visibility, and customizable dashboards, PRTG enables organizations to monitor and enhance the end-user experience.
PRTG App:


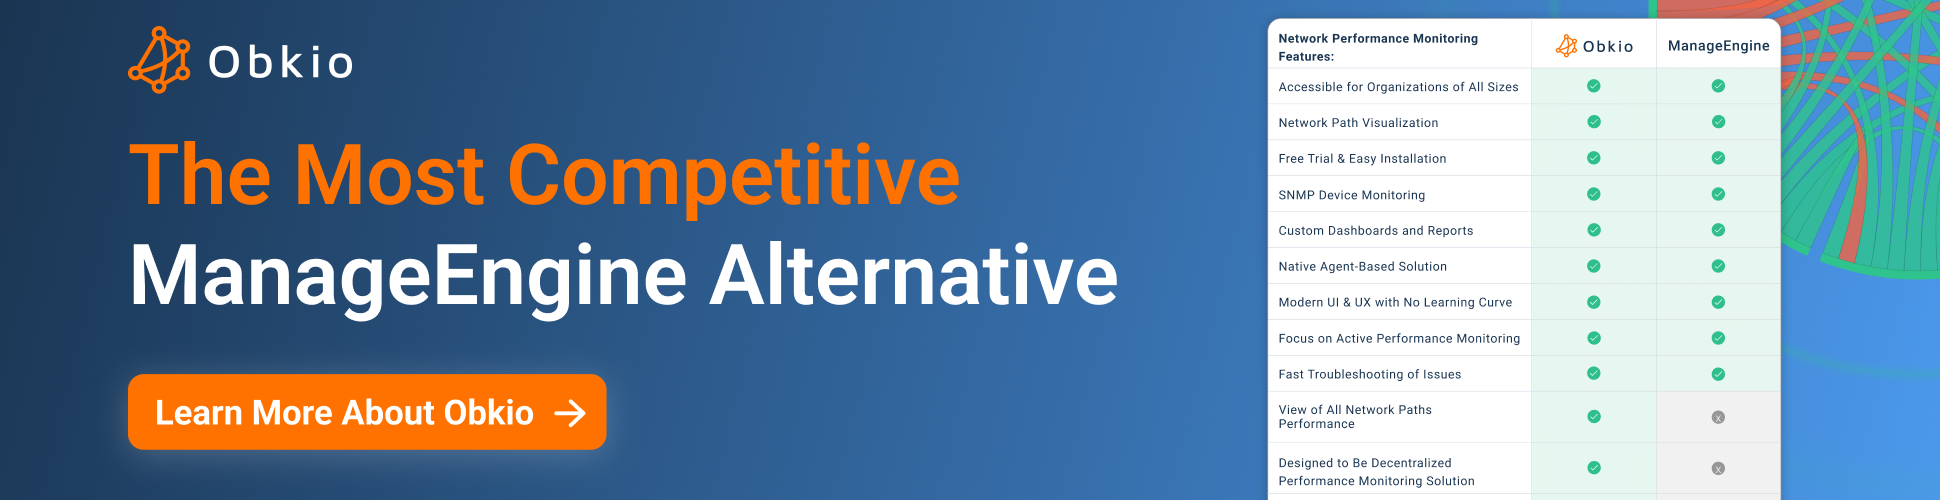
8. Manage Engine OPManager
A popular IT management software that can monitor a range of network devices and applications and offers customizable alerts and notifications to keep users informed of network performance issues. Offering real-time performance monitoring, application tracking, and extensive network visibility, OpManager equips organizations with powerful tools to ensure an optimal end-user experience. Its proactive approach to detecting and resolving performance issues sets it apart, providing a seamless digital experience for end-users across a variety of network environments.
Manage Engine OPManager App:
- Capterra/GetApp/Software Advice 4.7 (47 Reviews)
- G2 4.3 (39 Reviews)
- Gartner 4.5 (57 Reviews)
- PeerSpot 4.5 (4 Reviews)
- TrustRadius 7.8 (63 Votes)


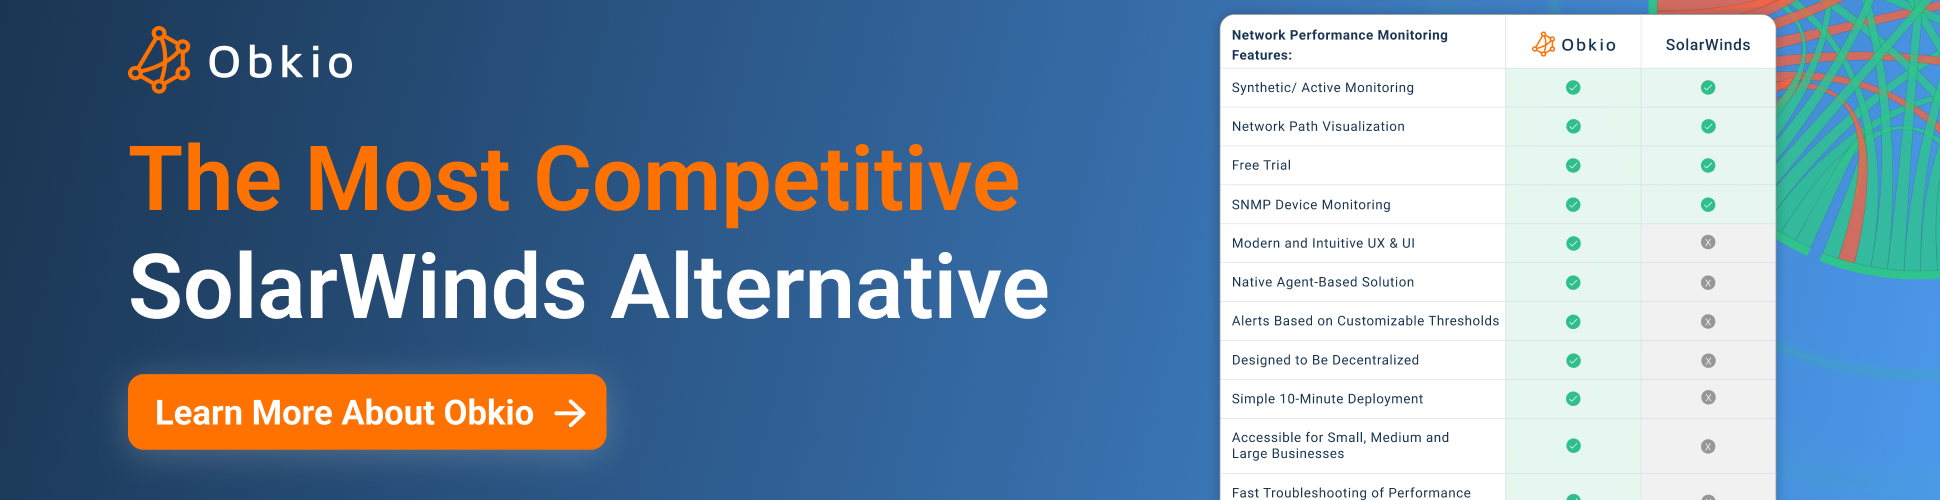
9. SolarWinds Network Performance Monitor
A comprehensive network performance monitoring tool that provides real-time visibility into network performance and health. Boasting features such as real-time performance monitoring, in-depth application visibility, and meticulous user experience tracking, SolarWinds NPM provides organizations with robust tools to ensure an optimal end-user experience.
SolarWinds App:


Discover how Obkio stands up against SolarWinds NPM as the simplest, most affordable SolarWinds alternative.
10. ScienceLogic
An IT infrastructure monitoring and management platform that offers real-time visibility into network performance, health, and security. ScienceLogic is recognized for its effectiveness in End User Monitoring (EUM). With features like real-time performance monitoring, application insights, and comprehensive analytics, ScienceLogic provides organizations with robust tools to monitor and optimize the end-user experience.
ScienceLogic App:


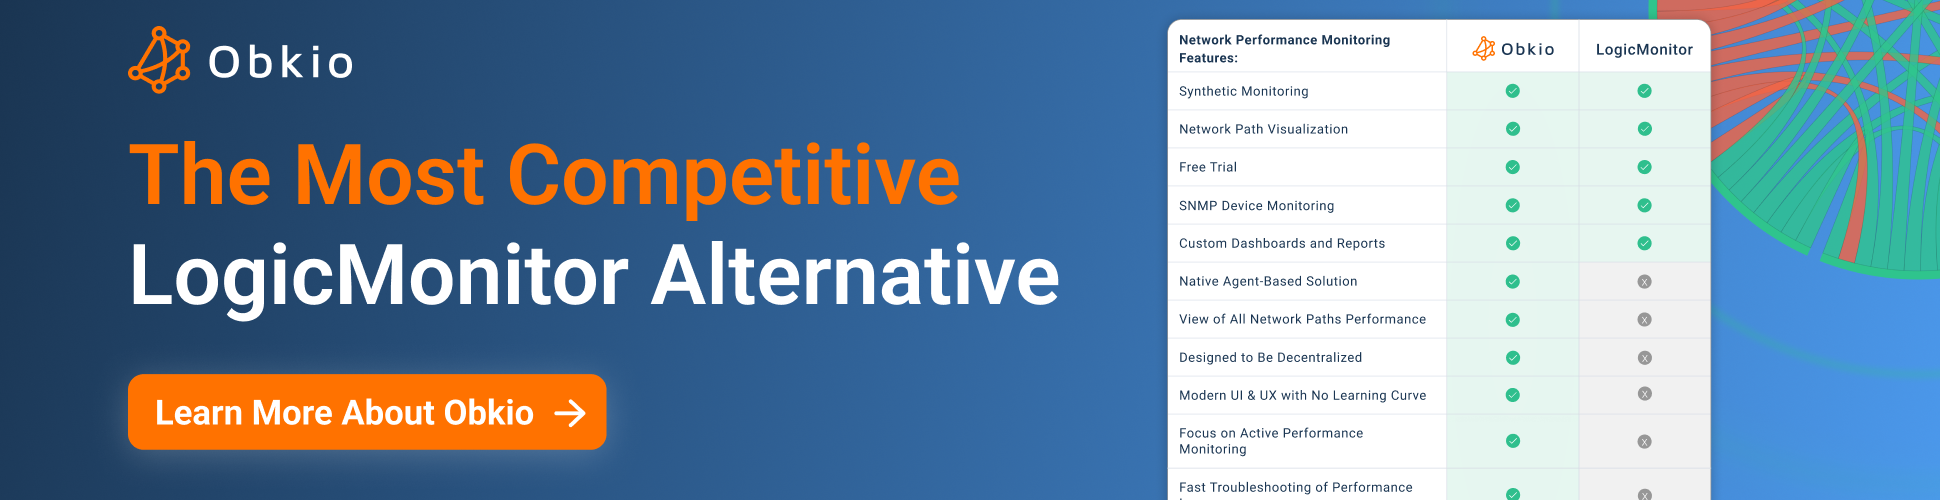
11. LogicMonitor
A cloud-based IT infrastructure monitoring and management platform that provides real-time visibility into network performance and health. With its automated discovery, customizable dashboards, and focus on scalability, LogicMonitor provides organizations with comprehensive tools to monitor and optimize the end-user experience. The platform excels in tracking network performance metrics, ensuring a seamless digital experience for end-users.
LogicMonitor App:


12. Auvik
A cloud-based network monitoring and management tool that provides real-time visibility into network performance, health, and security. With its emphasis on network discovery, mapping, and automated monitoring, Auvik provides insights into device performance and network health. While Auvik may not be a specialized tool for traditional End User Monitoring, its capabilities in network visibility and management indirectly contribute to creating a stable and responsive network infrastructure, ultimately benefiting end-user experiences.
Auvik App:


13. Icinga
An open-source network monitoring and management tool that provides real-time visibility into network performance and health. The platform's emphasis on real-time insights, coupled with its ability to detect and address performance issues promptly, ensures a seamless digital experience for end-users across diverse network environments. Icinga's strengths in customizable configurations and scalability make it a valuable choice for organizations seeking to prioritize user satisfaction and elevate overall network performance.
Icinga App:


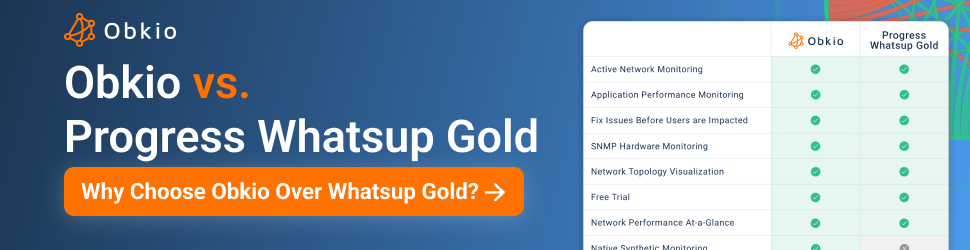
14. Progress WhatsUp Gold
An IT infrastructure monitoring and management platform. Offering network discovery and mapping tools, real-time performance monitoring, and customizable dashboards, WhatsUp Gold provides organizations with comprehensive tools to monitor and optimize the end-user experience. The platform's focus on visual representation, coupled with its alerting mechanisms and application performance monitoring, ensures a seamless digital experience for end-users.
Progress WhatsUpGold App:


15. Datadog
Datadog is a cloud-based monitoring and analytics platform that provides monitoring, alerting, tracing, and logging capabilities for applications and infrastructure. With real-time performance monitoring, application insights, and comprehensive analytics, Datadog offers organizations the tools to monitor and optimize the end-user experience effectively. Datadog's emphasis on application performance monitoring and user-friendly dashboards makes it a valuable solution for organizations committed to prioritizing user satisfaction and enhancing overall network performance.
Datadog App:


16. AppDynamics
AppDynamics is an application performance monitoring (APM) solution that provides real-time insights into application performance, user experience, and business impact. With its powerful features such as real user monitoring, application performance insights, and business transaction tracking, AppDynamics provides organizations with robust tools to monitor and enhance the end-user experience. AppDynamics' cloud monitoring services allow users to monitor their applications, microservices, and APIs in real-time and track performance metrics such as response times, error rates, and resource utilization.
AppDynamics App:

17. Dynatrace
Dynatrace is an APM and digital experience management (DEM) solution. With real user monitoring, synthetic monitoring, and comprehensive analytics, Dynatrace provides organizations with robust tools to monitor and optimize the end-user experience. The platform excels in providing insights into user interactions, application performance, and overall digital experience. Dynatrace's AI-driven capabilities enable quick detection and resolution of performance issues, ensuring a seamless and responsive digital experience for end-users across various network environments.
Dynatrace App:


18. Splunk
Splunk is a cloud-based platform that provides monitoring, logging, and analytics capabilities for applications and infrastructure. With real-time monitoring, performance analytics, and the ability to correlate data from various sources, Splunk ensures a comprehensive view of the end-user journey. It offers machine learning-driven insights and predictive analytics for detecting and resolving issues, and provides support for over 300 integrations across multiple technology stacks.
Splunk App:

19. New Relic
New Relic is an APM solution that provides real-time insights into application performance, user experience, and business impact. With real user monitoring, application performance insights, and comprehensive analytics, New Relic equips organizations with tools to monitor and optimize the end-user experience.
It offers support for multiple languages, frameworks, and environments, including cloud, on-premises, and hybrid environments, and provides customizable dashboards and alerts for tracking performance metrics.
New Relic App:


20. Elastic Observability
Elastic Observability is a monitoring and network observability solution that provides real-time insights into application performance, infrastructure, and logs. The platform's strengths in log and metric analysis, coupled with its scalability, ensure prompt detection and resolution of performance issues, delivering a seamless digital experience for end-users across diverse network environments.
It offers support for multiple technologies and integrations, including AWS, Azure, and GCP, and provides customizable dashboards and alerts for tracking performance metrics. Elastic Observability's cloud monitoring services enable users to monitor their entire stack, from infrastructure to application performance, and analyze data in real-time to identify issues and troubleshoot problems.
Elastic Observability App:


Top 6 External End User Monitoring Tools (Customer-Focused)
When it comes to delivering exceptional user experiences to customers, organizations rely on external End User Monitoring (EUM) tools. These tools focus on tracking and optimizing the experiences of customers while they interact with websites, applications, and other digital touchpoints. By capturing crucial user behavior data and performance metrics, these EUM tools empower businesses to gain insights into customer preferences, identify areas for improvement, and enhance overall customer satisfaction.
In this section, we will explore the top 6 External End User Monitoring tools that have gained popularity in the industry. We will dive into their key functionalities, benefits, and use cases, providing organizations with the information needed to choose the right tool that aligns with their customer monitoring objectives. With these tools, businesses can gain a comprehensive understanding of customer behavior, optimize digital experiences, and drive customer loyalty. Let's discover the leading external EUM tools that enable businesses to put their customers at the center of their digital strategies.
Here are some of the top web app analytics tools used in the industry:
Google Analytics: Google Analytics is one of the most popular and widely used web analytics tools. It provides comprehensive insights into website traffic, user behavior, conversion rates, and more. With a user-friendly interface and robust reporting capabilities, it helps businesses understand their audience, track key metrics, and optimize their web app's performance.
Adobe Analytics: Adobe Analytics is a powerful analytics platform that offers deep insights into user behavior and engagement. It provides real-time data, advanced segmentation, and customizable dashboards to help businesses understand their customers and make data-driven decisions. Adobe Analytics also integrates well with other Adobe marketing tools, allowing for a seamless end-to-end analytics and marketing workflow.
Mixpanel: Mixpanel is a user-centric analytics tool that focuses on tracking and analyzing user actions and events within web apps. It enables businesses to understand user journeys, retention rates, and conversion funnels. Mixpanel provides powerful segmentation capabilities and cohort analysis, allowing businesses to target specific user groups and measure the impact of product changes or marketing campaigns.
Heap Analytics: Heap Analytics offers an automated approach to web app analytics. It automatically captures user interactions and events, providing a detailed view of user behavior without requiring manual event tracking. Heap Analytics offers retroactive analytics, allowing businesses to analyze user data retrospectively and gain insights even for events that were not initially tracked.
Amplitude: Amplitude is a user behavior analytics platform that helps businesses understand how users engage with their web apps. It provides advanced analytics features such as user segmentation, funnels, retention analysis, and A/B testing. Amplitude offers a user-friendly interface and focuses on providing actionable insights for product teams to drive product improvements and growth.
Piwik PRO: Piwik PRO is an open-source web analytics platform that offers privacy-focused analytics solutions. It provides comprehensive data tracking and reporting features while allowing businesses to maintain full control over their data and comply with data privacy regulations. Piwik PRO offers flexible deployment options, including on-premises and cloud-hosted solutions.
These top web app analytics tools offer a range of features and capabilities to help businesses track user behavior, understand audience demographics, optimize conversions, and improve overall web app performance. Choosing the right analytics tool depends on specific business needs, data privacy requirements, and the level of analytics sophistication desired.
Conclusion: Empowering Digital Success through End User Monitoring Tools
In this article, we explored the world of End User Monitoring (EUM) tools and their crucial role in enhancing user experiences. We discussed the two categories of EUM tools, namely internal and external, highlighting their respective functions and how they contribute to optimizing digital performance.
By understanding the functions and capabilities of EUM tools, organizations can make informed decisions to select the right solutions that align with their specific monitoring requirements. Whether focusing on internal employee experiences or external customer interactions, these tools provide invaluable insights into user behavior, performance metrics, and system health.
We hope that this article has provided you with valuable information about the top 6 Internal End User Monitoring tools and the top 6 External End User Monitoring tools available in the industry. By exploring their key features, advantages, and use cases, we aim to have helped you in your search for the right solution to monitor and enhance user experiences within your organization.
Remember, choosing the right EUM tool is a crucial step in driving business success, customer satisfaction, and employee productivity. Continuously monitoring and optimizing user experiences will enable your organization to stay ahead in the digital landscape and deliver exceptional results.
We wish you the best of luck in finding the perfect EUM tool that meets your specific needs and helps you unlock the full potential of your digital systems.
This page is compiled from the information available on the software’s official website. We have made every attempt to ensure the accuracy and reliability of the information provided in this article. However, the information is provided “as is” without warranty of any kind. Obkio is not liable for any inaccuracies in the article due to changes made on their websites or any development made to their products after the date of publication of this article. Please refer to their websites for more information.
