


Table of Contents
Table of Contents
It's 2 AM. The Network Is Down. Where Do You Start?
You get the call. Users can't connect. VoIP is choppy. Something is broken somewhere between your office and the cloud. You open your monitoring dashboard and it says something is wrong, but not where. Not why. Not since when?
So you do what IT teams have done for decades. You open a terminal, run a traceroute, SSH into the router, pull up SNMP, check the firewall logs. You correlate timestamps manually across four different tools that don't talk to each other. 45 minutes later (if you’re lucky), you find it: ISP congestion at hop 4. The kind of thing that should have taken two minutes.
This is manual network troubleshooting in 2026. And it's still the default for most IT teams.
This article breaks down why that's a problem, what automated network troubleshooting actually looks like in practice, and what the next step in the evolution (auto-diagnosis) means for IT professionals managing modern networks.
What Is Network Troubleshooting (And Why Is It Still So Hard)? 
At its core, network troubleshooting is the process of identifying, diagnosing, and resolving network performance issues like latency, packet loss, jitter, downtime, and anything else that degrades the user experience.
In theory, it's straightforward. In practice, it's a detective job. And the reason it's still so hard, even with sophisticated monitoring platforms in the stack, comes down to three structural problems.

- First, the data is siloed. Ping lives in one tool. Traceroutes in another. SNMP device metrics somewhere else. Firewall logs in their own interface. Each tool captures a piece of the puzzle. Nobody assembles the puzzle for you automatically.
- Second, most monitoring tools tell you that something is wrong, not why or where. An alert fires. Packet loss is above threshold. Great, but is it your LAN? Your WAN? The ISP? A misconfigured firewall? A CPU-spiking router? The alert doesn't say. That's where the manual work begins.
- Third, the problem is often intermittent, and may have already resolved itself by the time you start investigating. You're left chasing a ghost. No live symptoms. Just user complaints and the sinking feeling that it'll happen again tomorrow.
The result is long mean time to resolution (MTTR), frustrated users, and IT teams spending more time playing network detective than actually managing infrastructure.
What Are the Hidden Costs of Manual Network Troubleshooting?
Before making the case for automation, it's worth being honest about what manual troubleshooting actually costs, because most organizations drastically undercount it.
1. Time cost:
A single network incident requiring manual cross-tool investigation can eat one to 3 to 4 hours of a skilled engineer's day. Multiply that across recurring incidents in a multi-site business environment, and you're looking at a significant and measurable drain on IT productivity every month.
2. Human cost:
Alert fatigue is real. Engineers who spend their days context-switching between dashboards, correlating data manually, and chasing intermittent ghosts burn out. The best people leave. The less experienced ones make mistakes under pressure.
3. Business cost:
Downtime isn't an IT problem, it's a business problem. Depending on your industry, an hour of network downtime can mean thousands to hundreds of thousands of dollars in lost productivity, missed transactions, or SLA violations. Every minute of inflated MTTR is a cost your organization absorbs.

4. The blame game.
This one is underappreciated. Without correlated data, every major incident degenerates into an "is it the network or the application?" standoff. Network teams point at the app team. App teams point at the ISP. Nobody has proof. Nobody moves fast. Relationships fray. Resolution stalls. This is one of the most concrete productivity killers in IT, and it's almost entirely a data problem.
What Manual Troubleshooting Actually Looks Like (A Real Scenario)
Here's a scenario anyone who's worked in network ops will recognize.
A user calls the helpdesk. VoIP quality is terrible on calls to the remote branch. The helpdesk escalates to the network team. The network engineer logs in, runs a manual traceroute to the branch, opens the SNMP dashboard to check router CPU and interface utilization, pings the gateway, and pulls up the firewall logs.
Each tool has its own interface. The SNMP data is five minutes old. The traceroute is running live, but the issue was happening an hour ago during a call. The timestamps don't align. The firewall shows nothing anomalous. The traceroute looks clean since the congestion event already resolved.
The engineer spends 45 minutes to conclude: probable ISP congestion at a specific hop during business hours, but no hard evidence because nothing captured it in real time.
That conclusion was always available in the data. It just required someone to manually connect the dots, and the tools didn't make it easy.
This is the ceiling of manual troubleshooting. Skilled people, doing repetitive detective work with several different tools, on problems that should resolve themselves.

Learn the essential steps to troubleshoot network issues effectively. Start with Obkio's Network Performance Monitoring tool for comprehensive network insights.
Learn moreWhat Is Automated Network Troubleshooting, Really?
Let's be precise about what "automated network troubleshooting" actually means, because it's a phrase that gets overloaded quickly.
It doesn't mean setting up auto-solving scripts that restart services on alert. It doesn't mean a smarter alerting system. And it's not just continuous monitoring, though that's part of it.
Automated network troubleshooting means your network monitoring infrastructure continuously collects data from multiple sources (NPM sessions, traceroutes, SNMP, speedtests, application performance, and agent system stats) and cross-references those sources when degradation is detected. The output isn't more raw data. It's a diagnosis.
The key distinction: automation doesn't remove humans from the loop. It removes the detective work from humans so they can focus on decisions.
The difference is significant. Today, IT professionals receive an alert and then spend time figuring out what it means. In an automated model, the platform does that work, and surfaces a probable cause, correlated across data sources, already contextualized. The engineer walks in and makes a decision, not a deduction.
That shift (from deduction to decision) is where the real value of automation lives.
What Are the Key Benefits of Automating Network Troubleshooting?
Once you understand what automation actually changes, the benefits follow directly.
Automated Network Troubleshooting Benefit #1: Faster Issue Detection
Continuous monitoring catches degradation before users notice it. You don't wait for a helpdesk ticket to know something's wrong. The system is always watching, always measuring, in both directions, from every agent location. This is reached through always-on synthetic traffic between monitoring agents, not polling on a timer, but continuous measurement that captures even brief, sub-minute performance events that traditional tools never see.
Automated Network Troubleshooting Benefit #2: Reduced MTTR
When a problem hits and data is automatically correlated across sources, you get a probable cause in seconds instead of hours. This is the single most impactful operational improvement most network teams can make.
It's reached by having all your data sources (NPM, traceroutes, SNMP, speedtests) feeding into a single platform that correlates them automatically at the moment an issue is detected. By the time you see the alert, the investigation is already done.
Automated Network Troubleshooting Benefit #3: Less Noise, More Context
Manual environments generate a flood of disconnected alerts. Automated platforms correlate events and surface a single coherent diagnosis instead of fifty individual threshold breaches. Engineers stop drowning in noise and start responding to meaningful information. This happens because the platform understands context: it groups related events, filters out transient spikes, and only escalates when the correlated picture points to a real, actionable problem.
Automated Network Troubleshooting Benefit #4: No More Blame Games.
When your platform correlates network metrics with application performance data simultaneously, "is it the network or the app?" becomes a question your data answers, not a political debate. You can show exactly what happened, where, and when. This is reached by monitoring both layers (network and application) in parallel, so when a user reports that Teams is broken, you already know whether the path to Microsoft is degraded or whether Teams itself is the issue. That's not just operationally useful. It changes team dynamics.
Automated Network Troubleshooting Benefit #5: Scales As Your Network Grows
Manual troubleshooting doesn't scale. Adding a new site, a new cloud region, or a new remote user population multiplies the manual workload. Automated troubleshooting scales linearly: more agents, more sessions, same operational overhead. A distributed agent architecture is what makes this possible: lightweight agents deployed at every network location continuously report back to a central platform, so scaling coverage is a matter of deployment, not operational complexity.
Automated Network Troubleshooting Benefit #6: Proactive IT Response
The biggest shift is cultural. Manual troubleshooting is inherently reactive: you respond to problems users already feel. Automated, continuous monitoring with anomaly detection lets you catch degradation trends before they become outages. This is reached by establishing baselines automatically over time and flagging deviations before they cross user-impact thresholds. You stop firefighting. You start preventing.

What Data Sources Does Automated Troubleshooting Need?
This is where the technical architecture matters. Automated troubleshooting isn't just continuous monitoring, it's continuous monitoring across multiple correlated data sources. The power isn't in any single source. It's in what you see when they're cross-referenced automatically.
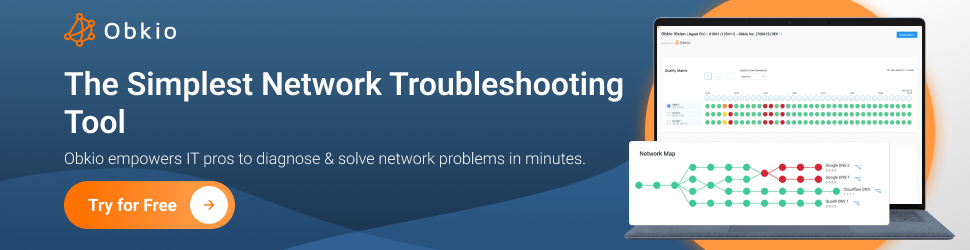
To make this concrete, let's walk through it using Obkio as the example. Obkio is a SaaS network performance monitoring and troubleshooting platform built specifically for this kind of multi-source visibility.

It deploys lightweight monitoring agents at every network location (offices, data centers, cloud environments, and remote user endpoints) that continuously exchange synthetic traffic to measure performance between any two points. Every agent feeds data back to Obkio's platform in real time, where it's stored, visualized, and (with Obkio Insight coming up) automatically correlated when issues are detected.

The key design principle is that Obkio doesn't just monitor your devices. It monitors your network paths, your applications, your ISP connections, and your end-user experience simultaneously. That's what makes cross-source correlation possible: all the data lives in one place, collected continuously, and tied to the same timeline.
Here's what that looks like across each data source Obkio covers, and why each one matters for automated troubleshooting:
- NPM (Network Performance Monitoring): The foundation and the trigger. Continuous synthetic traffic between monitoring agents measures latency, packet loss, jitter, and throughput between every network segment: LAN, WAN, ISP, cloud. This is what detects degradation and kicks off the correlation chain.

- Visual Traceroute: When the NPM session flags an issue, traceroutes identify which specific hop in the path is the source. The difference between a traceroute run on-demand and a triggered traceroute launched automatically the moment degradation occurs is the difference between catching the problem and chasing a ghost. Obkio's triggered traceroutes fire automatically when a network event is detected, so by the time you see the alert, the route data is already there.
- SNMP (Network Device Monitoring): Device-level context. CPU utilization, interface errors, bandwidth saturation on routers, switches, and firewalls. SNMP tells you whether the issue is inside your infrastructure or upstream. Combined with NPM and traceroute data, it separates device problems from path problems.

- Speedtests: ISP-level throughput validation in real time. When your NPM shows latency spikes, speedtests confirm whether it's a capacity problem at the ISP layer. This is the data that ends the "is it us or is it them?" conversation with your service provider.
- Agent System Stats: Rules out the endpoint. If a user reports poor performance and the network metrics look clean, agent system stats (CPU load, memory, resource contention) will flag whether the issue is the machine, not the connection.

- APM (Application Performance Monitoring): Separates network-layer issues from application-layer issues. This is the last mile of correlation. When a user says "Teams is terrible," your platform needs to determine whether Teams is the problem or the network delivering Teams is the problem. That requires monitoring both.
When these data sources are continuously collected and automatically cross-referenced at the moment of a network event, you stop troubleshooting. You start reading a diagnosis.

What to Look for in an Automated Network Troubleshooting Tool
Not all platforms that claim to offer automated troubleshooting actually deliver it. Here's what to look for when evaluating tools, and what separates meaningful automation from marketing.
1. Continuous Network Monitoring, Not just Polling
A tool that samples every five minutes will miss most intermittent issues. Look for platforms that measure continuously, with sub-second granularity. Obkio's monitoring agents exchange synthetic UDP traffic every 500ms, the frequency needed to catch the kind of brief congestion events that traditional polling misses entirely.
2. Multi-source Data Collection and Correlation
The tool needs to collect NPM, traceroute, SNMP, speedtest, and application data natively, not through integrations that require manual setup and correlation. If you're still stitching data together manually, you haven't automated anything.
3. Automatic Correlation, Not Another Dashboard
The distinction is critical. A dashboard that displays all your data in one place is useful. A platform that automatically correlates that data when an issue is detected and surfaces a diagnosis is transformative. Know which one you're buying.
4. Identification of a Probable Root Cause
The tool should tell you what's wrong in plain language, not hand you a wall of metrics and leave the interpretation to you.
5. Easy Deployment
A troubleshooting platform that takes weeks to deploy and tune is a platform that won't get deployed properly. Look for agent-based architectures that are up and running in minutes, across every type of network location: offices, cloud, branch, remote users.
6. End-user Perspective Monitoring
Most traditional monitoring tools are infrastructure-centric. They watch your devices and interfaces. The problem is users don't experience devices, they experience applications and connections. Your troubleshooting tool needs visibility from where the user sits, not just from the data center.

Discover the top 30 tools to troubleshoot network issues, from basic solutions to advanced network troubleshooting tools. Find the best fit for your needs.
Learn moreThe Future of Network Troubleshooting Tools: From Troubleshooting to Auto-Diagnosis
The industry's trajectory is clear:
network monitoring → observability → auto-diagnosis.
Most IT teams are still somewhere in the first two stages. They have monitoring. Some have moved toward observability: correlating more data sources, gaining broader visibility. But the gap between observability and auto-diagnosis is still significant for most tools on the market. They show you everything. They still make you figure it out.
That gap is exactly what Obkio Insight is designed to close.
Insight is Obkio's upcoming automated diagnostics engine, which is built on 25+ years of accumulated networking expertise. When a network issue is detected by your NPM sessions, Insight automatically cross-references data from traceroutes, SNMP, speedtests, agent system stats, and application performance monitoring simultaneously, and surfaces a diagnosis.

Not a correlation heatmap. Not a multi-dashboard view. An actual answer: what's wrong, where it is, when it started, and who's responsible for fixing it.
Obkio's goal is that IT professionals who aren't deep network specialists should still be able to pinpoint a problem's source without running manual investigations. That's the real benchmark for auto-diagnosis, not making expert engineers faster, but making network intelligence accessible to everyone managing infrastructure.
Insight completes Obkio's evolution from a network performance monitoring tool to a full network monitoring, observability, and diagnostics platform. It's the layer the industry has been building toward for years.
Obkio Insight is coming soon.
The Bottom Line: How to Automate Network Troubleshooting
Automating network troubleshooting sounds like a major infrastructure project. It isn't. With the right tool, it's easier than you think, and Obkio's Network Monitoring & Diagnostic Tool is built specifically to make it that way.
The process is straightforward. Deploy Obkio's monitoring agents at your key network locations: head office, branch sites, cloud environments, remote users. It takes minutes, not weeks. From that point, Obkio is continuously collecting the data you need: NPM session metrics, triggered traceroutes, SNMP device stats, speedtests, and application performance: all in one place, all on the same timeline.
That foundation is what makes automation possible. You're not reconfiguring your network. You're not replacing your existing tools overnight. You're adding a continuous, correlated visibility layer that does the detective work for you the moment something goes wrong.
Manual troubleshooting isn't a skills problem. It's a tooling problem. The data needed to resolve most network issues is already being generated, it just isn't being correlated automatically. Obkio fixes that. The result is a faster, less painful, more proactive approach to network operations, and an IT team that spends its time making decisions, not playing detective.
Start with a free 14-day trial. No credit card. No week-long onboarding. Just deploy, monitor, and see how much faster troubleshooting gets when your tools actually work together.
- 14-day free trial of all premium features
- Deploy in just 10 minutes
- Monitor performance in all key network locations
- Measure real-time network metrics
- Identify and troubleshoot live network problems


