


Table of Contents
Table of Contents
In 2016, Obkio was just an idea, but it was an idea born from a real problem.
Before writing a single line of code, we conducted a market audit to understand why Network Performance Monitoring solutions weren't more mature. We interviewed banks, manufacturing companies, and service providers, and the answer was unanimous: the NPM tools on the market were too complex, and most businesses simply didn't have the internal resources to dedicate full-time to managing them.
If that was true for enterprise customers in 2016, it was even more true for smaller companies with fewer network engineers and IT specialists on their teams. That gap is exactly where Obkio was born.
Our mission was clear from day one: build the simplest Network Performance Monitoring tool that gives businesses real-time insight into network quality, not just up/down status. We didn't want to build just a network monitoring tool. We wanted to build a network diagnostic tool. But to get there, we first had to build the foundation.
Building A Next-Gen Network Monitoring Solution 
Network Performance Monitoring
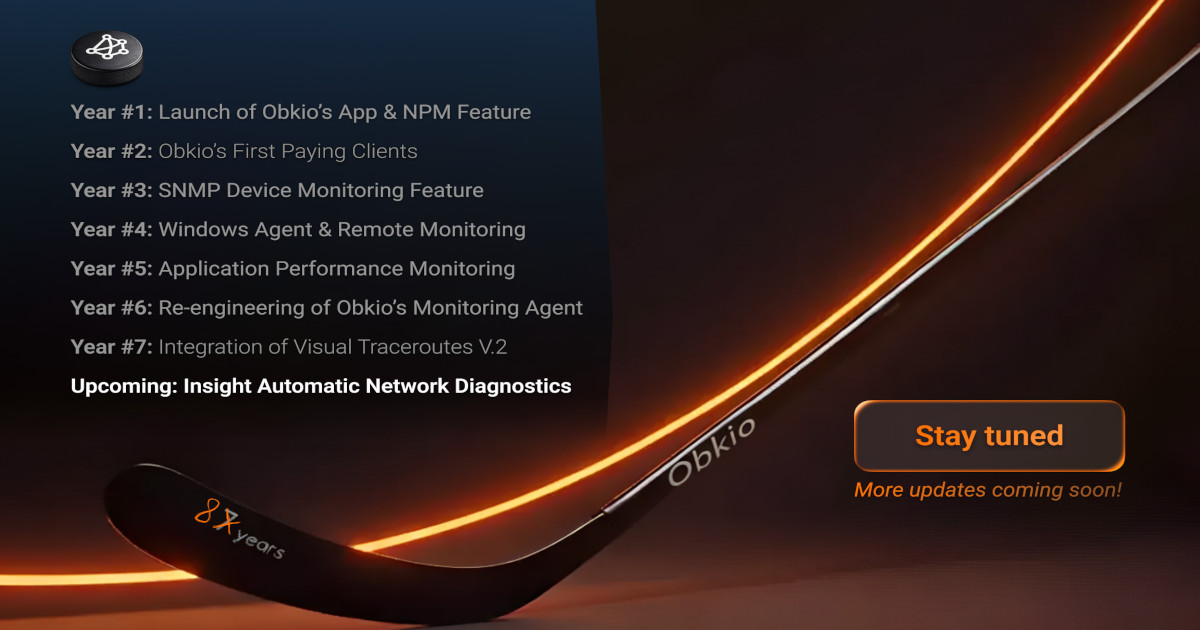
Our first flagship feature was Network Performance Monitoring, and it genuinely disrupted the market. Finally, we had a solution that didn't just report on network status, but generated and measured synthetic traffic to monitor the overall health of the network in real-time. Obkio could identify whether a performance issue existed and pinpoint exactly where it was happening.

SNMP Device Monitoring
From there, we built SNMP Device Monitoring. By correlating SNMP data with synthetic traffic moving through network devices, we could finally see the real-time impact of bandwidth or CPU spikes on a router's ability to handle traffic. It was a meaningful leap forward.
The sum of all the features was bigger than everything we had seen before in all other Network Performance Monitoring solutions that we were used to.

Traceroutes & Obkio Vision
But we still had a blind spot: issues that originated further down the Internet. So we built our first Traceroute feature, running tests every 10 minutes, then every 2 minutes with triggered traceroutes. But it still wasn't enough; we needed real-time traceroute data. That's when we created Obkio Vision, our Visual Traceroute Tool, reinvented to be simpler and more visually appealing than ever before. This reinvention of every IT pro's favourite troubleshooting tool added so much value to Obkio by allowing us to identify network issues over the Internet.

Application Performance Monitoring
Next, we knew we wanted to be able to identify performance issues between a user and a service, and pinpoint if an application was causing the issue. So we added our Application Performance Monitoring feature, which uses HTTP to monitor DNS and the applications that people use via HTTP.
We also knew that the applications most sensitive to performance issues are audio and video, so we worked on the interpretation of the MOS score to understand how voice is affected by the key network metrics we measure, like packet loss, latency, and jitter.
Speed Test Tool
We also knew how much people value being able to measure speed, even if we don't think it's the best indicator of network health on its own. Network speed is really just the sum of all the metrics we measure. But because speed tests give users a useful overview of their network, we created our advanced Speed Test Tool. With it, users can schedule speed tests, get a full history of network speed, view results using visual graphs, and generate reports to challenge the quality of service offered by ISPs in their SLAs.

Reporting & Integrations
After that, we wanted to simplify monitoring for customers with many sites, who traditionally were forced to use complex tools to oversee their large infrastructures. So we developed reports that could be integrated with BI systems to see, at a high level, what issues are happening across networks and which events matter most. These reports were integrated with webhooks, Slack, Microsoft Teams, and PagerDuty.
Custom Dashboards
Throughout the years, we worked hard with UI/UX designers so that, despite the complexity of what we measure, our interface stayed lean and simple to use. But at this point, the diagnostic process was still manual. To facilitate that process, we created dashboards to visualize all the key metrics from the point of view of a site, side-by-side on a custom dashboard.

Visual Traceroute Tool V.2
To give users even more data to troubleshoot performance issues, we reinvented traceroutes again and released Obkio's Visual Traceroute Tool V.2, now officially integrated into Obkio's app and available to add to dashboards alongside other network data.
It was the troubleshooting tool we always dreamed of. And when we planned for it, it wasn't just about updating the interface. We optimized it to bring all the traceroute data into Obkio's backend, making it the last layer of data we needed to reach our ultimate goal: automatic diagnostics.

Monitoring Agent V.2
Behind the scenes, we also knew we needed many new features to get to our automatic diagnostics engine, which meant updating the core of Obkio's solution. So we re-engineered the Monitoring Agent. After four years of work, Agent V.2 is available for everyone, developed in Go for multi-threading to run tests from many data points in parallel, and built to add even more tests in the future without adding extra load on the agent or requiring customers to install it on larger machines.
Each of these features was meaningful on its own. Together, they were building toward something bigger.
The Feature We Always Dreamed Of: Automatic Network Diagnostics
For Obkio's team, with over 25 years of experience in networking, troubleshooting feels intuitive. But we always knew that for IT professionals who don't specialize in networking, the diagnostic process can be overwhelming. People told us they didn't know how to interpret the data. The process was manual, time-consuming, and too often got in the way of everything else on their plate.
Many IT and network pros hate troubleshooting because they simply don't have time for it. So many other tasks compete for attention, and troubleshooting operational issues usually sidetracks them from projects seen as higher priority for business growth.
That's the problem we set out to solve with Obkio Insights, our Automatic Network Diagnostics feature and our biggest launch yet.
Insight, which will be released soon, automates the diagnostic process using a correlation engine built on 25 years of networking expertise. It analyzes data across multiple sources simultaneously, including NPM, SNMP, Traceroute, and Destinations, to identify the root cause of network issues in seconds, not hours.
The goal is simple: IT professionals who aren't network specialists should still be able to pinpoint whether there's a problem, when it happened, where it originated, and who is responsible for fixing it. Insight makes that possible.
Eight Years In, and Just Getting Started
Obkio is turning 8, and this birthday feels different.
After years of building layer by layer, with each feature laying the groundwork for the next, we've finally built what we always set out to create. With the launch of Insight: Automatic Network Diagnostics, Obkio completes its evolution from a Network Monitoring and Troubleshooting tool into a complete Network Monitoring, Observability, and Diagnostics platform.

We can now confidently say that we've built the simplest, most accessible Network Monitoring, Observability, and Diagnostics tool available for enterprises, small businesses, IT pros, and seasoned network engineers alike.
This has always been the dream. Thank you for being part of the journey.


