Table of Contents
Table of Contents
A decade ago, network monitoring was straightforward. You had a data center, some branch offices, MPLS circuits connecting everything, and a handful of applications running on-premises. Set some SNMP thresholds, configure a few alerts, and you were covered. When something broke, the problem was usually obvious: a failed switch, a saturated link, a misconfigured router.
Today's networks bear zero resemblance to that world.
You're managing a hybrid infrastructure with workloads split between on-premises data centers and three different cloud providers. Your "office" is 200 employees working from home on residential ISPs you don't control. Your critical applications run as SaaS services on someone else's infrastructure. Data takes unpredictable paths through the public internet, bouncing through transit providers and peering points you've never heard of.
And your old monitoring tools? They're still doing exactly what they were designed to do: collecting metrics, checking thresholds, firing alerts. The problem is that knowing your latency jumped to 200ms or your packet loss hit 5% doesn't tell you anything actionable anymore. Is it your ISP? Their ISP? A routing change somewhere in the middle? Congestion at a peering point? A problem in the cloud provider's network?
Traditional monitoring tells you what happened. Modern networks require you to understand why it's happening, where the problem originates, and how to fix it, ideally before your users even notice.
This is why the industry is shifting from reactive network monitoring to proactive network observability. Not because network monitoring is obsolete, but because the questions we need to answer have fundamentally changed.
When networks were simple, "Is it up or down?" was enough. When networks are complex, distributed, and business-critical, you need "Why is it behaving this way, and what do I do about it?"
This article breaks down the practical differences between network monitoring and network observability, explains when you need each approach, and shows how platforms like Obkio evolved from traditional network monitoring to true network observability by adding the capabilities that actually answer the questions IT teams are asking.
Network monitoring is the practice of continuously collecting performance metrics from your network infrastructure and alerting you when those metrics cross predefined thresholds. It's been the foundation of network management for decades, and it does exactly what it says on the tin: it monitors your network.
At its core, traditional network monitoring answers a simple question: "Is my network working within acceptable parameters right now?"
Network monitoring tools gather quantitative data about network performance: bandwidth utilization, latency, packet loss, jitter, device uptime, interface status, and CPU/memory usage on network equipment. These metrics are typically collected via SNMP polling, NetFlow/sFlow analysis, or ICMP pings at regular intervals, every 30 seconds, every minute, every five minutes, depending on your configuration.
The data tells you what's happening numerically. Your WAN link is running at 85% capacity. Latency to your data center is 45ms. Packet loss on your ISP connection is 0.2%. Your core switch has been up for 127 days.
Once you're collecting metrics, you set thresholds that define "normal" versus "problem." When bandwidth exceeds 90%, send an alert. When latency crosses 100ms, send an alert. When packet loss goes above 1%, send an alert. When a device goes down, definitely send an alert.
This is reactive by design. The alert fires after the metric crosses the threshold, which means after the problem has already started impacting your network. You're notified that something is wrong, but the notification itself doesn't tell you why it's wrong or what to do about it.
Traditional monitoring captures snapshots of network health at specific intervals. You get a data point every minute showing current conditions, and over time those data points form a graph showing trends and patterns. You can look back historically and see that latency spiked at 2:47 PM yesterday, or that bandwidth usage has been climbing steadily over the past month..
Network monitoring remains fundamental to network management, it's not being replaced by observability, it's being enhanced by it. In fact, the continuous metric collection that monitoring provides is the foundation that makes observability possible.
- Monitoring excels at critical tasks that every network operation depends on:
- Tracking known issues: If you know bandwidth saturation is your recurring problem, monitoring catches it reliably every time. There's no substitute for straightforward threshold alerts when you're managing predictable, well-understood issues.
- Device health: SNMP monitoring effectively tracks hardware status, interface errors, and resource utilization. This visibility into device-level performance remains essential for maintaining infrastructure health and catching hardware problems before they cause outages.
- Capacity planning: Historical metrics data helps you identify growth trends and plan infrastructure upgrades. Long-term performance data collected through monitoring gives you the quantitative foundation for making smart investment decisions about network capacity and architecture.
- Compliance: Many regulatory frameworks require logging and alerting, which monitoring handles well. The audit trail and alert documentation that monitoring systems provide are often explicitly required for compliance purposes.
- The foundation for observability: Most importantly, the continuous performance metrics that monitoring collects (latency, packet loss, jitter, throughput) are the raw data that observability platforms analyze to provide diagnostics and insights. You can't have observability without solid monitoring underneath.
Discover everything you need to know about network monitoring. Explore tools, best practices, metrics, and more to optimize your network's performance.
Learn more

Network observability goes beyond collecting metrics and firing alerts. It provides deep, contextual visibility into network behaviour that enables you to understand not just what is happening, but why it's happening and where problems originate.
If monitoring answers "Is my network working?", observability answers "Why is my network behaving this way, and what do I do about it?"
The distinction isn't semantic. It's architectural. Observability platforms are built around the assumption that you can't predict every problem you'll encounter, so instead of relying on preconfigured alerts for known issues, they provide the visibility and diagnostic capabilities to investigate unknown issues as they arise.
Network Observability doesn't just collect network metrics, it collects rich contextual information about how data moves through your network. This includes complete path visibility showing every hop between source and destination, routing information, response times at each network segment, and behavioural patterns that reveal how performance changes over time and across different paths.
When latency spikes, you don't just see the number. You see which specific hop in the path introduced the delay, whether it's consistent or intermittent, and whether other paths to the same destination are experiencing similar issues. You get the story behind the metric.
Network Observability platforms provide continuous, real-time monitoring of network behaviour, not just periodic snapshots. This means you can see exactly when performance degraded, how it progressed, and what the network path looked like before, during, and after the issue.
This continuous visibility extends to historical analysis as well. You can rewind and see exactly what the network was doing at any point in time, compare current behaviour to past patterns, and identify whether an issue is new or recurring. The data density is high enough to catch intermittent problems that might slip between the five-minute polling intervals of traditional monitoring.
Rather than waiting for problems to cross threshold limits, observability platforms identify patterns and anomalies that indicate developing issues before they become critical. Gradual latency increases, subtle routing changes, emerging packet loss patterns, these early warning signs get flagged and analyzed before they impact users.
This shifts IT teams from firefighting mode to proactive management. You're not just responding to outages. You're identifying performance degradation trends and addressing them during business hours instead of at 2 AM when everything finally breaks.
This is where observability delivers its most significant value. Instead of receiving an alert and then spending hours manually investigating with multiple tools like traceroutes, ping tests, log analysis, calling your ISP, observability platforms provide built-in diagnostics that shows all network data in one dashboard, showing exactly where problems originate.
Discover the power of network observability and monitoring. Learn how to implement them effectively and leverage Obkio's Network Monitoring tool for success.
Learn more

True network observability rests on three foundational capabilities:
1. Network Metrics: Continuous Performance Data
Like network monitoring, network observability collects performance metrics like latency, packet loss, jitter, throughput. But the collection is continuous and granular, providing real-time visibility into network behaviour as it changes second by second. This data density enables you to see exactly when issues start, how they evolve, and when they resolve.
2. Path Visibility: Understanding the Complete Journey
This is what separates network observability from network monitoring. You need visibility into the complete path data takes across your network and through infrastructure you don't control. Every hop. Every routing decision. Every handoff between providers.
Path visibility shows you not just that latency is high, but that it's high specifically at hop 7 where your ISP hands off to a transit provider. Not just that packet loss exists, but that it's occurring at a specific router in the cloud provider's network. Not just that performance degraded, but that it happened immediately after a routing change that rerouted traffic through a different path.
Without path visibility, you're troubleshooting blind. With it, you know exactly where to focus your investigation and who to contact, your ISP, the cloud provider, or your own infrastructure team.
3. Automatic Diagnostics: Intelligent Root Cause Analysis
Collecting metrics and seeing network paths is valuable, but the real breakthrough is automatic diagnostics, intelligent analysis that correlates all this data and identifies root causes in one unified dashboard.
Instead of spending two hours running tests and analyzing data, you get the answer in minutes. That's observability. Not just data, answers.
The fundamental difference between network monitoring and network observability isn't just about the data you collect. It's about how quickly you can act on it.
Monitoring tells you WHAT is happening. Latency increased. Packet loss detected. Bandwidth threshold exceeded. These are valuable signals, but they're just the starting point.
Observability tells you WHY it's happenin.g Network Monitoring might alert you to increased latency. Observability shows you it's happening at hop 7 in your ISP's network, provides the visual traceroute proving it, and gives you the documentation needed to escalate effectively to your provider.

Both monitoring and observability can detect issues, but the path from detection to resolution differs dramatically:
With monitoring alone:
- Alert fires: "Latency increased to 150ms"
- Check dashboard: "Yes, latency is high"
- Where exactly? "Need to run manual traceroutes"
- Why is this happening? "Need to test from multiple locations"
- Is it our network or the ISP? "Need to gather more data"
- Time elapsed: 30-90 minutes (or more)
With observability:
- Alert fires: "Latency increased to 150ms"
- Check dashboard: Path analysis shows degradation at specific ISP hop
- Automatic diagnostics confirm: "Routing issue at provider network, evidence attached"
- Time elapsed: 2-5 minutes
The easiest way to understand the practical differences between network monitoring and network observability is to look at how each approach handles the same network scenarios. The contrast becomes obvious when you're staring at a performance issue and need answers.
- Network Monitoring: "Is my network up or down? Are my metrics within acceptable ranges?"
Network Monitoring is built around binary states and threshold checks. Your circuit is up or it's down. Latency is acceptable or it's not. Packet loss is below 1% or it's above 1%. The questions monitoring answers are fundamentally about status.
- Network Observability: "Why is my network behaving this way? What's causing this performance pattern?"
Network Observability is built around understanding behaviour and causation. Why did latency suddenly increase? What changed in the network path? Why is performance degrading gradually over time? The questions observability answers are fundamentally about context and cause.
This difference in approach shapes everything else about how these systems work and what value they deliver.
- Network Monitoring: Threshold-based alerts
You define the thresholds that represent "problem" states, and the system alerts you when metrics cross those lines. Latency above 100ms? Alert. Packet loss above 1%? Alert. Bandwidth utilization above 90%? Alert.
The strength of this approach is simplicity and predictability: you know exactly what will trigger an alert. The weakness is that you only catch problems you've explicitly configured alerts for, and those alerts fire after the problem has already started. You're also vulnerable to alert fatigue when thresholds are too sensitive, or to missed issues when thresholds are too lenient.
- Network Observability: Pattern recognition and anomaly detection
Observability platforms analyze network behaviour continuously, comparing current performance against historical baselines and identifying anomalies that indicate developing issues. You don't need to predict every possible problem and configure an alert for it.
A gradual latency increase that never crosses your 100ms threshold but represents a 40% degradation from normal? Observability catches it. An intermittent packet loss pattern that averages below your 1% threshold but spikes periodically? Observability flags it. A routing change that doesn't violate any thresholds but changes network behaviour? Observability notices it.
This approach catches unknown problems and subtle degradation that threshold-based monitoring misses entirely.
- Network Monitoring: Manual investigation required
An alert fires. Now what? You start investigating with whatever tools you have available, running traceroutes, checking device logs, analyzing interface statistics, testing from different locations, calling your ISP. You're piecing together clues to figure out where the problem is and what's causing it.
This process takes time, anywhere from 30 minutes to several hours, depending on issue complexity and network architecture. If the problem is intermittent, you might not be able to reproduce it during your investigation. If it's in infrastructure you don't control (ISP, cloud provider, Internet backbone), you're troubleshooting mostly blind until you can convince the provider to investigate on their end.
- Network Observability: Built-in diagnostics guide you to the root cause
When observability detects an issue, it doesn't just alert you, it shows the available data and helps to identify the root cause. The platform shows you exactly which network hop is introducing latency, whether packet loss is occurring at your ISP or further upstream, and whether the problem is routing-related, congestion-related, or hardware-related.
Instead of spending an hour investigating, you get the answer immediately: "Latency increased at hop 6, which is your ISP's gateway router. The problem started at 14:23 when traffic was rerouted to a secondary path. Packet loss is 3% at this specific hop and 0% everywhere else."
You're not troubleshooting. You're reading the diagnosis and taking action. This reduces MTTR from hours to minutes.
- Network Monitoring: Known issues you've configured alerts for
Monitoring excels at answering "Is there a problem?" through continuous collection of performance metrics. You can track latency, packet loss, jitter, and bandwidth utilization over time, set thresholds for expected behaviour, and receive alerts when things go wrong.
You can also discover unexpected issues by analyzing trends and historical data, even without pre-configured alerts. Performance graphs reveal patterns you didn't anticipate, and anomalies become visible when you review the data.
The limitation: Network Monitoring tells you that something is wrong and what metrics are affected, but not where in the network path or why it's happening. When latency spikes, you know performance degraded, but you don't know if it's your ISP, a cloud provider, a transit hop, or internal infrastructure causing the issue unless you dive deeper.
- Network Observability: Unknown issues discovered through deep visibility
Network Observability adds continuous visibility into network paths, showing you exactly where traffic flows and where degradation begins. Instead of just seeing that latency increased, you see that hop 7 through your ISP's peer connection is experiencing congestion, even though you don't control that infrastructure.
This depth of visibility detects issues you'd never think to configure alerts for: cloud providers changing routing mid-session, gradual performance decline at specific transit hops, asymmetric path issues, intermittent problems that don't consistently cross thresholds, or congestion in third-party networks.
The advantage: Network Observability doesn't just tell you there's a problem, it pinpoints the exact location and provides context for diagnosis. A routing change at AWS, congestion at a specific ISP hop, or degradation in a path you didn't even know existed all become immediately visible, even without specific alerts configured for those scenarios.
- Network Monitoring: Metrics that require some manual diagnosis
Monitoring gives you numbers. Latency is 150ms. Packet loss is 2%. Bandwidth utilization is 87%. These metrics are accurate, but without all the context. You’ll need some manual analysis to know where in the network path that latency is being introduced. You don't know why packet loss suddenly appeared. You don't know what changed that caused the bandwidth to spike.
The data tells you something is happening. It doesn't tell you the story behind it.
- Network Observability: Metrics with full context
Observability gives you numbers plus the context that makes them actionable. Latency is 150ms, and it's specifically introduced at hop 7 where your ISP peers with a transit provider. Packet loss is 2%, and it started exactly when your traffic was rerouted through a different path at 14:23. Bandwidth spiked because a backup job started, and you can see exactly which source and destination are responsible.
The data tells you not just that something is happening, but why it's happening, where it's happening, and what you can do about it.
With network monitoring alone, your IT team knows when problems occur but must invest significant time determining where and why. This means running manual traceroutes, correlating data from multiple tools, contacting vendors for visibility into their infrastructure, and troubleshooting through trial and error.
Even with skilled engineers, diagnosis takes time. A latency spike requires investigating multiple potential causes: internal infrastructure, ISP issues, cloud provider routing, DNS problems, or application-layer bottlenecks. Each possibility requires checking different systems and coordinating with different teams or vendors.
The business impact: Resolution times measured in hours or days, extended outages while teams investigate, frustrated users waiting for answers, and vendor escalations that depend on external response times. IT resources spend more time diagnosing problems than solving them.
With network observability, your IT team sees exactly where problems occur the moment they appear. Instead of spending hours investigating potential causes, they immediately know whether the issue is at hop 7 in their ISP's network, a routing change by their cloud provider, or congestion at a specific transit point.
This visibility dramatically accelerates the entire resolution process. When you can show a vendor exactly which hop in their infrastructure is causing packet loss, escalations get resolved faster. When you can identify that the problem is not in your infrastructure, you avoid wasting time on internal troubleshooting. When you can see intermittent issues in historical data, you can prove patterns that would otherwise be dismissed.
The business impact: Resolution times measured in minutes instead of hours, faster vendor escalations with concrete evidence, reduced mean time to resolution (MTTR), and IT resources focused on solving problems rather than hunting for them. Better network performance means better user experience, fewer complaints, and more time for strategic initiatives that drive business value.
The shift from monitoring to observability isn't driven by vendor hype, it's driven by measurable operational improvements that directly impact how IT teams work and how reliably networks perform.
When network issues occur, every minute counts. Traditional monitoring triggers an alert, then you spend 1-3 hours (or more) investigating: running traceroutes, checking logs, testing from different locations, narrowing down possibilities.
The real value isn't just faster fixes. It's what your team does with that reclaimed time: optimization, strategic projects, proactive improvements instead of constant firefighting.
The most valuable problems are the ones that never impact users. Observability excels at catching issues early, and pattern recognition identifies subtle degradation that never crosses alert thresholds but compounds over time. Intermittent packet loss. Gradual bandwidth increases heading toward capacity limits. Performance variance indicates infrastructure instability.
Alert fatigue is real. When monitoring generates dozens of alerts daily, teams develop alert blindness. Worse, many alerts require 20 minutes of investigation only to discover a temporary spike that has already resolved. That's hours of engineering time producing zero value.
Observability reduces noise through intelligent analysis. Temporary spikes don't generate tickets. Minor issues get logged without interrupting workflows. When alerts do fire, they come with context and diagnostics, and your team implements solutions instead of investigating.
Network performance directly impacts productivity. Observability provides visibility into the complete user experience regardless of location or connection type, remote workers on residential ISPs, branch offices, and cloud applications across the public Internet.
When issues do occur, rapid resolution minimizes user impact. Problems get fixed in 15 minutes instead of three hours. Issues get resolved permanently because root cause was identified, not temporarily patched through trial and error.
Dealing with ISPs and cloud providers is frustrating when you can't prove where problems originate. They ask for diagnostics you can't provide with basic monitoring. Tickets escalate, investigations drag on.
This specificity accelerates provider response dramatically. They can't dispute the data. You've pinpointed the issue to their infrastructure with actionable diagnostics they can immediately escalate to engineering.
The financial benefits are straightforward:
- Reduced downtime costs from faster resolution and proactive prevention.
- Lower operational costs when teams spend less time firefighting.
- Optimized infrastructure spending from better visibility into actual utilization patterns, you stop over-provisioning out of caution or under-provisioning from lack of data.
- Avoided SLA penalties by maintaining commitments proactively.
- Improved vendor management when you can prove provider issues quickly and definitively.
Obkio's development from a network monitoring platform to a true observability solution wasn't a marketing rebrand or a feature checklist exercise. It was a response to what we saw customers actually struggling with in the field, and a reflection of how network management needs have fundamentally changed.
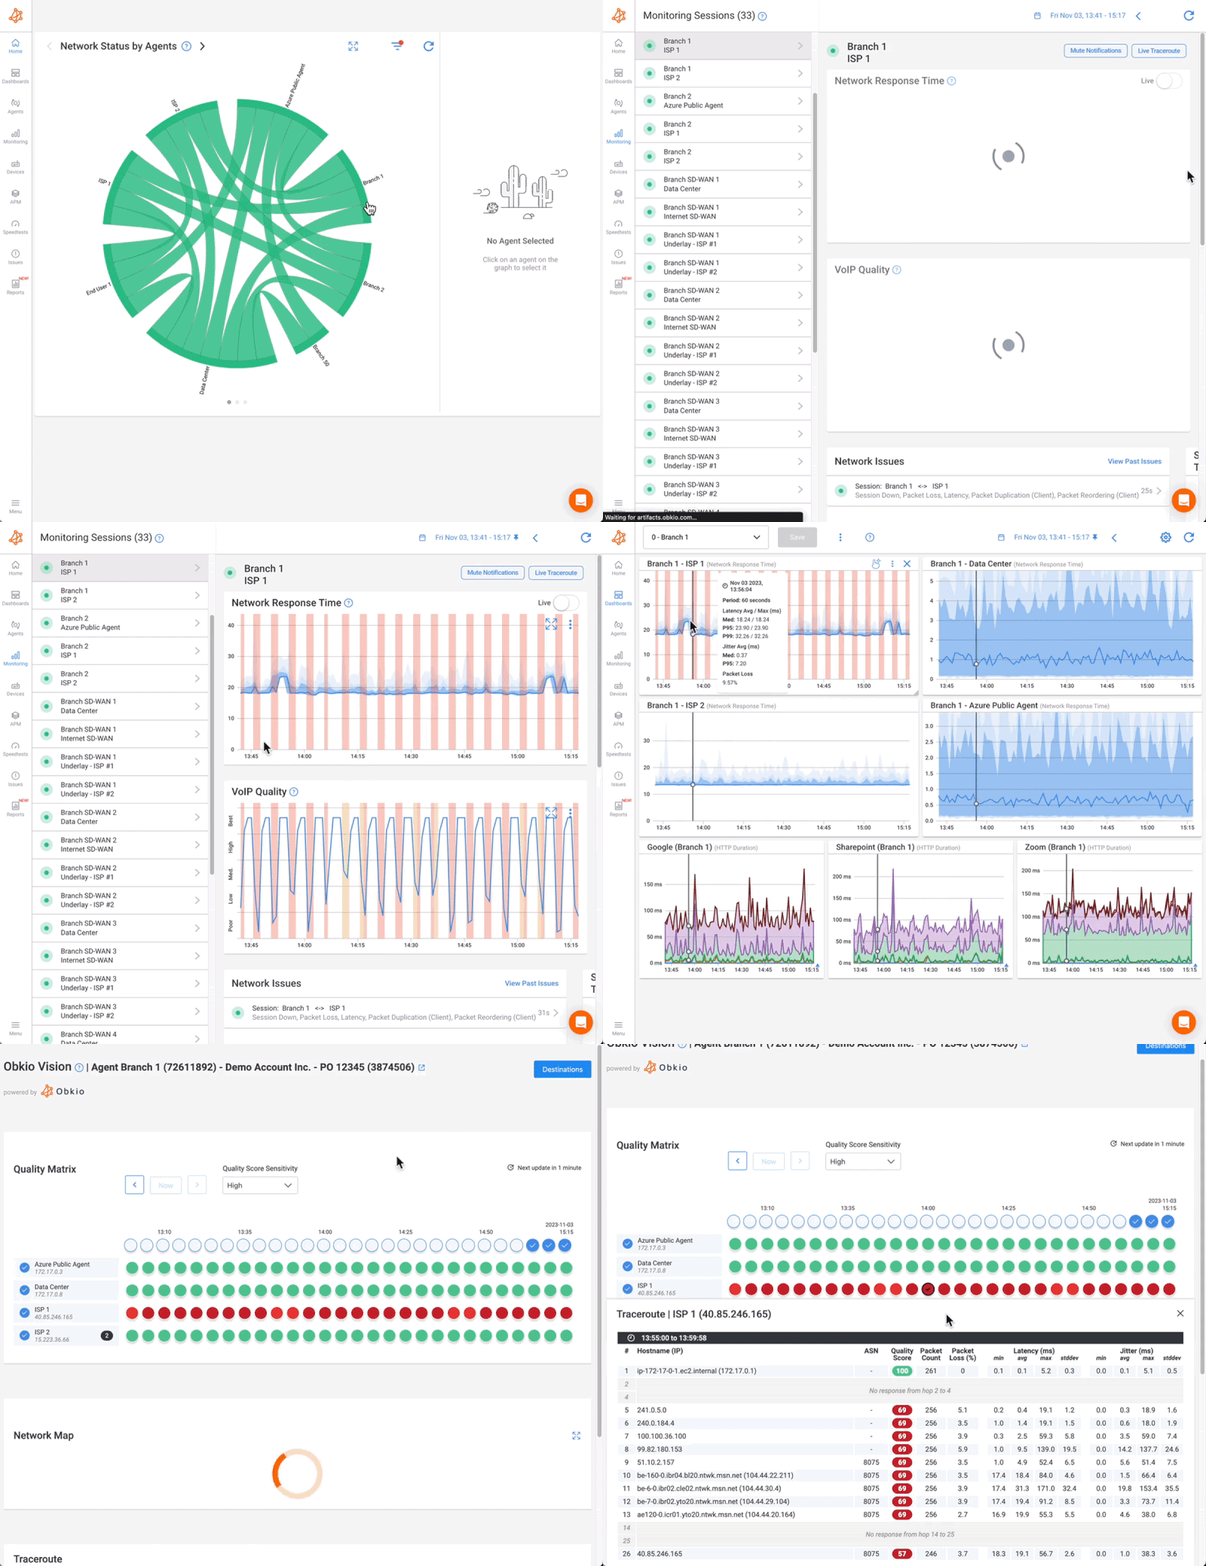
Understanding this evolution shows why observability isn't just "monitoring plus extra features". It's a different architectural approach to solving network visibility problems.
- 14-day free trial of all premium features
- Deploy in just 10 minutes
- Monitor performance in all key network locations
- Measure real-time network metrics
- Identify and troubleshoot live network problems

Obkio launched with a clear focus: synthetic monitoring that provides continuous, real-time visibility into network performance between specific locations. Unlike SNMP-based monitoring that polls devices periodically, or flow-based monitoring that samples traffic, Obkio's agent-to-agent architecture actively generates synthetic traffic between monitored locations and measures actual performance continuously.

This foundation was (and remains) powerful. Deploy lightweight monitoring agents at your locations (offices, data centers, cloud environments), and they continuously exchange traffic with each other, measuring latency, packet loss, and jitter in real-time. No sampling. No polling intervals. Continuous data that shows exactly what network performance looks like from the user's perspective.
The agent-to-agent model solved several limitations of traditional monitoring:
- Always-on visibility: Rather than waiting five minutes between measurements, you get performance data every second. Intermittent issues that resolve between polling intervals don't go unnoticed.
- User perspective: You're not monitoring device metrics. You're monitoring actual network performance between locations where users work and applications they need to reach.
- Immediate detection: When performance degrades, you see it immediately, not five minutes later when the next polling cycle completes.
- Synthetic testing: Performance measurement happens continuously, not just when users are actively working. You catch issues at 3 AM just as reliably as during business hours.
This monitoring foundation gave IT teams unprecedented visibility into real-time network performance. But as customers deployed Obkio and began using it for day-to-day troubleshooting, a pattern emerged: they had great performance data, but they still spent hours investigating why performance degraded and where problems originated.
The metrics showed what was happening. Customers needed to understand why.
The shift from monitoring to observability required adding three fundamental capabilities that transform how IT teams understand and troubleshoot network issues.
The first critical addition was comprehensive path analysis, visibility into the complete route data takes through the network, showing every hop between source and destination.
When Obkio's monitoring detects performance degradation, path analysis automatically reveals where in the network path that degradation occurs. You're not just seeing that latency increased by 60ms. You're seeing that it increased specifically at hop 7, which is your ISP's peering point with a transit provider. You're seeing that packet loss is 4% at hop 9 and 0% everywhere else in the path.
This visibility extends to routing changes that impact performance. When your ISP reroutes traffic through a different path, you see it immediately, the path changes, latency characteristics change, and you know exactly when the routing change occurred and what the impact was.
Path analysis works continuously alongside performance monitoring. You're not manually running traceroutes when problems occur. The platform is already showing you the path, and when performance changes, you immediately see which hop is responsible.
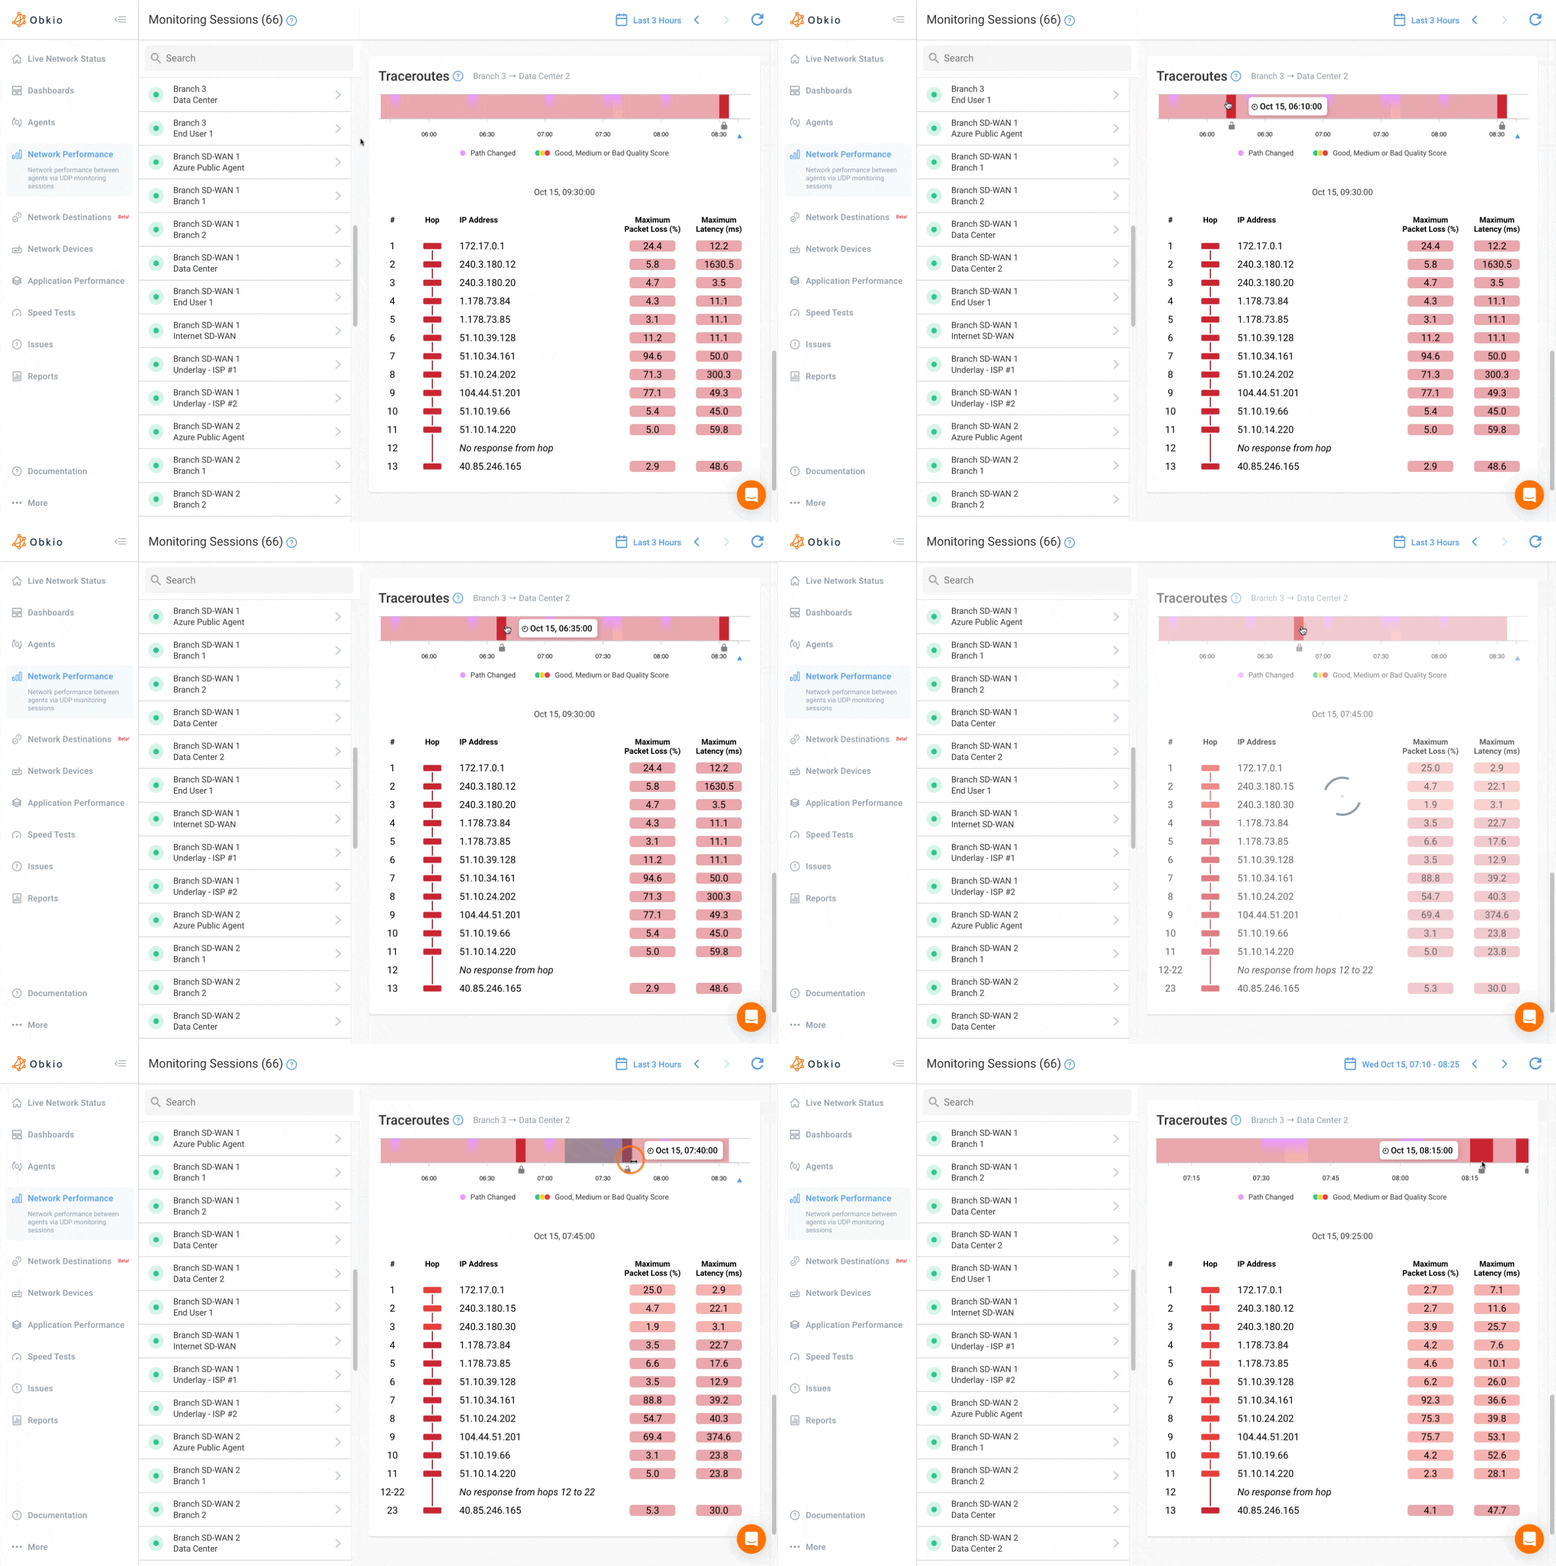
For complex environments with traffic traversing multiple providers (your ISP, Internet transit providers, cloud provider networks) this visibility is transformative. You can definitively identify whether problems are in your network, your ISP's network, or downstream provider infrastructure. No more guessing. No more trial-and-error troubleshooting.
Raw network data (even with path analysis) can be overwhelming. Latency measurements every second across dozens of paths, historical performance patterns, routing changes, performance variance across different times of day. It's all valuable information, but it needs to be presented in a way that humans can quickly parse and understand.
Visual monitoring transforms complex network data into intuitive visualizations that make patterns, anomalies, and trends immediately obvious.
Visual traceroutes show the complete network path with colour-coded performance indicators at each hop. Degradation jumps out visuall: green hops are performing well, yellow indicates minor issues, red shows significant problems. You can see at a glance where in the path issues are occurring.
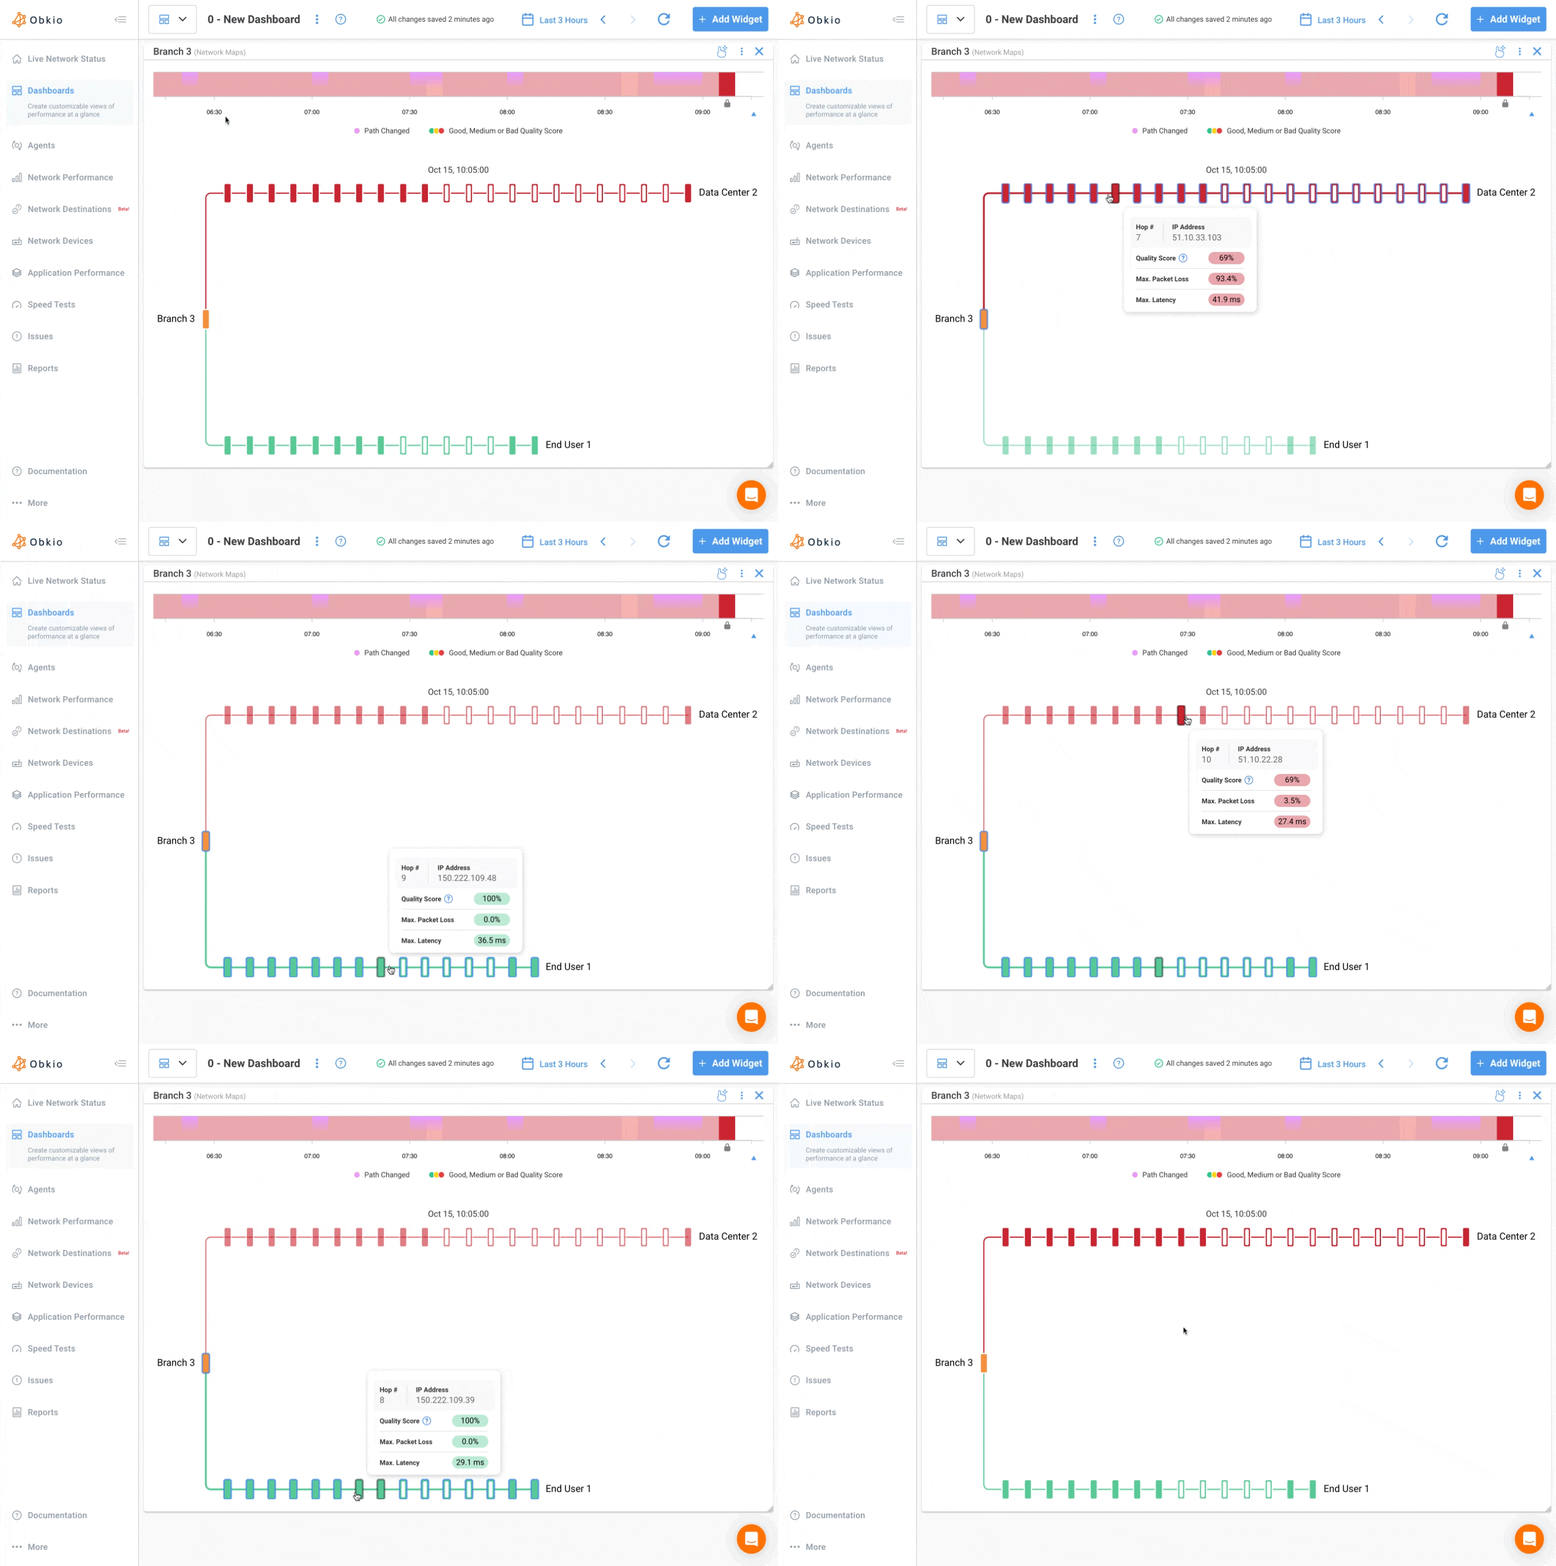
Performance graphs overlay multiple metrics (latency, packet loss, jitter) with time-series data that shows exactly when issues started, how they evolved, and when they resolved. Compare current performance to historical baselines. Identify whether an issue is new or recurring. See correlations between different metrics.
Network topology views show relationships between monitored locations and the paths connecting them. When performance degrades on multiple paths simultaneously, the visualization helps you identify whether it's a common upstream issue or multiple independent problems.
The goal isn't to make pretty dashboards. It's to reduce the cognitive load required to understand what's happening in your network. Instead of reading through tables of metrics or parsing text-based traceroute output, you see the complete picture immediately and can focus on resolution instead of data interpretation.
This is where Obkio truly delivers observability: the capability that transforms the platform from an excellent monitoring tool into a diagnostic system that provides answers, not just data.
Automatic diagnostics continuously analyze all the performance data and path information Obkio collects, correlating metrics across the entire network to identify root causes. When performance degrades, the platform doesn't just alert you, it shows you why.
The system identifies:
- Which network segment is responsible: Is the problem in your LAN, your WAN connection, your ISP's network, or the destination network?
- What type of issue is occurring: Routing problem, congestion, packet loss, latency increase, or infrastructure failure?
- When the issue started: Precise timestamp showing when performance changed
- What changed: Routing modifications, path changes, or performance characteristic shifts that triggered the issue
This eliminates the manual detective work that traditionally consumes hours of IT time. You're not piecing together clues. You're reading the diagnosis and taking action.
By combining continuous agent-to-agent monitoring with path analysis, visual insights, and automatic diagnostics, Obkio delivers end-to-end network observability tool that transforms how IT teams understand and manage their networks.
You have real-time performance data showing what is happening. You have path visibility showing where issues occur. You have automatic diagnostics explaining why problems exist. And you have visual interfaces that make all this information immediately comprehensible and actionable.
The evolution from monitoring to observability wasn't about chasing industry buzzwords. It was about solving the real problems network teams face: too much data, not enough answers, and too much time spent troubleshooting instead of optimizing.
Not every organization needs deep network path diagnostics. For certain environments and priorities, monitoring network performance metrics without continuous path visibility can meet your needs.
If your team has the time to run manual traceroutes during incidents, coordinate with multiple vendors, and piece together diagnostic information from various sources, you can troubleshoot effectively without continuous path visibility. The diagnostic process takes longer—potentially hours instead of minutes—but if that timeline fits your operational requirements and user expectations, manual investigation remains viable.
Organizations where network issues cause inconvenience rather than revenue loss, customer impact, or operational disruption may not prioritize rapid diagnosis. If occasional performance problems don't significantly affect business outcomes and users tolerate intermittent slowdowns, investing in faster diagnostic capabilities may not align with business priorities.
If you have managed service providers or ISPs with excellent support teams who handle all network troubleshooting on your behalf, you might not need in-house diagnostic capabilities. Your workflow is: detect the issue, open a ticket, let the vendor investigate and resolve.
In this model, your role is identifying that a problem exists, not determining where or why. Basic monitoring serves that purpose adequately.
Small businesses with minimal IT budgets and basic network needs may find that simple uptime monitoring meets their requirements. If "the internet is working" is your primary concern and your operations don't depend on consistent application performance or complex network infrastructure, investing in comprehensive diagnostics might not be the best use of limited resources.
Network observability becomes essential as networks grow in complexity and business dependence on network performance increases.
When alerts fire but you can't quickly determine why, observability's automatic diagnostics and path visibility become invaluable. You're tired of spending two hours investigating every incident only to discover the problem was at hop 7 in your ISP's network, information you could have had in two minutes with proper visibility. If troubleshooting consumes a significant portion of your IT team's time, observability pays for itself in reclaimed engineering hours.
Managing connections between on-premises infrastructure, multiple cloud providers, SaaS applications, and remote workers requires deep visibility beyond basic metrics. Your data center connects to AWS, Azure, and Google Cloud. Your users work from home offices across three continents. Your critical applications run as SaaS services on infrastructure you don't control. When performance degrades, the problem could be anywhere in this distributed mess. Monitoring can't tell you where. Observability can.
If network issues directly impact revenue, customer experience, or productivity, the faster resolution enabled by observability justifies the investment. E-commerce platforms lose sales during slowdowns. SaaS providers violate SLAs when performance degrades. Financial services firms risk compliance issues when trading systems experience latency. For these organizations, reducing MTTR from hours to minutes isn't a nice-to-have, it's a business imperative with measurable ROI.
Supporting remote and hybrid employees across various locations and internet connections demands continuous monitoring with contextual diagnostics. Your 200 remote workers are connecting from residential ISPs you don't control, experiencing performance issues you can't easily reproduce or investigate with traditional tools. When a user in Cleveland reports that Salesforce is slow, you need visibility into the complete path from their home network through their ISP, across the internet, and into Salesforce's infrastructure. Monitoring gives you "latency is high." Observability tells you it's high at a specific peering point between two providers.
Understanding performance across cloud providers, identifying routing issues, and optimizing connectivity requires path analysis and detailed visibility. You're migrating workloads from on-premises to AWS while maintaining some services in Azure. Performance varies between regions. Routing changes unpredictably. Understanding why connection quality differs between your office and us-east-1 versus eu-west-2 requires visibility into the complete network path, not just endpoint metrics.
Industries with strict SLA requirements or audit obligations benefit from comprehensive historical data and documented root cause analysis. When you need to prove to auditors that you met 99.9% uptime commitments, or document exactly why a service outage occurred and what you did to prevent recurrence, observability provides the detailed forensic data that monitoring lacks. You can show exactly when issues occurred, where they originated, and how quickly they were resolved.
When your team is overwhelmed by alerts but lacks clear direction on resolution, observability cuts through the noise with actionable insights. If you're receiving 50 alerts per day and investigating 35 of them only to find they're false positives or minor issues that self-resolved, you have an alert fatigue problem. Observability's intelligent analysis reduces noise by identifying which issues actually matter and providing diagnostic information that eliminates investigation time.
The value proposition is measurable:
- 90% reduction in troubleshooting time. Issues that used to consume 2-3 hours get resolved in 15-20 minutes. Your team spends less time investigating and more time optimizing. The engineering hours reclaimed per month typically exceed the cost of the platform.
- Proactive issue detection before users are impacted. Catch performance degradation while it's still developing, address issues during business hours instead of during outages, maintain SLAs without scrambling to fix violations after they occur.
- Clear accountability when working with ISPs or service providers. Walk into provider escalations with specific diagnostics showing exactly where in their network the problem exists. No more back-and-forth investigations that drag on for days. You have the evidence, they fix the problem.
- Strategic insights for network optimization and capacity planning. Understand actual usage patterns, identify underutilized circuits and oversubscribed paths, make infrastructure decisions based on real performance data instead of guesswork.
- Improved team efficiency with less time spent on manual investigation. Your IT team shifts from spending 60% of their time troubleshooting to spending 60% of their time on strategic initiatives. The organizational impact of that shift is substantial.
The question isn't whether observability provides value. The question is whether your network environment and business requirements justify the investment. For organizations experiencing the scenarios described above, the answer is almost always yes.
Discover why network visibility is vital for resolving issues before they affect users. Learn how proactive monitoring keeps you out of the darkness.
Learn more

The shift from monitoring to observability doesn't require ripping out your existing tools or overhauling your entire network management approach overnight. It's a practical transition that starts with identifying where your current visibility falls short and systematically filling those gaps.
Before evaluating platforms or planning deployments, get honest about where your existing monitoring setup is failing you. Ask your team these questions:
1. How long does it take to identify the root cause of network issues? If the answer is "usually 1-3 hours" or "it depends on the issue," you have a visibility problem. Track a few recent incidents and calculate actual time from initial alert to confirmed root cause. That baseline becomes your benchmark for measuring improvement.
2. Are you experiencing alert fatigue? Count how many alerts your monitoring system generates daily, then count how many of those alerts result in actual remediation work. If you're getting 50 alerts per day but only acting on 10 of them, you're wasting time triaging noise and risking that critical alerts get buried in the volume.
3. Do you have visibility into network paths and third-party providers? When performance degrades on connections to cloud services or remote locations, can you see where in the path the problem occurs? Can you definitively tell whether issues are in your network, your ISP's network, or downstream infrastructure? If you're running manual traceroutes and calling providers with vague symptoms, you lack the visibility that observability provides.
4. How often do you troubleshoot "mystery slowdowns"? Count incidents where users report performance issues but your monitoring shows everything within thresholds. These gaps between user experience and monitoring visibility indicate you're missing the context needed to understand what's actually happening.
5. What percentage of IT time goes to firefighting versus optimization? If your team spends most of their time responding to incidents and very little time on proactive improvements, you're stuck in reactive mode. Observability shifts that balance by reducing troubleshooting time and surfacing optimization opportunities.
Document the answers. You'll use this assessment to justify the investment, measure ROI after implementation, and identify which network segments should be prioritized for observability coverage.
Look for solutions that provide the three foundational capabilities that separate network observability from network monitoring: continuous performance data, complete path visibility, and automatic diagnostics. Not all platforms claiming to offer "observability" actually deliver all three.
The platform should actively generate traffic between your monitored locations and measure performance continuously, not just sample traffic or poll periodically. You need real-time visibility that catches intermittent issues and provides second-by-second performance data.
Obkio's agent-to-agent architecture does exactly this, lightweight monitoring agents deployed at your locations continuously exchange synthetic traffic, measuring latency, packet loss, and jitter from the user's perspective without gaps or sampling.
You need visibility into the complete network path showing every hop between source and destination, with performance metrics at each segment. This can't be a manual tool you run when problems occur, it needs to be continuous and automatic so you immediately see where degradation happens when it happens.
Obkio's Visual Traceroute runs continuously alongside performance monitoring, showing you the complete path and identifying which specific hop introduces latency or packet loss when performance degrades.

- 14-day free trial of all premium features
- Deploy in just 10 minutes
- Monitor performance in all key network locations
- Measure real-time network metrics
- Identify and troubleshoot live network problems

This is what transforms data into answers. The platform helps to correlate performance metrics and path information to identify root causes, showing you not just that latency increased but where it increased, when it started, and what changed.
Observability only delivers value if you can actually deploy it across your environment without massive implementation projects. Look for solutions with lightweight agents that install in minutes, don't require complex configuration, and scale easily as you add locations.
Your observability platform should complement your existing monitoring infrastructure, not replace it wholesale. Look for solutions that integrate with your ticketing systems, documentation platforms, and communication tools so observability insights flow into existing workflows.
Don't try to deploy observability across your entire network simultaneously. Start strategically with the segments where visibility gaps cause the most pain, prove the value, then expand systematically.
1. Identify your most troublesome connections. Start with network segments that generate frequent incidents or consume disproportionate troubleshooting time. Common starting points include connections to major cloud providers, links supporting remote offices with recurring performance issues, circuits serving critical applications, or paths supporting large remote workforce populations. These high-pain areas deliver the fastest ROI because they're where reduced troubleshooting time is most valuable.
2. Deploy monitoring agents at key locations. With Obkio, this means installing lightweight agents at your critical locations (headquarters, data centers, major branch offices, cloud environments) and configuring them to monitor connections between these locations and to key destinations. The agents immediately begin collecting performance data and path information, establishing baselines and providing visibility you didn't have before.
3. Establish baselines before problems occur. Let the platform run for at least a few days to understand normal performance patterns. This baseline data is crucial for identifying anomalies and understanding whether current performance represents degradation or typical behaviour.
4. Use observability for the next few incidents. When alerts fire or users report issues, use your new observability platform alongside your existing troubleshooting process. Compare how long it takes to identify root cause with observability versus traditional methods. Document the time savings. Track how often observability identifies issues your monitoring tools missed entirely. Build the business case for broader deployment with real data from your own network.
5. Expand coverage based on demonstrated value. Once you've proven that observability reduces MTTR and catches issues monitoring missed, expand to additional network segments. Add more remote locations, monitor connections to additional cloud providers, extend coverage to secondary sites. The incremental approach limits initial investment while building organizational buy-in based on measurable results.
The transition from monitoring to observability is as much about changing how your team works as it is about deploying new technology. Over time, teams naturally spot patterns and fix recurring problems before they become incidents, but you get value from day one simply by troubleshooting faster. The biggest wins come from resolving issues quickly, proving problems to vendors with concrete evidence, and spending less time investigating and more time fixing.
The difference between network monitoring and network observability comes down to diagnostic speed and accuracy.
Monitoring tells you what metrics are affected. Observability shows you where in the network path the problem exists and why performance is degrading. That's the difference between spending hours investigating and resolving issues in minutes.
Modern network performance monitoring platforms like Obkio combine continuous performance monitoring with automatic path visibility and visual diagnostics. You get both the alert that something is wrong and the diagnostic data showing exactly which network hop is causing the problem, without running manual traceroutes or piecing together data from multiple tools.
- 14-day free trial of all premium features
- Deploy in just 10 minutes
- Monitor performance in all key network locations
- Measure real-time network metrics
- Identify and troubleshoot live network problems


 Obkio Blog


