How Obkio Works
A Technical Overview of Our Network Performance Monitoring Tool

Learn how Obkio's NPM tool works!
How Obkio's Network Performance Monitoring Tool Works
IT teams need real-time visibility to maintain an optimal user experience and network performance.
With its innovative, performance-focused approach, Obkio’s Network Performance Monitoring tool sends up to 95% fewer unnecessary alerts than traditional NPM solutions.
What truly sets Obkio apart from other solutions is our approach to network monitoring. Instead of relying solely on SNMP polling, we focus on performance testing using synthetic traffic.
With our Network Performance Monitoring (NPM) feature, you gain deep visibility—not just into your LAN, but across your entire WAN—whether you're using a standard Internet connection, SD-WAN, or SASE.
Network Performance Monitoring Using Synthetic Tests
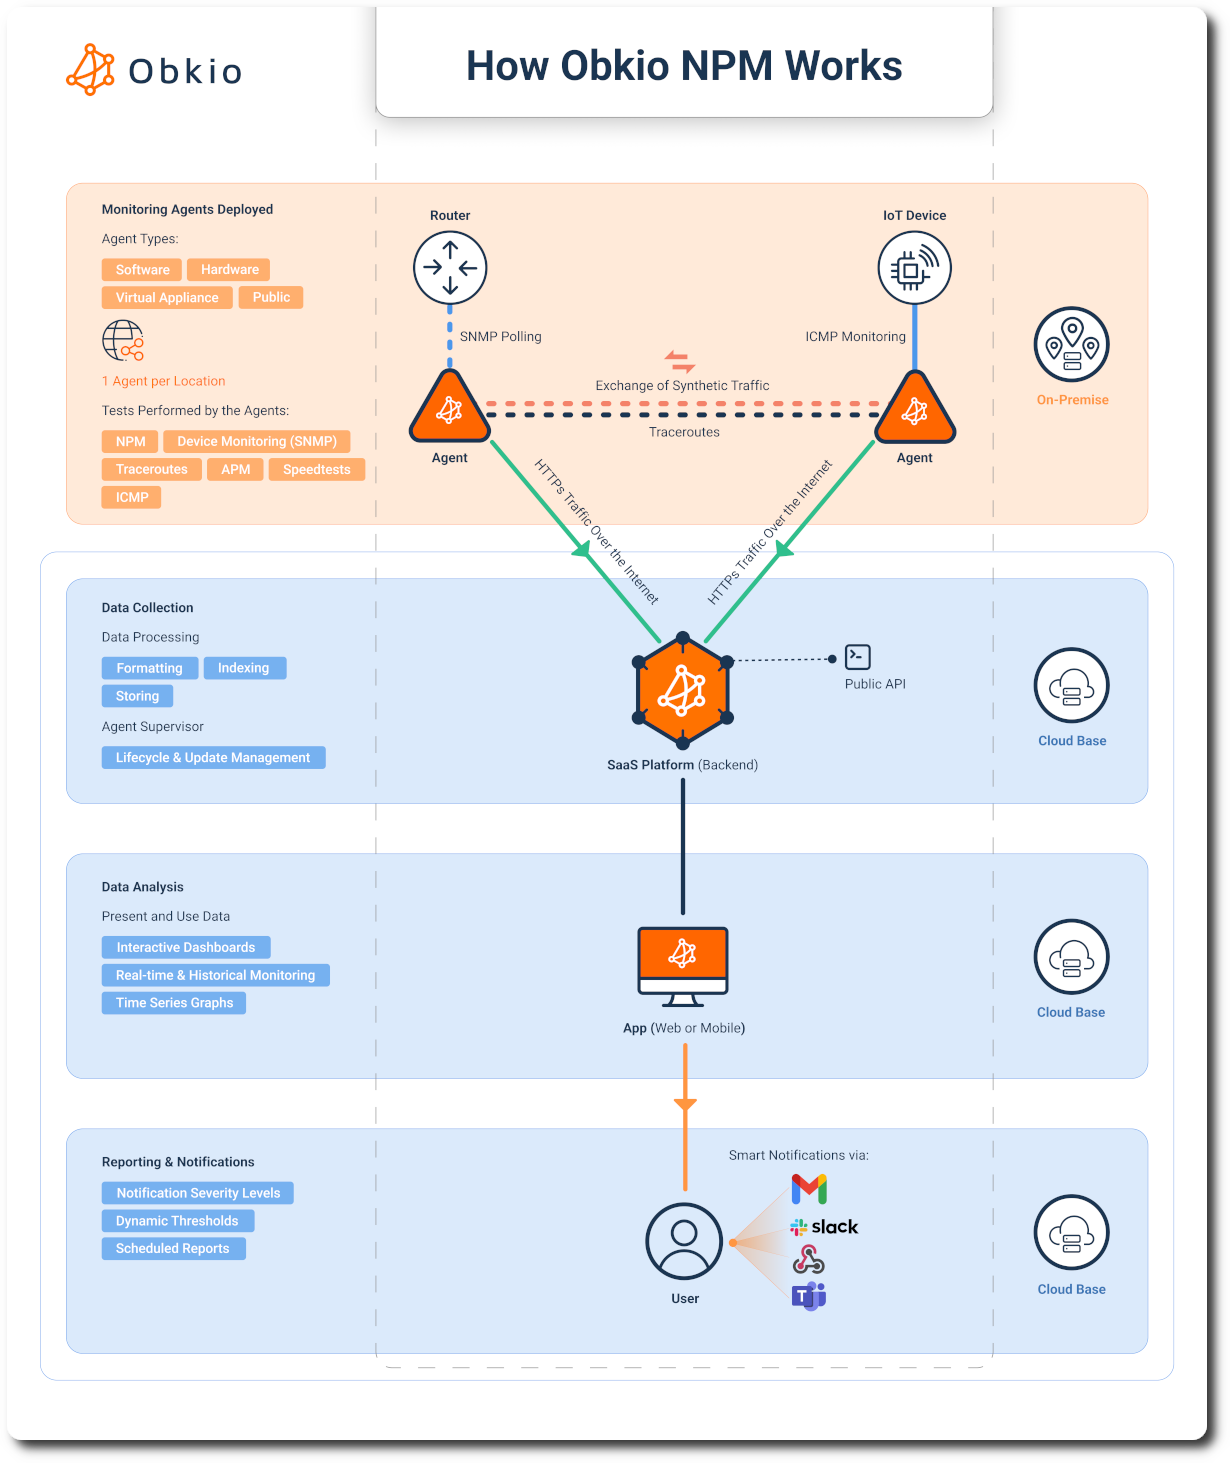
Deployment is simple: just install a Monitoring Agent on each site you want to monitor. Obkio offers Monitoring Agents for Windows, Linux, macOS, Docker, or as a VM image. If you don’t have a reliable machine on-site, plug-and-play hardware agents are available, along with public monitoring agents hosted by Obkio in Azure, AWS, and Google Cloud to monitor your inbound and outbound Internet connections.
Obkio’s next-gen NPM feature ensures that you receive proactive alerts that take you directly to the Obkio app.
Once inside, you can explore device monitoring via SNMP, review traceroute history, run continuous speed tests, and track your critical applications—all within a single platform that provides a clear and comprehensive view of your network infrastructure.
How to Deploy Obkio's Network Performance Monitoring Tool
Each Monitoring Agent automatically sends key data to the Obkio platform, which handles processing, indexing, and storage No need to manually configure dozens of performance metrics—they’re already pre-set for you. With our cloud-based architecture, all you need to install is the Monitoring agent—no heavy infrastructure or maintenance is required.
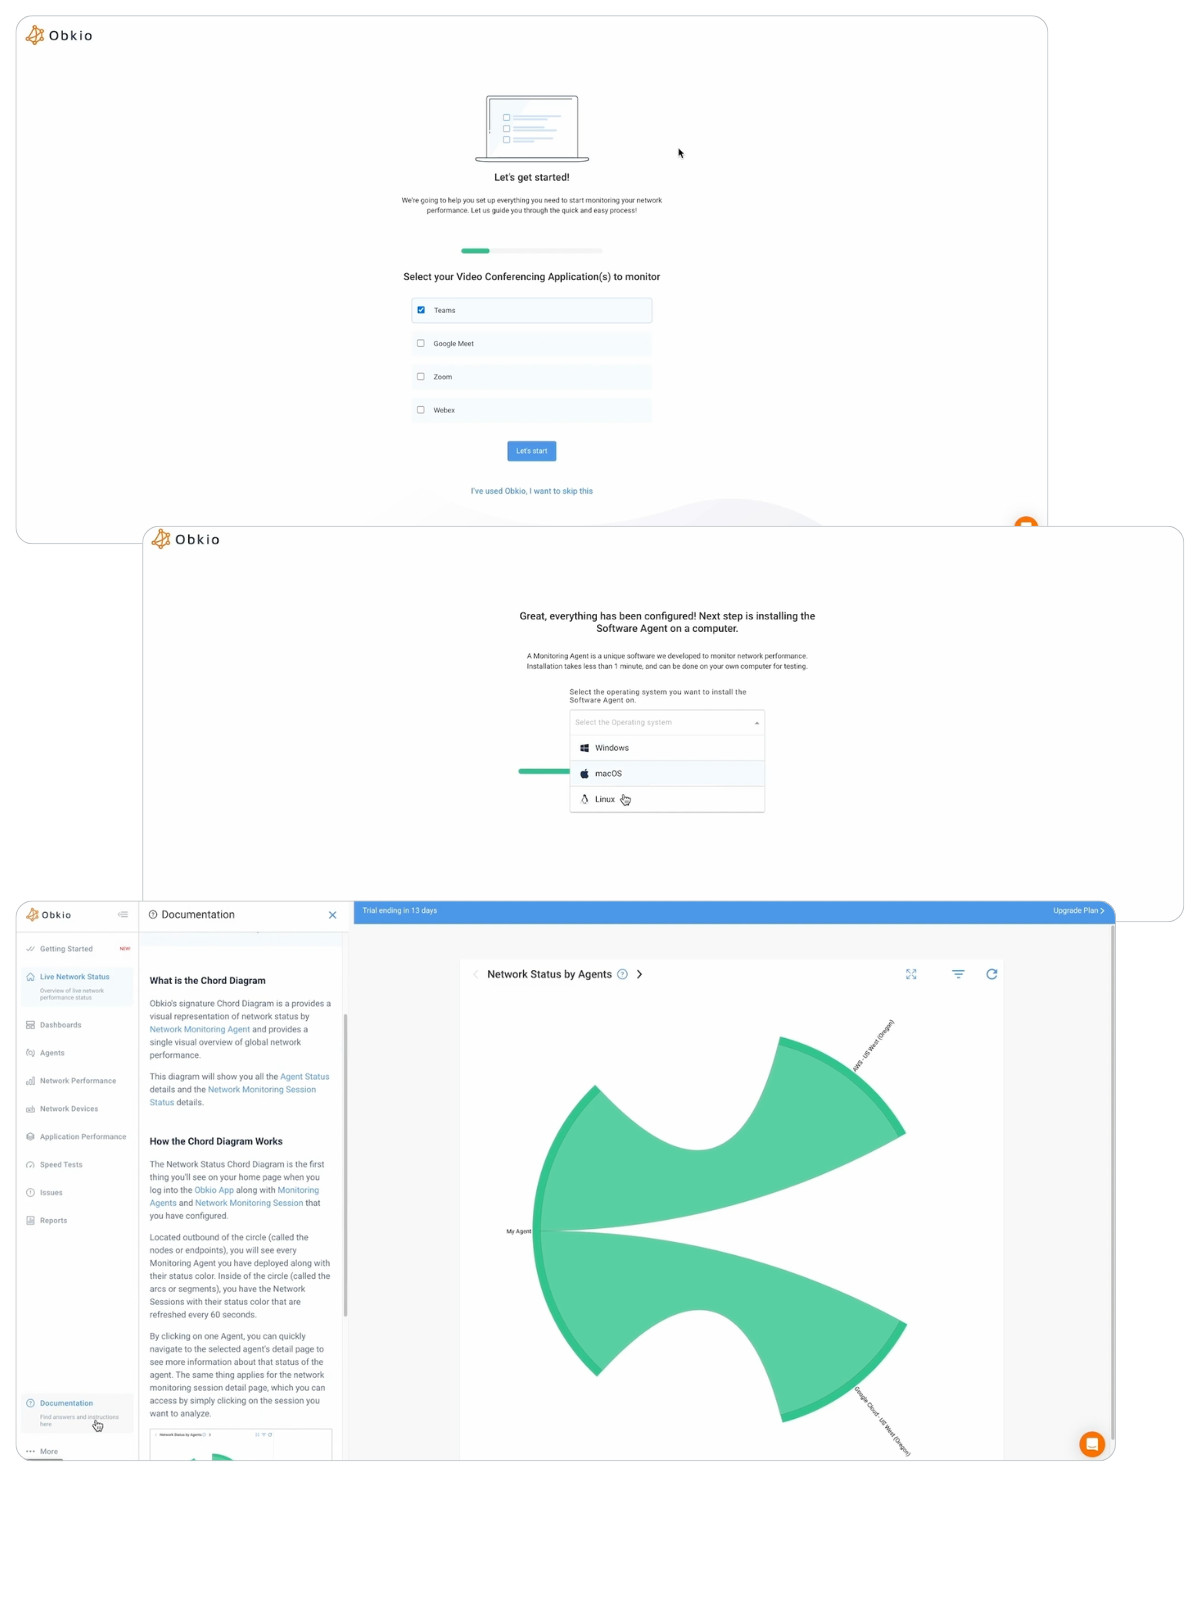
Now, let’s take a look at the user interface—this is where the magic happens. From your first login into the app, a Guided Onboarding Wizard will ask you a few simple questions. We’ll then take care of the initial setup for you.
Next, you'll be prompted to install your first Monitoring Agent on a computer or server of your choice to measure network performance between that location and the Internet.
During the six minutes it takes to configure your account, a short video will guide you through the app. Once the setup is complete, you’ll be redirected to the app.
To make things even easier, we’ve added an Onboarding Checklist to guide you through more additional onboarding steps, like adding more Monitoring Agents. Each task on the checklist also includes built-in documentation, available in both text and video formats for your viewing or reading pleasure.
While navigating the app, you can click on the “?” icon at any time to open the documentation page related to that section.
Analyzing Obkio's Network Monitoring Graphs & Dashboards
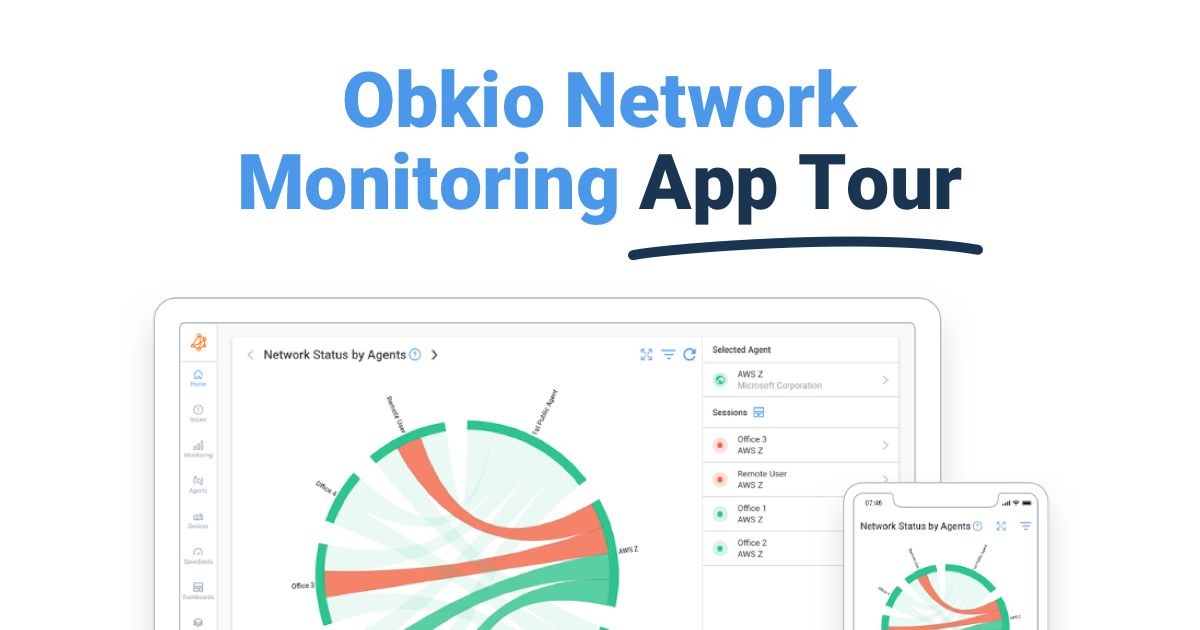
Once this deployment is finished, you’ll access the Live Network Status “Chord Diagram”, providing a real-time overview of your network. You’ll also see various tabs that allow you to navigate through Obkio’s key features.
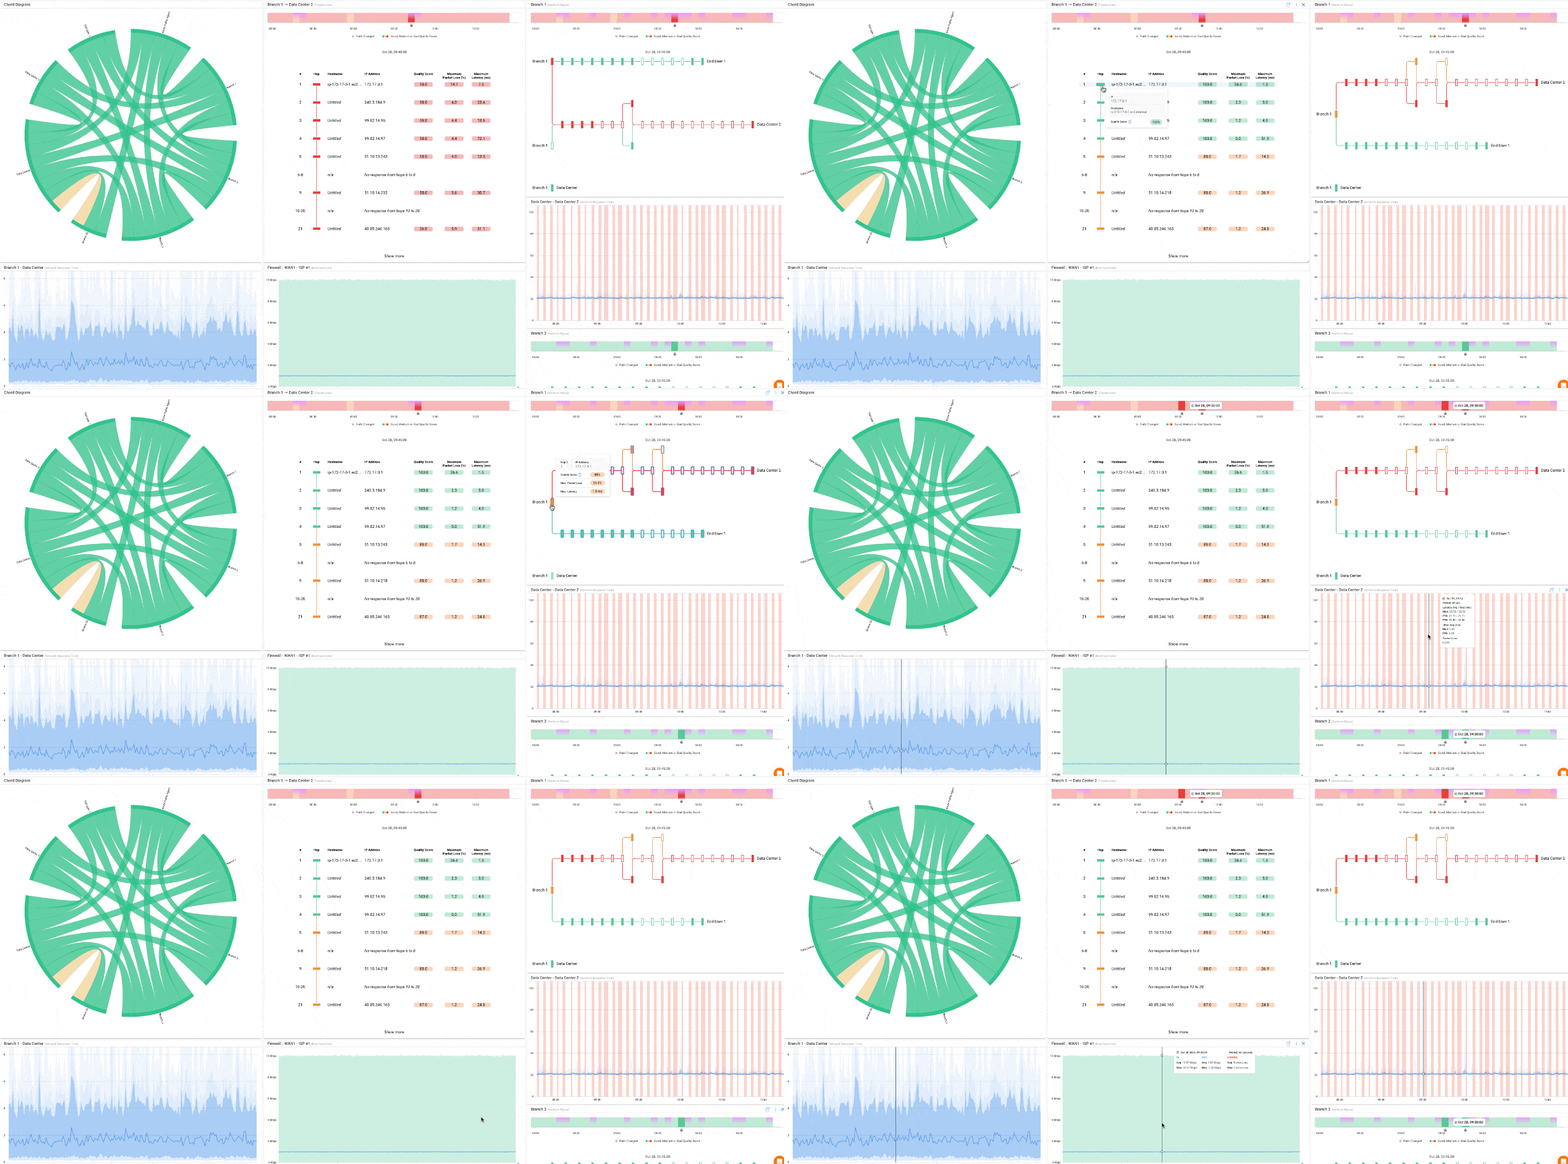
In the video (and in the screenshots to the right) you'll see a dashboard where our NPM and SNMP features work together to detect network congestion. In this case, the user began receiving alerts from Obkio’s app around midnight, via Slack, Teams, or email. The alerts signalled packet loss, along with CPU congestion on the firewall and bandwidth congestion on the interfaces.
We generally recommend creating a global dashboard for all your sites, along with detailed dashboards for each site There are no limits to how many dashboards you can save.
In this dasbhaord, the cause of the CPU congestion on the firewall is clear. But if the issue was further down the line—like on your ISP’s local loop—simple SNMP polling wouldn’t have been enough to identify it.
Troubleshooting Network Issues Fast With Obkio
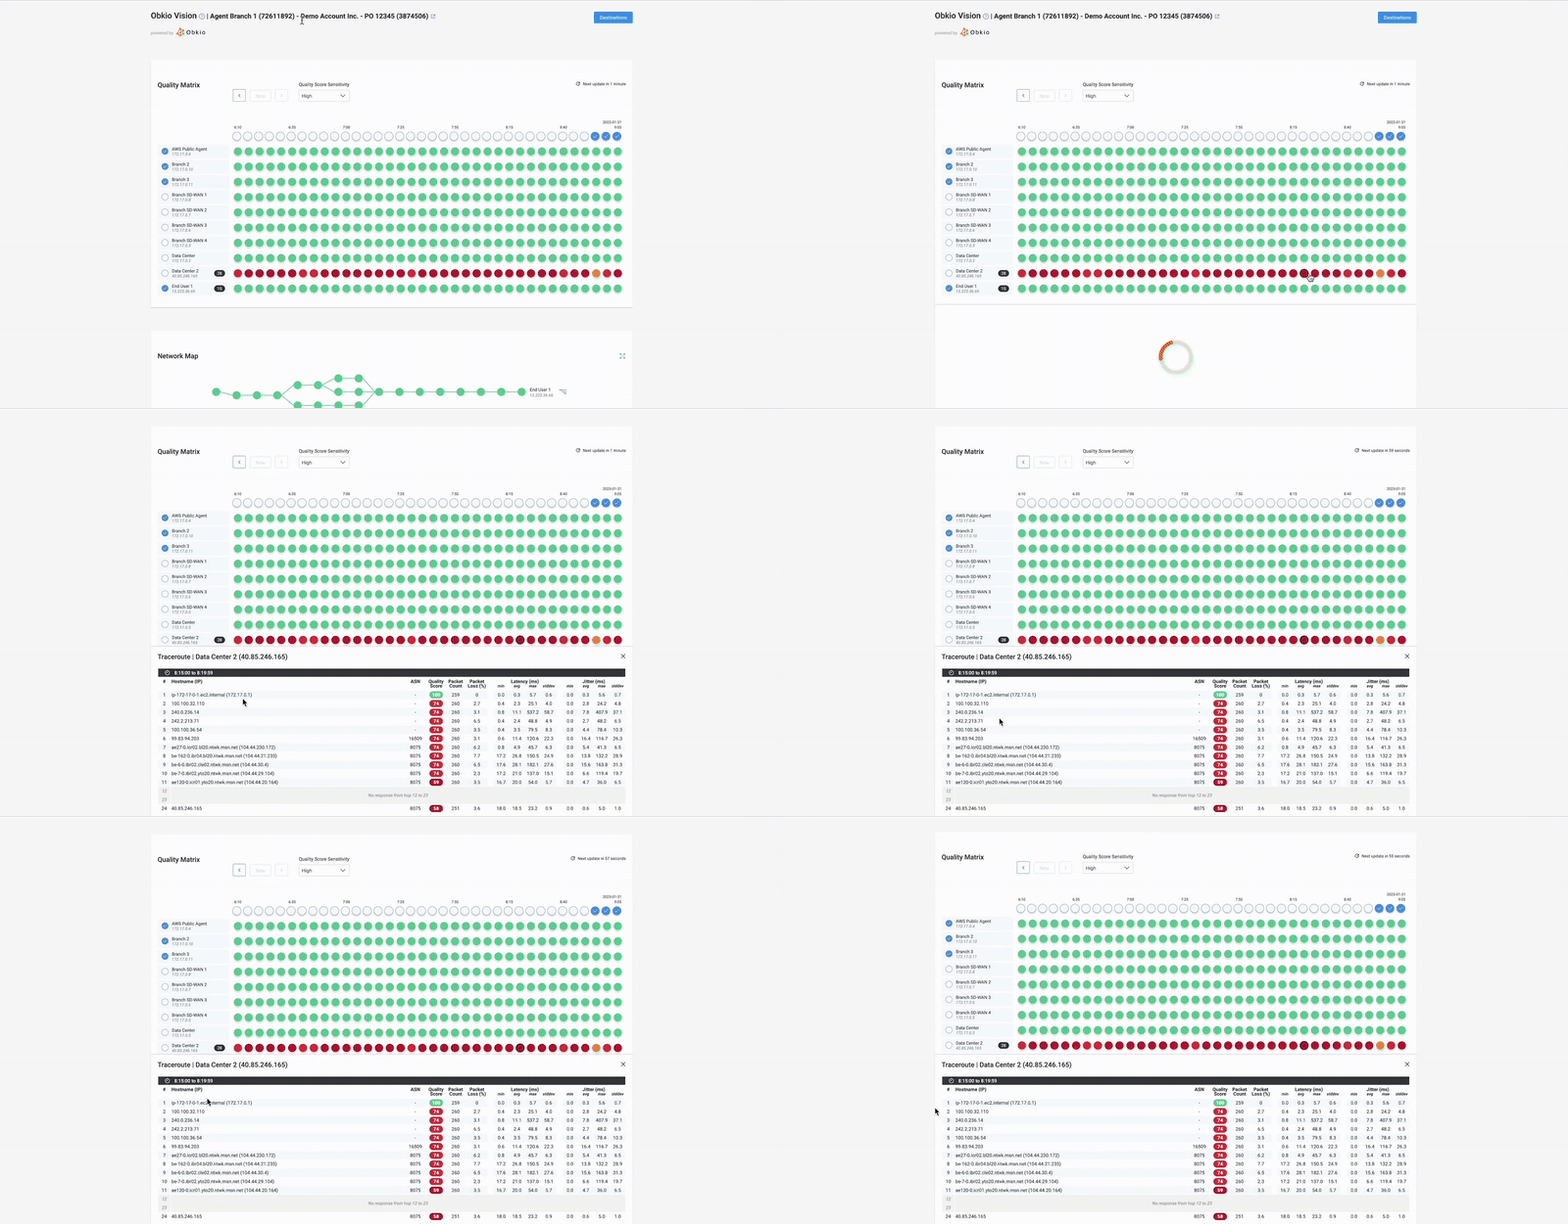
To troubleshoot issues further down your network, like in your local loop, you’d need traceroute history to pinpoint the exact location of the problem. For that, let’s take a look at Obkio Vision: Visual Traceroute Tool.
If we look at the traceroutes, in the screenshot to the left, we can see that the problem is here on the local loop.
This approach makes troubleshooting easier, giving you all the data you need to escalate the issue, saving valuable time, and minimizing disruptions for your users.
The Benefits of Troubleshooting with Obkio
With Obkio’s network performance-focused approach, you get highly detailed metrics without being flooded with unnecessary alerts. This allows you to focus on what really matters—quickly identifying the root cause of slowdowns or outages.
In the end, you save hours of manual troubleshooting and improve service availability.
Getting Started With Obkio's Free 14-Day Trial
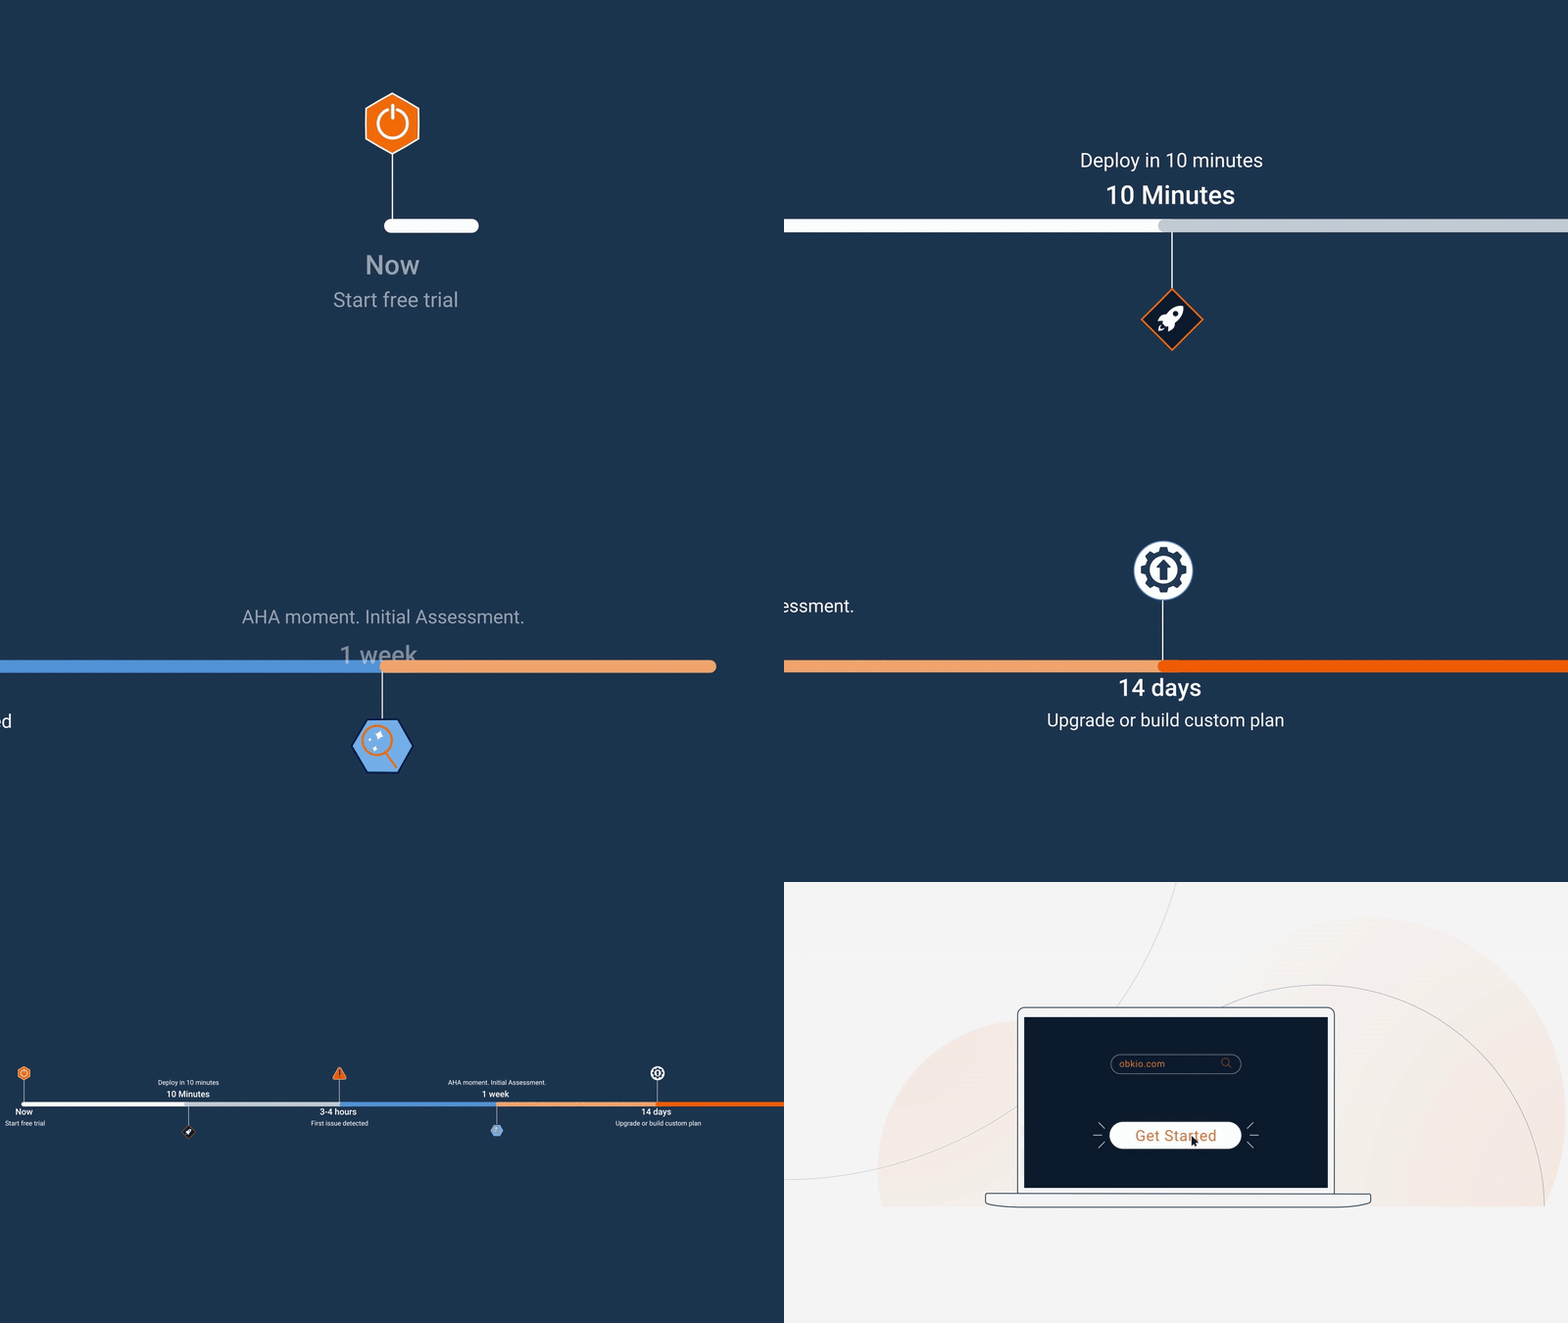
In just 3 to 4 hours of effort during the free trial period, you’ll already see the first benefit: detecting issues before they impact users. And when your boss calls, you can confidently say: “I know, I’m already on it!”
Ready to get started?
Start today by signing up for Obkio’s 14-day free trial! In just a few minutes, you'll be up and running, monitoring your entire infrastructure.
Join us now and take your IT monitoring to the next level with Obkio!
Featured Articles
Start Your Free 14-Day Trial Now!
Get a free POC with Obkio's 14-day trial. Identify network problems & collect data to troubleshoot.
Start Now Book a Demo


