Table of Contents
Table of Contents
In the world of network monitoring, SNMP is the tried-and-true protocol that’s been helping IT teams monitor device health for decades. Whether you're managing switches, routers, firewalls, or access points, SNMP Device Monitoring remains one of the most widely used methods for tracking device performance and status.
At Obkio, one of the most common questions we hear from prospects is:
“Do you offer SNMP device monitoring?”
The short answer: Yes, absolutely .
In fact, we understand just how essential SNMP still is for device monitoring in modern network environments, which is why we recently increased the number of SNMP devices included per user in our plans.
But SNMP is only one piece of the puzzle.
While SNMP gives you visibility into what’s happening inside your devices, it doesn’t always tell you how those issues affect your users or applications. That’s where Network Performance Monitoring (NPM) comes in to measure the experience that flows through the network, not just the hardware it runs on.
Because SNMP Device Monitoring is still very highly used and requested, we wrote his article to help you understand:
- What SNMP Device Monitoring is
- When you really need it (and why it’s so popular)
- Where SNMP alone falls short
- How to combine SNMP with active Network Performance Monitoring (and why that makes all the difference)
Let’s start by breaking down what SNMP monitoring actually does and why it’s still a foundational part of every network monitoring stack.
SNMP, or Simple Network Management Protocol, is a standard protocol used to monitor and manage networked devices. Developed in the late 1980s, SNMP was designed to give network administrators the ability to query, control, and receive alerts from a wide range of hardware, all through a common language.
At its core, SNMP works by polling devices for specific metrics or waiting for them to send alerts (called traps) when something goes wrong. It’s been built into virtually every network device for decades, making it the go-to method for device-level monitoring.
SNMP device monitoring refers to using SNMP to continuously monitor the health and performance of network devices and infrastructure. With SNMP, you can track a variety of hardware and performance metrics on your network devices, such as:
- CPU usage
- Memory consumption
- Bandwidth utilization
- Interface errors and discards
- Uptime and availability
- Temperature, power supply, and fan status
These metrics show a detailed snapshot of device health and behaviour, helping to detect hardware issues, network congestion, or misconfigurations.
Learn about what SNMP monitoring is & how to use it to monitor performance of networking devices like firewalls, routers, switches and wifi access points.
Learn more

1. Polling: The NMS periodically sends SNMP GET or GET-NEXT requests to the agent for specific metrics (e.g., CPU usage).
2. Trap/Alerting: Devices can send SNMP TRAPs or INFORMs to the NMS when certain thresholds or events occur (e.g., high temperature).
3. Data Collection: Collected data is stored for historical analysis, visualization, and alerting.
4. Monitoring Metrics: Commonly include:
- Interface bandwidth usage
- CPU and memory usage
- Network errors
- Device uptime and availability
- Hardware health (temperature, fan status)
SNMP’s popularity is no coincidence since it offers several distinct advantages:
✅ Vendor-Agnostic
Works across a wide range of devices from different manufacturers (Cisco, Fortinet, Juniper, Ubiquiti, etc.)
✅ Lightweight & Scalable
Operates over low-bandwidth links and scales across thousands of devices without requiring heavy resource consumption.
✅ Universal Support
Supported even by legacy devices, making it ideal for hybrid, multi-vendor environments.
✅ Infrastructure Visibility
Essential for understanding what’s happening at the hardware level — the first layer of network visibility.

SNMP device monitoring is ideal for:
- Monitoring routers, switches, and firewalls
- Tracking access points in distributed Wi-Fi networks
- Power and temperature management in data centers
- Building centralized dashboards for IT and NOC teams
- Supporting SLA reporting and network audits
In short, SNMP Device Monitoring remains one of the most fundamental protocols in any network monitoring toolbox. But while it's indispensable for tracking device status, it doesn’t always provide the full picture, especially when performance or user experience is at stake.
While SNMP has its limitations, there are many scenarios where it’s absolutely essential. From monitoring device health to validating SLAs, SNMP plays a vital role in maintaining network infrastructure, especially when availability and performance are mission-critical.
Let’s walk through the top use cases where SNMP shines.
Your networking gear, like routers, network switches, and firewalls, is only as reliable as the hardware that powers it. SNMP device monitoring helps you identify issues like CPU spikes, memory leaks, or overheating, which can quietly degrade performance before anyone notices.
✅How SNMP Helps:
Monitor Device Metrics: SNMP Polls key health metrics to ensure that your devices are performing as they should be and identify any performance issues:
- CPU load percentages
- Memory utilization
- Fan speeds, temperature sensors, and power supply status
Configure Device Alerts: SNMP, used in conjunction with a network and device monitoring tool like Obkio, allows you to configure thresholds to trigger proactive alerts for anomalies
 Screenshot from Obkio's Network Device Monitoring Feature
🧭 When to Use:
In environments where uptime is critical: data centers, branch offices, remote sites
⚠️ SNMP Limitation:
SNMP tells you if the CPU is spiking, but not how that spike is affecting users or applications. That requires network performance monitoring.
Interfaces are where packets enter and leave devices, and they’re often the first place to look during slowdowns or outages. SNMP device monitoring allows you to monitor interface data to identify issues like overloaded, misconfigured or failing ports
✅ How SNMP Helps:
Monitor interface-specific data:
- Bandwidth usage
- Input/output errors
- Collisions and discards
- Duplex mismatches
Identify Issues: Quickly identify overloaded, misconfigured, or failing ports
🧭 When to Use:
- Troubleshooting poor WAN or LAN performance
- Validating MPLS or ISP service levels
⚠️ SNMP Limitation:
You’ll know an interface is congested, but not whether that congestion is slowing down your cloud apps or VoIP traffic.
Knowing whether a device is up or down is basic, but foundational. SNMP makes this simple by polling devices for uptime counters and interface status, or by receiving SNMP traps when a device goes offline. It helps you instantly detect outages, unexpected reboots, or unstable devices flapping in and out of service.
 Screenshot from Obkio's Network Device Monitoring Feature
✅ How SNMP Helps:
Collects uptime counters and monitors device status (up/down).
Detects:
- Unexpected reboots
- Power outages
- Interface flapping
🧭 When to Use:
- As a baseline for high-availability setups
- In distributed environments (retail chains, branch networks)
⚠️ SNMP Limitation:
It can’t tell you why a device went down or whether the issue lies with upstream network links or application-layer failures.
Bandwidth usage isn't just about how much traffic is flowing. It’s about where it’s going and whether it’s impacting performance. With SNMP, you can monitor real-time and historical bandwidth utilization per interface, port, or VLAN. This helps identify overloaded links, traffic spikes, and imbalanced load distribution. It’s especially useful for validating link capacity, detecting abnormal usage patterns, and ensuring critical traffic isn’t being choked by congestion.
✅ How SNMP Helps:
Tracks real-time and historical bandwidth utilization
Enables capacity planning and traffic profiling
Helps spot:
- Traffic spikes
- Over-utilization
- Link imbalance
🧭 When to Use:
- Monitoring branch-to-HQ traffic
- Verifying load balancing and usage trends
⚠️ SNMP Limitation:
SNMP shows that usage is high, but not if it’s due to VoIP traffic, video conferencing, or a runaway backup job.
How to measure bandwidth, identify issues & optimize network performance. Use Obkio's Network Performance Monitoring tool for easy bandwidth monitoring.
Learn more

Modern networks are rarely uniform and often include older hardware that lacks APIs or telemetry. SNMP bridges these gaps by offering a universal, standardized protocol supported by virtually all network devices, old and new. Whether you're managing legacy switches, firewalls, or routers from different manufacturers, SNMP provides consistent access to essential device metrics without the need for proprietary tools or integrations.
✅ How SNMP Helps:
Universally supported — even by 10+ year-old devices
Doesn’t require vendor-specific agents or platforms
Ideal for hybrid stacks: Cisco, Juniper, Fortinet, Ubiquiti, and more
🧭 When to Use:
- In MSP environments or mixed-vendor IT infrastructures
⚠️ SNMP Limitation:
Data quality may vary across vendors, and deep insights like app performance or user experience won’t be visible.
Centralized visibility is essential for 24/7 monitoring, especially for MSPs or teams running a dedicated NOC. SNMP plays a critical role by feeding live device metrics into centralized dashboards, to give you visibility across all your network infrastructure. With SNMP, you can configure alerts for high CPU usage, interface errors, bandwidth thresholds, and device downtime. This empowers teams to react to issues efficiently and maintain SLAs.
 Screenshot from Obkio's Network Monitoring Tool
✅ How SNMP Helps:
Provides real-time metrics to power dashboard visualizations
Supports alert thresholds and integrations with ticketing tools
Detects device-level issues before they escalate
🧭 When to Use:
- In Network Operations Centers
- For white-labeled monitoring services
⚠️ SNMP Limitation:
Dashboards built on SNMP only show what devices report, not user-facing symptoms like slow Zoom calls or latency spikes.
Tracking provider performance is key to enforcing service guarantees. By monitoring metrics like link uptime, interface errors, and bandwidth utilization, SNMP device monitoring helps you verify whether your ISP or service vendor is truly delivering on their SLA commitments. You can document outages, degraded links, or repeated performance issues with concrete data.
✅ How SNMP Helps:
Monitors link uptime, availability, and utilization
Logs patterns of:
- Intermittent drops
- Persistent congestion
- Link instability
🧭 When to Use:
- Before escalating ISP issues
- For monthly SLA audits and reporting
⚠️ SNMP Limitation:
You won’t catch transient jitter, app-level delays, or user complaints if you’re only looking at interface stats.
Learn about SLA monitoring & reporting using Network Monitoring to measure network, service performance, user experience & understand if SLAs are being met.
Learn more

To build a resilient network, you need to learn from the past. By collecting historical data on CPU load, memory usage, and interface bandwidth over days, weeks, or months, SNMP helps businesses identify usage patterns and forecast future needs. It’s also great for capacity planning, helping you decide when to upgrade infrastructure, rebalance traffic, or adjust configurations before issues arise.
✅ How SNMP Helps:
Collects historical graphs for:
- CPU and memory
- Interface throughput
- Error trends
Identifies recurring load patterns or performance bottlenecks
🧭 When to Use:
- During quarterly IT reviews
- While planning hardware refreshes or bandwidth upgrades
⚠️ SNMP Limitation:
Fast-developing or intermittent issues might fall between polling intervals and go undetected.
Next, we’ll explore what SNMP can’t see and why you sometimes need more than just device stats to solve real-world network issues.
Despite its usefulness and widespread adoption, SNMP has some serious blind spots, especially when it comes to understanding the real experience of your users.
SNMP is designed to tell you what’s happening on a device, not what’s happening through it.
It’s excellent at revealing whether your router’s CPU is peaking or if a switch port is dropping packets. But it won’t tell you whether that spike is slowing down Microsoft Teams, or whether packet drops are causing voice call jitter across your SD-WAN.
1. End-User Experience
SNMP is device-centric. It has no visibility into what users are experiencing across the network.
2. Network Path Visibility
It won’t help you troubleshoot the full path between a remote user and a cloud application, especially when ISPs or VPNs are in play.
3. Application Performance
SNMP doesn’t speak the language of SaaS. You won’t know if your Salesforce or Zoom traffic is struggling due to network delays.
4. Real-Time Response
SNMP typically relies on polling intervals (every 1–5 minutes), which can miss fast-developing or short-lived issues.
5. Intermittent Problem Detection
Random packet loss, latency spikes, or brief outages can easily go undetected if they don’t align with the polling window.
Let’s say your firewall is reporting a CPU spike via SNMP.
Is it affecting user traffic?
Is Zoom audio getting choppy?
Are file transfers timing out?
SNMP can’t answer those questions.
Your SNMP dashboard might show everything is green, while users are complaining that their apps are slow or unusable.
The issue could be a routing loop, an ISP bottleneck, or a VPN tunnel problem — all outside the scope of SNMP’s visibility.
If SNMP is the backbone of device monitoring, then Network Performance Monitoring (NPM) is its essential counterpart. It’s the piece that completes the visibility puzzle.

Where SNMP shows you how a device is functioning, NPM shows you how the network is performing, end-to-end, from the user’s point of view.
Network Performance Monitoring is the practice of monitoring and analyzing the performance and health of a computer network to ensure it operates efficiently and effectively.
Network Performance Monitoring measures key metrics like latency, packet loss, and jitter to give you real-time visibility into the actual user experience. It's essential when users report slowness but devices appear healthy, or when you need to monitor end-to-end paths across cloud, hybrid, or remote environments.
Rather than waiting for users to complain, Synthetic NPM tools simulate network activity to continuously track metrics like:
- Latency
- Jitter
- Packet loss
- Application reachability
- Network path changes
NPM doesn’t monitor device health, and SNMP doesn’t monitor end-to-end performance.
You need both.
Think of it like this:
- SNMP tells you that your router’s CPU is healthy.
- NPM tells you that your Zoom call is choppy, and it’s due to increased latency between your branch and HQ.
- Without NPM, you’re flying blind when it comes to the user experience.
Learn about network performance monitoring to optimize network performance. Discover key network metrics, tools & techniques & the benefits for businesses.
Learn more

NPM becomes critical in situations where SNMP simply can’t help:
✅ Users are reporting slowness, but your devices look fine
You’ve checked your SNMP dashboards and everything’s “green,” but complaints keep coming in. NPM can reveal performance degradation that SNMP misses.
✅ You’re troubleshooting latency, jitter, or packet loss
Especially for real-time traffic like VoIP, video conferencing, or VDI, you need millisecond-level visibility that SNMP polling won’t provide.
✅ You’re monitoring remote users, cloud apps, or hybrid networks
Whether your users are connecting from home, through SD-WAN, or to SaaS platforms, NPM helps you track the actual path and performance of that traffic.
At Obkio, we’re often asked:
“Do you offer SNMP device monitoring?”
The answer is an enthusiastic yes.
We understand how vital SNMP is for monitoring network hardware, which is why we’ve recently increased the number of SNMP devices included in our plans. SNMP is foundational for infrastructure visibility, and we know our users rely on it every day.
But we didn’t stop there.
What truly sets Obkio apart is how we combine SNMP with Network Performance Monitoring (NPM) — and how we correlate the data from both in real time to give you a complete view of your network.
SNMP + NPM: Two Streams, One Unified View
Most tools offer one or the other.
Obkio offers both and blends them together natively in our platform.

We integrate:
1. SNMP Device Monitoring
To collect traditional metrics like CPU, memory, bandwidth, and uptime
2. Active Network Performance Monitoring
Using synthetic traffic to measure end-to-end performance (latency, jitter, packet loss)
Obkio’s device monitoring is built to be fast, flexible, and vendor-agnostic. It uses SNMP polling to query your devices at frequent intervals (typically every 500 ms) and gather key metrics like:
- CPU usage
- Memory consumption
- Bandwidth usage per interface
- Error rates, discards, and packet drops
- Device uptime and availability
- Temperature, fan speed, and power supply status

You can monitor:
- Routers and switches
- Firewalls
- Access points
- Modems, wireless bridges, and more
The setup is simple. Just enter your SNMP credentials, and Obkio will automatically discover interfaces and begin polling data.
All collected metrics are stored for historical analysis, visualized in real time, and used to trigger smart alerts if thresholds are breached.

- 14-day free trial of all premium features
- Deploy in just 10 minutes
- Monitor performance in all key network locations
- Measure real-time network metrics
- Identify and troubleshoot live network problems

Unlike traditional tools that treat SNMP and performance data separately, Obkio synchronizes both streams in real time:
✅ We poll SNMP metrics directly from your devices
✅ We inject synthetic traffic that flows through those same devices
✅ We correlate both data sets to uncover real root causes — instantly
Let’s say your firewall’s CPU usage suddenly spikes.
With SNMP alone, you’d get an alert, but you wouldn’t know if it’s impacting traffic.
With performance monitoring alone, you might notice packet loss, but not know why.
With Obkio?
You’ll see both.
The CPU spike and the drop in performance align, giving you immediate insight into cause and effect.
We like to say: SNMP + NPM = 1 + 1 = 11
Looks like a math error, but it’s our mindset for proactive network performance monitoring.
What we mean is this:
When you monitor devices with SNMP (1) and monitor network performance with synthetic traffic (1), you don’t just get two isolated sets of data.

You get exponentially greater insight because we correlate those two data streams in real time, on the same timeline, through the same interface.
The result is something far more powerful than either approach on its own. It’s not additive — it’s multiplicative.
Let’s break it down:
SNMP alone tells you the status of your network devices, like CPU usage, interface errors, uptime, etc.
Performance monitoring alone tells you how the network behaves, measuring metrics like latency, packet loss, jitter, and application performance.
But the moment you combine those two and, more importantly, correlate them in real time, you gain visibility into:
- How device performance affects network quality
- Whether a hardware issue is impacting users
- If a network slowdown is tied to infrastructure bottlenecks
- Where the real root cause lives: in a device, a path, or a provider
For example:
- A CPU spike without packet loss might be harmless.
- Packet loss without a hardware alert might be external (e.g. ISP).
- But a CPU spike that lines up exactly with packet loss? That’s a correlation. That’s your root cause.
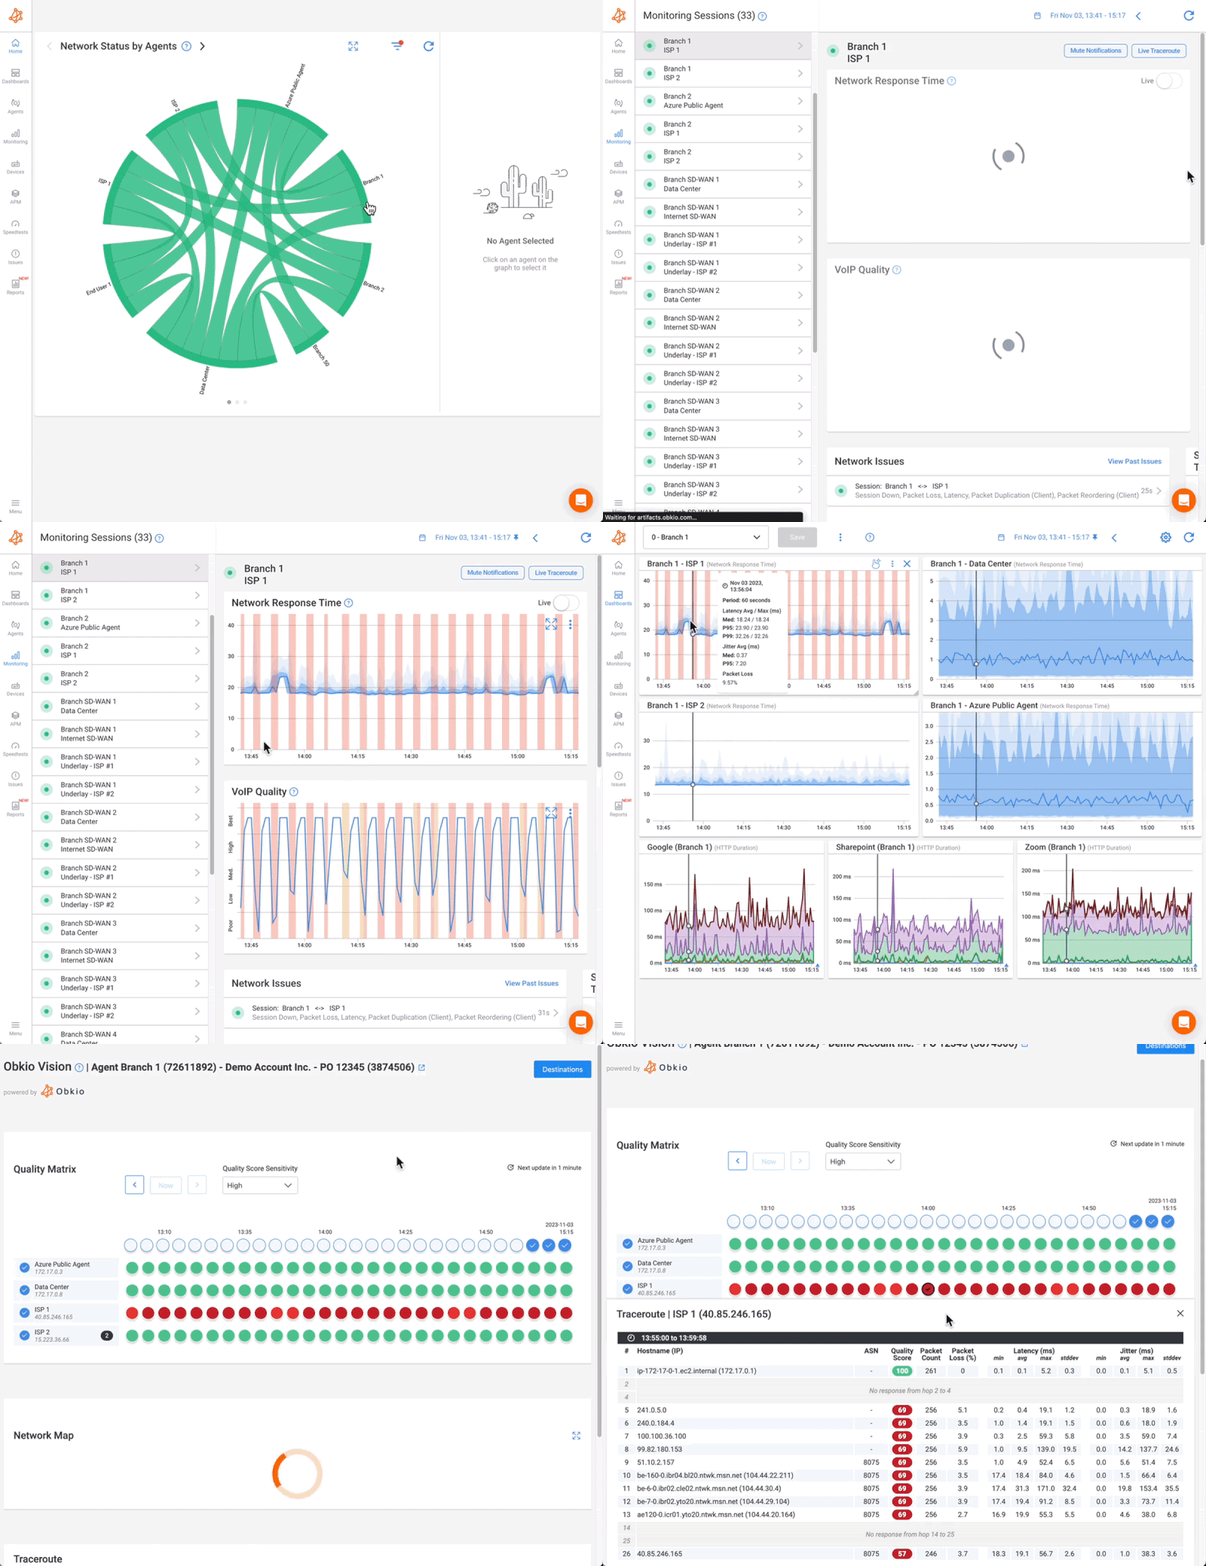
While SNMP gives you deep visibility into your network infrastructure, tracking device health, bandwidth usage, and availability, it only tells half the story. It shows you what’s happening on your devices, but not how it impacts your users.
To truly understand your network’s behaviour and to proactively troubleshoot issues before they affect productivity, you need to pair SNMP with Network Performance Monitoring (NPM).
For full visibility, you need both:
Device Monitoring (SNMP): To assess the health and performance of your infrastructure.
Performance Monitoring (NPM): To evaluate the end-to-end experience of users, applications, and services.
And this is where Obkio stands out.
Obkio brings both methodologies together — seamlessly, intelligently, and in real time. We don’t just monitor devices or performance. We correlate both to give you complete clarity into what’s going on, why it’s happening, and how it affects your business.
Whether you're troubleshooting slow cloud apps, validating ISP performance, or managing a multi-site network, Obkio equips you with the insights to act quickly and confidently.
Ready to see how SNMP + NPM = 1 + 1 = 11?
Explore our Device Monitoring Tool and start visualizing your network in a smarter way.
- 14-day free trial of all premium features
- Deploy in just 10 minutes
- Monitor performance in all key network locations
- Measure real-time network metrics
- Identify and troubleshoot live network problems


 Obkio Blog


