


Table of Contents
Table of Contents
When users complain that an app or website is slow, the first question is always the same: Is it the network or the application? HTTP monitoring gives you the answer.
Network metrics like latency and packet loss tell you what's happening on the wire. But they don't tell you whether users are actually feeling the impact. HTTP monitoring closes that gap. It tests a specific URL end-to-end, breaks down every phase of the HTTP transaction, and tells you exactly where time is being spent: DNS, TCP handshake, SSL negotiation, server response, or download.
This article covers what HTTP monitoring is, which metrics matter and why, and how to use HTTP network monitoring to isolate problems fast.
What Is HTTP Monitoring? 
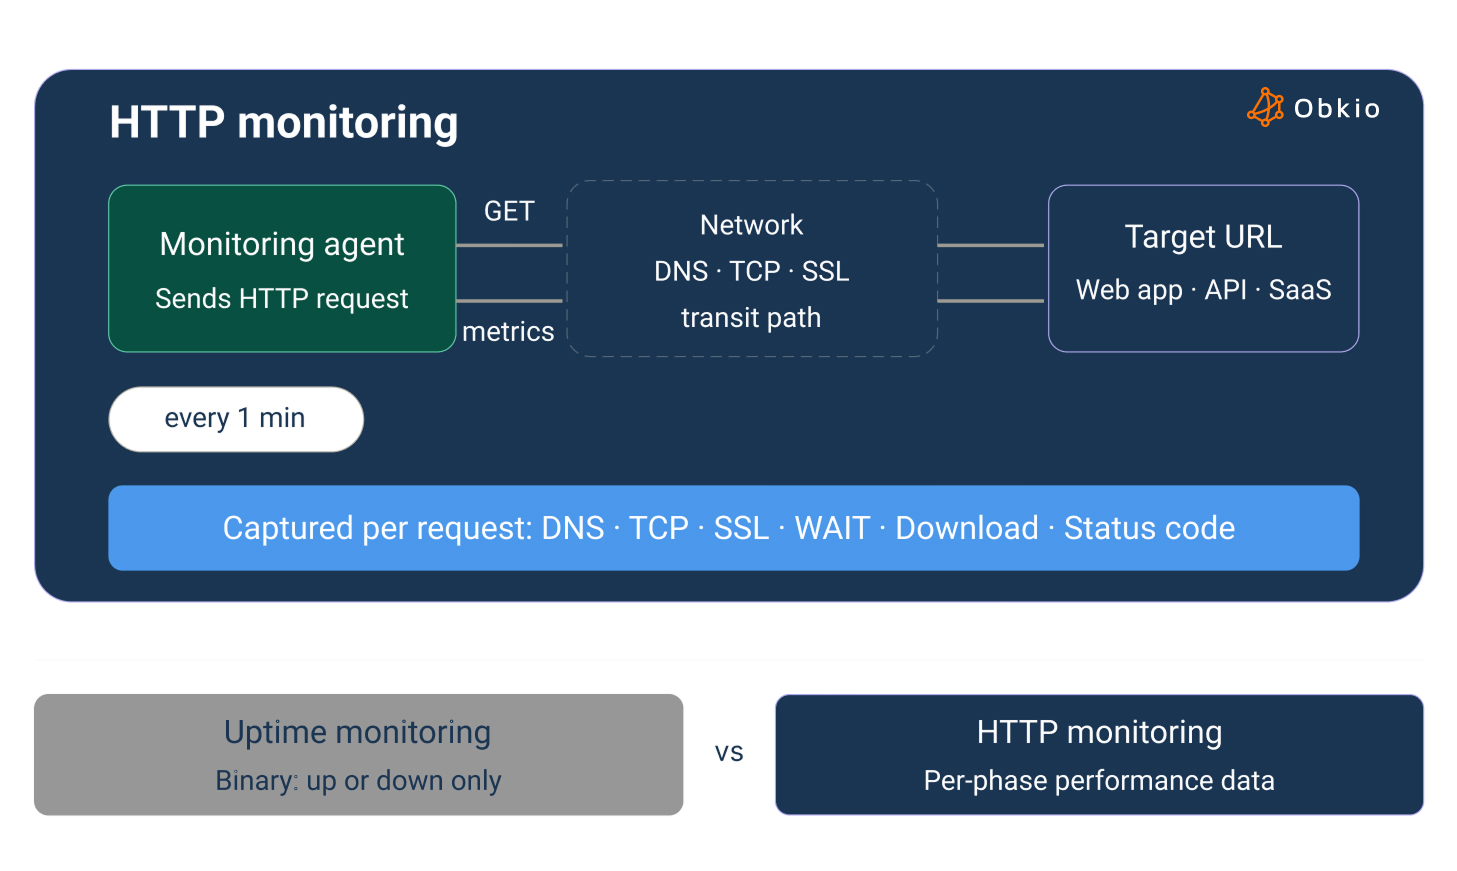
HTTP monitoring is the practice of periodically sending HTTP requests to a target URL and measuring the performance of each phase of that transaction in real time.
It's not the same as uptime monitoring, which only tells you whether a service is reachable (up or down). HTTP monitoring goes further: it measures how well a URL is responding by tracking DNS resolution time, TCP connection time, SSL handshake, server response (TTFB), and content download, every time a test runs.
Whether you're doing HTTP server monitoring for internal infrastructure, web service monitoring for third-party APIs, or simply need to monitor HTTP requests to a critical endpoint, the principle is the same: periodic, automated testing that gives you objective performance data instead of waiting for user complaints.
That distinction matters. A service can be technically "up" while users experience 8-second page loads. Uptime monitoring won't catch that. HTTP monitoring will.
What HTTP monitoring covers:
- Public websites and landing pages
- Internal web apps and employee portals
- REST APIs and web service endpoints
- SaaS platforms (Microsoft 365, Salesforce, etc.)
- Large file download endpoints for bandwidth testing
- CDN performance validation
One important note: HTTP monitoring tests a single URL. It executes one HTTP request and does not download the full page: no CSS, JavaScript, or image files. If you need to simulate a complete browser session, that's a different beast (more on that in the Obkio section below).

Why Does HTTP Monitoring Matter?
IT teams deal with performance complaints every day. The challenge is that users don't describe technical problems, they describe experiences. "The portal is slow." "The app keeps timing out." "The dashboard won't load."
Without HTTP monitoring, you're forced to guess. With it, you have data.
The business case is straightforward:
- Slow web applications cost revenue, productivity, and user trust: Every second of response time degradation has a measurable impact
- Most performance issues are intermittent: HTTP monitoring runs continuously, so it catches problems even when no one is actively complaining
- Many issues are SaaS-side or server-side, not network-side: HTTP monitoring gives you the data to prove it (or disprove it)
- SLA validation requires more than a ping: if a vendor commits to sub-200ms response times, you need HTTP response time data to hold them to it
The teams that get the most value from HTTP monitoring are the ones that run it alongside network monitoring by using both to draw a complete picture of network infrastructure health versus user-facing impact.
What Are Key HTTP Performance Metrics to Monitor?
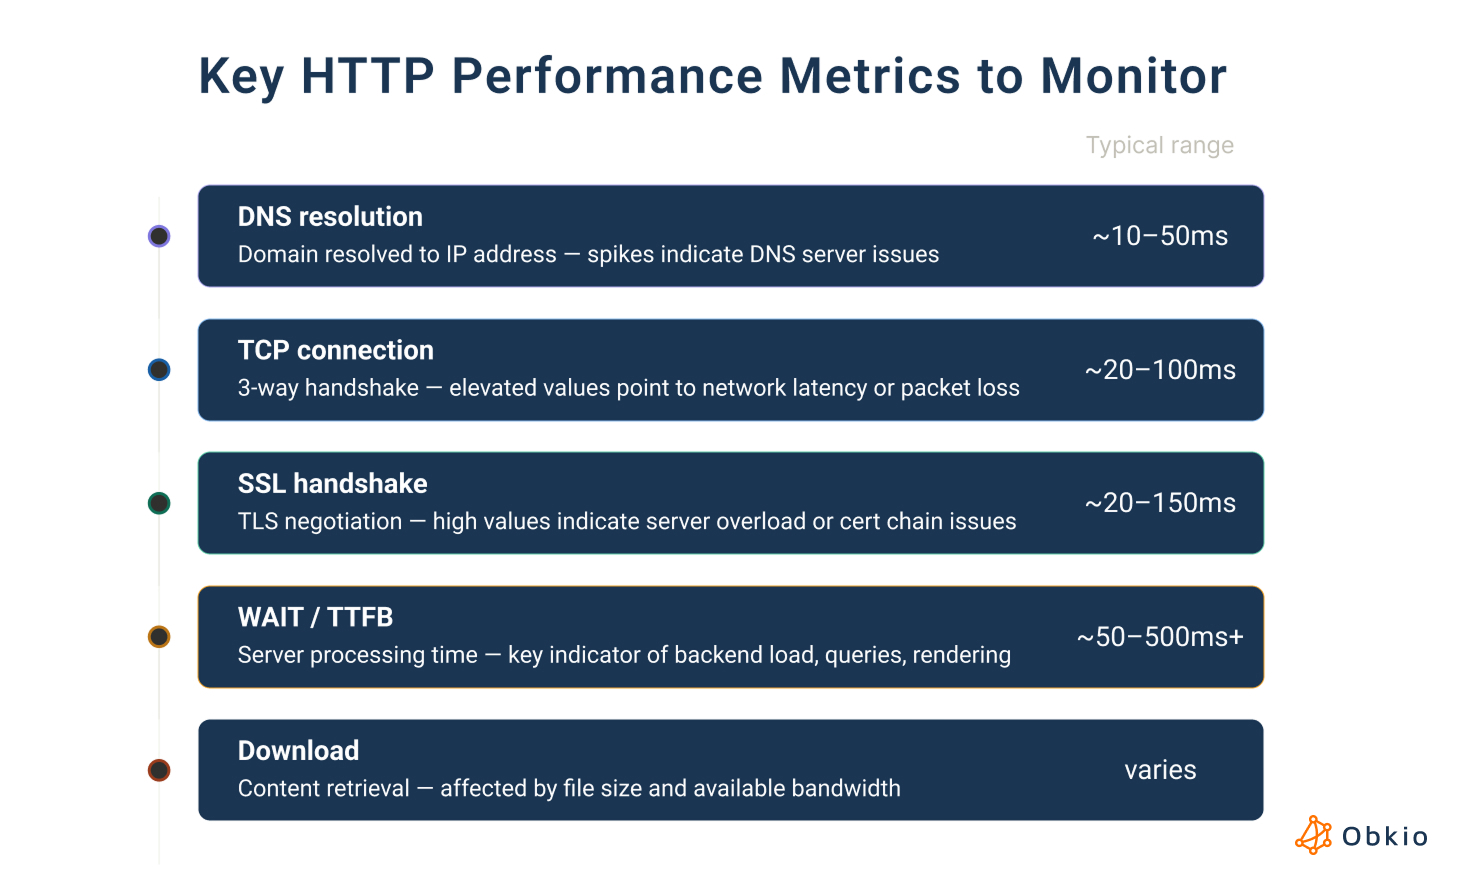
Every HTTP transaction is a sequence of distinct steps, and performance problems can hide in any one of them. Monitoring only the total response time tells you that something is slow. Monitoring each phase tells you what is slow and why.
The six core HTTP metrics map directly to the stages of an HTTP request lifecycle: domain resolution, connection establishment, security negotiation, server processing, content delivery, and the server's response code. Each one is a diagnostic layer. When you know which phase spiked, you know where to look and more importantly, who owns the problem.
Monitoring HTTP Performance Metrics with Obkio
If you're not already familiar with Obkio, here's the short version: Obkio is a network performance monitoring platform that uses software-based Monitoring Agents deployed across your network (on-premises, cloud, branch sites, remote offices) to run continuous synthetic tests and collect performance data from every location that matters to you.

- 14-day free trial of all premium features
- Deploy in just 10 minutes
- Monitor performance in all key network locations
- Measure real-time network metrics
- Identify and troubleshoot live network problems


Within that platform, Obkio's APM HTTP feature handles HTTP URL monitoring. It's available to all users (no enterprise tier required) and works without any involvement from the Obkio team to configure. You point it at a URL, assign agents, set a frequency, and it runs: continuously, automatically, from every location you've instrumented.
Each time an agent runs an APM HTTP test, it captures six transaction metrics corresponding to the phases below. Those metrics feed into the HTTP Duration graph: a stacked, per-phase breakdown that makes it immediately obvious where time is being spent in each request. A separate Download Speed graph tracks bandwidth consumption during the download phase, useful for throughput consistency testing.
With that context in place, here's what each metric measures and why it matters diagnostically.
Key HTTP Performance Metric #1: DNS Resolution Time
The time it takes to resolve the target domain to an IP address. Under normal conditions, this should be fast, typically under 50ms. Spikes in DNS resolution time usually point to a slow or overloaded DNS server, a misconfigured resolver, or a DNS propagation issue. Because DNS is measured as its own phase, HTTP monitoring effectively doubles as a lightweight DNS health check for every URL you monitor.
Key HTTP Performance Metric #2: TCP Connection Time
The time to complete the TCP three-way handshake between the agent and the server. Elevated TCP connection time is a network indicator — it typically signals high latency, packet loss, or congestion on the path between the agent and the destination. If this phase is slow but TTFB is fine, the problem is the network, not the server.
Key HTTP Performance Metric #3: SSL Handshake Time
The time for TLS negotiation. This phase only appears when monitoring HTTPS URLs (which is most URLs today). Consistently high SSL handshake times can indicate server-side resource pressure, certificate chain issues, or TLS configuration problems. A sudden spike in SSL time after a certificate renewal or server config change is a common signal.
Key HTTP Performance Metric #4: WAIT / Time to First Byte (TTFB)
The time between the agent completing the request and receiving the first byte of the response from the server. This is the most important application-layer metric. TTFB captures server processing time including database queries, backend logic, and page rendering. High TTFB means the server is slow, not the network. If TTFB spikes while TCP connection time stays normal, the issue is application-side.
Key HTTP Performance Metric #5: Download Time
The time to retrieve the actual page content after the first byte is received. Download time is affected by content size and available bandwidth. For simple HTML pages, this is negligible. For large file download tests, it becomes the primary metric for throughput consistency.
Key HTTP Performance Metric #6: HTTP Status Code
The response code returned by the server. HTTP status codes are the clearest signal of whether a request actually succeeded. The expected value is 200 (OK). 4xx codes indicate client-side errors; 5xx codes indicate server-side errors. If Obkio receives a 3xx redirect code, it stops and reports the redirect, it does not follow the chain. This is why best practice is to configure APM tests with the final destination URL to get accurate, uninterrupted measurements.
Key HTTP Performance Metric #7: Download Speed
A separate graph (not part of the HTTP Duration breakdown) that shows the bandwidth consumed during the DOWNLOAD phase. Most useful when testing large file download endpoints to validate throughput consistency over time, or when verifying that a rate-limited connection delivers consistent bandwidth.

How HTTP Monitoring Works
The mechanics are straightforward. Monitoring agents are deployed at relevant network locations like on-premises, cloud, branch sites, and remote offices. Each agent is configured with a target URL and a test frequency. At that interval, the agent sends an HTTP GET request to the URL, measures each phase of the transaction, and sends the results to the monitoring platform.
From there, the platform tracks results over time, surfaces trends, and triggers alerts when metrics exceed defined thresholds.
A few things that make HTTP monitoring more powerful in practice:
- Multi-agent testing: Running the same APM test from multiple agent locations lets you compare response times across geographies or network paths. If one site sees degraded HTTP performance while others are normal, the problem is localized, it's not the server, it's something between that site and the destination.
- Continuous synthetic testing: Unlike monitoring tools that rely on real user traffic, HTTP monitoring uses synthetic tests, which are controlled, scheduled requests generated by the agents. This means you get consistent measurements 24/7, regardless of whether anyone is actively using the application. Problems get caught at 2am, not when users arrive at 9am.
- Historical baseline: Over time, continuous testing builds a network performance baseline for every URL. That baseline is what makes alerts meaningful; instead of triggering on generic thresholds, you're alerting on deviations from your actual normal.

Learn what a network baseline is, why it’s essential for monitoring and optimizing performance, and easy steps to establish your baseline.
Learn moreWhat to Monitor with HTTP Monitoring
Not every URL needs HTTP monitoring, but more of them should be monitored than most teams realize. Here's a practical breakdown:
1. External websites and landing pages: your public-facing properties affect user acquisition and customer experience. Response time regressions after a deployment or CDN change are common and easy to catch with HTTP monitoring.
2. Internal web apps and portals: ERP systems, HR portals, internal dashboards. These are used constantly and rarely monitored. When they're slow, productivity suffers silently.
3. REST APIs and web service endpoints: APIs are the connective tissue of modern infrastructure. Web service monitoring (whether for REST APIs, authentication endpoints, or data retrieval calls) gives you early warning before downstream services are affected. If an API starts returning 5xx errors or response times climb past acceptable thresholds, you want to know before the services depending on it break.
4. SaaS platforms: Microsoft 365, Salesforce, ServiceNow. You don't control these, but your users depend on them. HTTP monitoring from your network gives you visibility into whether SaaS degradation originates at the vendor or somewhere on the path from your site to theirs.
5. Large file download endpoints: used specifically to test bandwidth throughput consistency. Set up an APM test against a large file URL with a rate limit configured in the advanced parameters to avoid congestion, and use the Download Speed graph to track whether available bandwidth stays consistent over time.
How to Run HTTP Monitoring Tests with Obkio
Obkio's Application Performance Monitoring (APM) feature is one of the most straightforward HTTP monitoring tools available for IT teams: no complex setup, no dedicated APM specialist required. It's built directly into Obkio's network performance monitoring platform, which means HTTP performance data lives on the same timeline as your network metrics. Here's how to set it up.

Step 1: Deploy Obkio Monitoring Agents
HTTP monitoring in Obkio runs through Monitoring Agents, which are software agents deployed at the network locations you want to test from. Agents are available for Windows, Linux, macOS, VMware, Hyper-V, hardware appliances, and cloud platforms. Deploy agents at every location relevant to your HTTP monitoring use case: head office, branch sites, data centres, cloud VPCs.
If you're just getting started, Obkio's Onboarding Wizard walks you through deploying your first agent and automatically creates a default APM HTTP test to google.com so you have a working baseline from day one.
Step 2: Configure an APM HTTP Template
In the Obkio app, navigate to the APM section and create a new APM Template. Select APM HTTP as the type (this is the default for non-enterprise accounts). Configure the following:
- Template Name: something descriptive, e.g. "APM – Salesforce Login Page"
- URL: enter the full target URL. Use the final destination URL and avoid URLs that return 3xx redirect codes, as Obkio does not follow redirect chains. Test with the URL you want to actually measure.
- Agent(s): select which agents will run this test. You can assign individual agents, agent groups, or check "All Agents" to run it across your entire deployment.
- Frequency: default is 1 minute. Adjust based on the criticality of the URL.
- Advanced Parameters (optional) : set a rate limit (bps) to cap bandwidth usage during download tests, configure connection timeout and total timeout thresholds, and add PagerDuty integration keys for alerting.

Step 3: Run the HTTP Tests
Once the template is saved and assigned to agents, tests begin running immediately at the configured frequency. No restart, no manual trigger needed. Each agent independently sends HTTP GET requests to the configured URL and captures the six transaction metrics: DNS, TCP, SSL, WAIT, DOWNLOAD, and Status Code.

Step 4: Analyze the HTTP Duration Graph
In the APM tab, select a specific test to view the HTTP Duration graph. This graph shows a per-phase breakdown of each HTTP transaction over time — a stacked visualization that makes it immediately clear which phase is responsible for any slowdown.
How to read it:
- Spikes in the DNS layer → DNS resolution issue, check your resolver
- Spikes in TCP → network latency or packet loss between agent and destination
- Spikes in SSL → TLS negotiation problem, check certificates or server load
- Spikes in WAIT/TTFB → server-side processing issue, escalate to the app team
- Spikes in DOWNLOAD → content size or bandwidth issue
- Non-200 status codes → service error or redirect chain, check the URL configuration
The graph tooltip displays all six metrics for any given data point, giving you the exact values for each phase.
Step 5: Analyze the Download Speed Graph
Alongside the HTTP Duration graph, Obkio provides a separate Download Speed graph that tracks bandwidth consumed during the DOWNLOAD phase of each test. Use this when:
- Running APM tests against large file download URLs to validate throughput
- Checking whether available bandwidth is consistent over time
- Validating that a rate-limited connection (e.g. an MPLS circuit with a committed rate) delivers consistently

Note: if you're running large file download tests without a rate limit configured, monitor bandwidth usage carefully. An unrestricted download test can saturate your Internet connection and create congestion. Set a rate limit in the APM Template advanced parameters to keep the test from affecting production traffic.
Step 6: Add APM Graphs to a Dashboard
Add both the HTTP Duration and Download Speed widgets to a shared Obkio dashboard alongside your network performance sessions (latency, packet loss, jitter). This side-by-side view is where HTTP monitoring becomes most powerful: you can see in a single glance whether a spike in HTTP response time correlates with a degradation in network metrics, or whether the network is clean and the problem is isolated to the application layer.
Bonus Step: Monitor Microsoft Teams with APM Teams
HTTP monitoring covers URLs. But if your team relies on Microsoft Teams for daily calls and meetings, there's a layer of application performance that APM HTTP alone can't reach: call quality.
Obkio's APM Teams feature extends the same synthetic monitoring approach to Microsoft Teams call performance.
How it works: The Obkio platform initiates a Teams meeting. Obkio Agents, equipped with Obkio's own Office 365 licenses, join the meeting and exchange synthetic audio and video data using SIP RTC. Obkio also connects to Microsoft's API to pull detailed call quality reports, giving you data from three perspectives simultaneously: the user's device, the network path, and Microsoft's infrastructure. Combined, this covers up to 99% of the Teams call path.

What it monitors:
- Network metrics affecting calls: latency, jitter, packet loss
- Audio and video quality: bitrate, codec, resolution, frame rate
- User device health: CPU usage, memory, network card performance
- QoS configuration against Microsoft's recommended settings
Why it matters alongside HTTP monitoring:
APM HTTP will tell you whether the Teams login portal or the Microsoft 365 admin URL is responding correctly. APM Teams tells you whether the actual call experience is degraded: choppy audio, frozen video, dropped connections. Those are different problems with different root causes. Running both gives you full-stack visibility into Teams: the service layer and the communication layer.
Step 7: Set Up Alerts for HTTP Metrics
Configure alert thresholds in the APM Template for response time degradation and status code errors. Obkio's smart notifications alert you when metrics exceed defined limits, before users start calling. Alerts can be delivered via email or integrated with PagerDuty directly from the APM Template configuration.

Do Network Problems Actually Impact Applications? How to Use HTTP Duration to Find Out
This is the most valuable thing HTTP monitoring does, and it's something network metrics alone can't answer.
Scenario 1: Network issue detected, application unaffected
Your network monitoring sessions show packet loss between two agents. Looks like a problem. But the APM HTTP test to your ERP portal returns a 200 with normal response times across all phases. The packet loss isn't on the path to that service, or it's being absorbed at a level that doesn't impact the application. Users are fine. No escalation to the app team needed.
Scenario 2: Network is clean, application is degraded
ICMP probes show no anomalies. Traceroute is clean. But the HTTP Duration graph shows sustained spikes in the WAIT phase for your internal HR portal. Response times are climbing; status codes are still 200. The network isn't the issue, the server is under load, or a recent deployment introduced a slow database query. The network team is off the hook. The app team needs to investigate.
Scenario 3: DNS as a hidden culprit
Users report slow application load times intermittently. Network metrics look fine. HTTP Duration shows normal TCP, SSL, and TTFB, but the DNS phase is spiking on tests from one specific site. The client's configured DNS server is underperforming. Without the DNS phase as a discrete metric in the HTTP Duration graph, this would have been nearly impossible to isolate without separate DNS testing.
HTTP monitoring doesn't replace network monitoring, it completes it. Running both gives you the full picture: infrastructure health AND the user-facing impact, or lack of it.
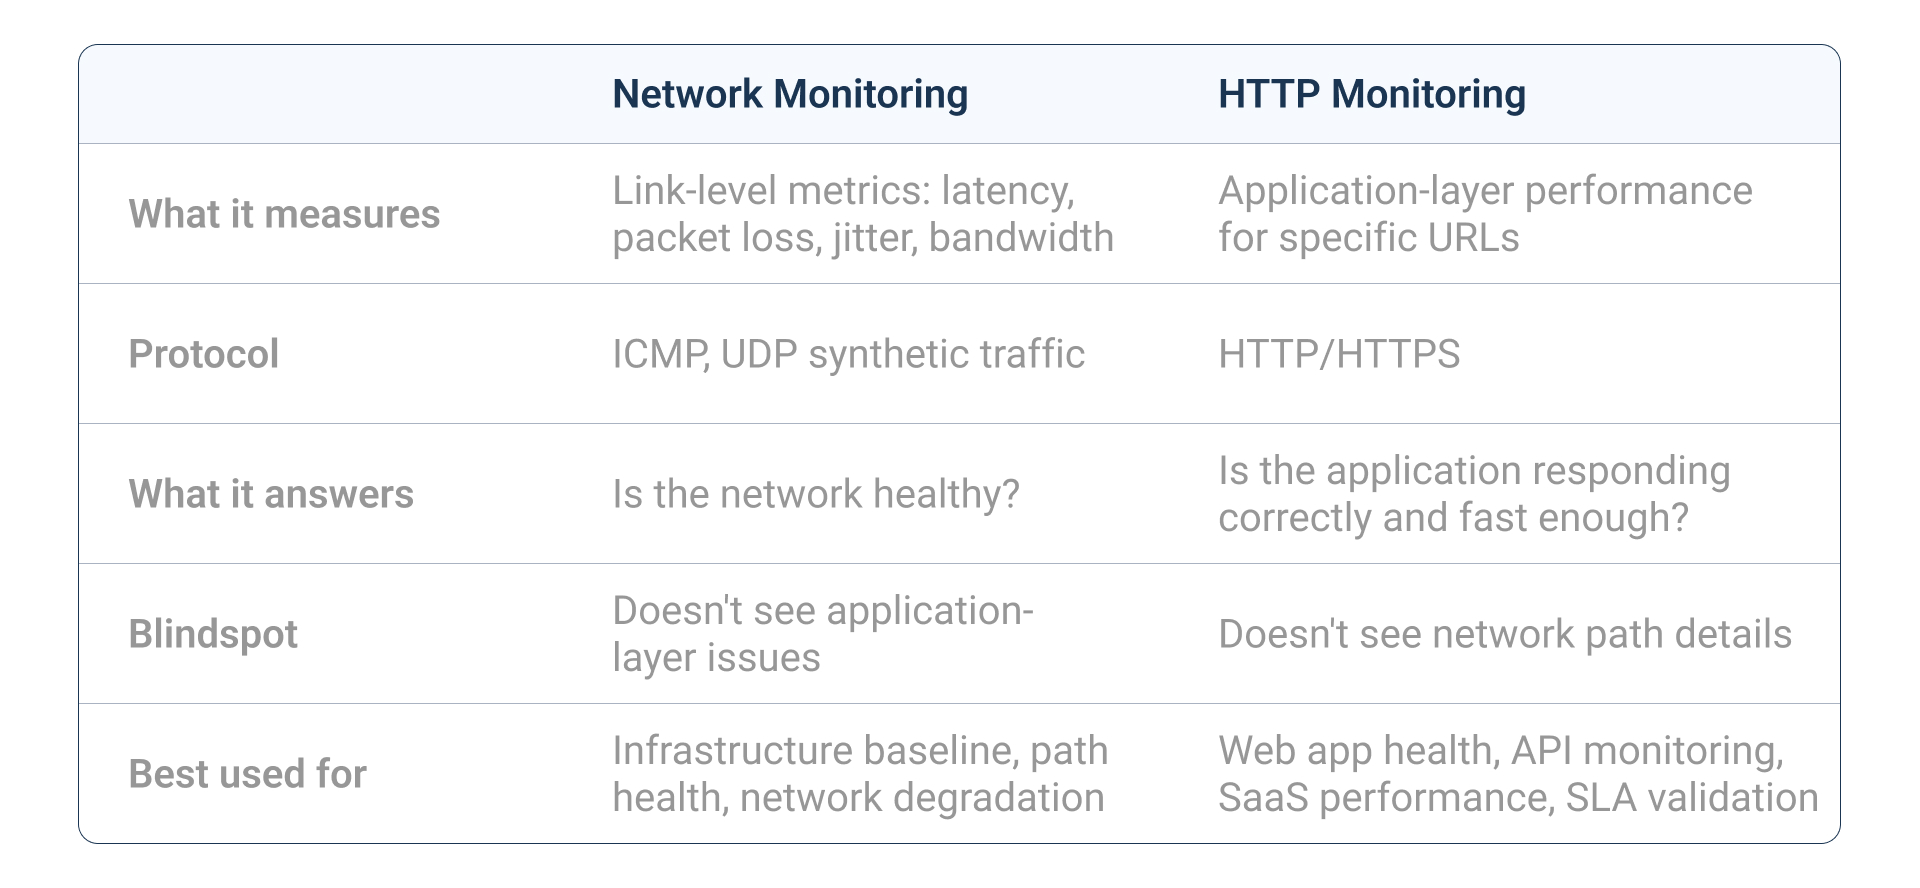
HTTP Monitoring vs. Network Monitoring: What's the Difference?
The two are complementary. Network monitoring tells you whether your infrastructure is healthy. HTTP monitoring tells you whether users are actually affected. Neither is sufficient on its own. Together, they give you the evidence to answer the question every IT ticket eventually comes back to: is it the network, or is it the application?
Obkio's APM HTTP feature is built to work alongside its network performance monitoring: same agents, same dashboards, same timeline. That correlation is the whole point.
HTTP Monitoring Best Practices
HTTP Monitoring 1. Use the final URL.
Always configure APM tests with the final destination URL. URLs that return 3xx redirect codes cause Obkio to stop at the redirect; you won't get accurate measurements of the actual destination. Test your URL first, confirm it returns a 200.
HTTP Monitoring 2. Monitor from multiple agent locations.
A single-agent HTTP test tells you about performance from one vantage point. Multi-agent testing tells you whether degradation is global (server-side or CDN-wide) or localized (a specific site or network path).
HTTP Monitoring 3. Set thresholds based on your own baseline.
Generic alert defaults are almost always wrong. Let Obkio collect a week or two of historical data before setting alert thresholds. Set your actual baseline, not arbitrary numbers.
HTTP Monitoring 4. Include a large-file URL for throughput testing.
Add one APM test per site specifically designed to download a large file with a rate limit configured. This gives you ongoing bandwidth consistency data without relying on on-demand speed tests.
HTTP Monitoring 5. Add APM graphs to dashboards alongside network metrics.
The side-by-side view is where the real diagnostic value lies. Don't leave HTTP Duration and Download Speed buried in the APM tab. Bring them into your shared dashboards.
HTTP Monitoring 6. Review historical trends, not just real-time spikes.
A single slow response might be noise. A gradual 200ms-per-week increase in TTFB over a month is a signal. HTTP monitoring data compounds in value over time.
Frequently Asked Questions
What is HTTP monitoring?
HTTP monitoring is the practice of periodically testing a URL by sending HTTP requests and measuring the performance of each phase of the transaction: DNS resolution, TCP connection, SSL handshake, server response (TTFB), and content download. It provides real-time visibility into web application performance and helps IT teams detect issues before users notice them.
What HTTP metrics should I monitor?
The six core metrics to track are: DNS resolution time, TCP connection time, SSL handshake time, WAIT/TTFB (Time to First Byte), download time, and HTTP status code. Download speed is a seventh metric worth tracking separately when testing bandwidth throughput consistency.
What is TTFB and why does it matter?
TTFB (Time to First Byte) is the time between completing an HTTP request and receiving the first byte of the server's response. It captures server-side processing time: database queries, application logic, and page rendering. High TTFB when network metrics are normal is the clearest indicator of a server or application problem.
What does an HTTP status code of 200 mean vs. 500?
A 200 status code means the request succeeded. A 500 (or any 5xx code) indicates a server-side error, meaning the server received the request but failed to process it. A 4xx code indicates a client-side error, such as a missing resource (404) or an authentication failure (401/403). In Obkio's APM HTTP, a 3xx code means the URL is redirecting. Configure the test with the final URL to avoid this.
What's the difference between HTTP monitoring and ping/uptime monitoring?
Ping and uptime monitoring are binary; they tell you whether a host is reachable. HTTP monitoring measures application-layer performance: how fast is the DNS resolution, how long did the server take to respond, what status code did it return? A service can pass a ping check while users experience degraded performance. HTTP monitoring catches that gap.
How often should HTTP tests run?
The default in Obkio is 1 minute. For critical applications, this is appropriate. For lower-priority or high-bandwidth URLs (like large file download tests), you may want to increase the interval to reduce bandwidth consumption. Configure frequency per APM template based on the criticality of the URL.
Can I monitor internal web apps with HTTP monitoring?
Yes. Any URL reachable by an Obkio Monitoring Agent can be tested with APM HTTP, including internal web apps, employee portals, and private APIs. This is one of the most valuable use cases: internal apps are used constantly and are almost never proactively monitored.
How does HTTP monitoring help isolate network vs. application issues?
By running HTTP monitoring alongside network monitoring, you can correlate application-layer performance with network-level metrics. If TTFB is elevated but TCP connection time is normal, the network is fine, and the server is the issue. If TCP connection time is elevated and TTFB tracks with it, the network path is the problem. The HTTP Duration graph in Obkio makes this comparison immediate and visual.
Start Monitoring HTTP Performance with Obkio
Most HTTP performance problems don't announce themselves. They creep in: a TTFB that slowly climbs after a backend update, a DNS resolution spike that only hits one remote site, a SaaS portal that's degraded for users in one region but fine everywhere else. By the time someone files a ticket, the problem has already been affecting users for hours.
That's the gap HTTP monitoring closes. Not by replacing what you already have, but by adding the application-layer visibility that network metrics alone can't provide.
Obkio's APM HTTP feature gives you continuous, synthetic HTTP monitoring from every network location where your agents are deployed with a per-phase breakdown of every transaction, historical trend data, and the ability to correlate application performance directly against network metrics on the same dashboard. No complex setup. No separate tool. It's built into the same platform you already use to monitor your network.
If you've been relying on user complaints to detect web application issues, it's time to get ahead of them.
- 14-day free trial of all premium features
- Deploy in just 10 minutes
- Monitor performance in all key network locations
- Measure real-time network metrics
- Identify and troubleshoot live network problems

