


Table of Contents
Table of Contents
Imagine your network as a complex orchestra. A harmonious interplay of various instruments—applications, servers, devices, firewalls, and more—creates the symphony of efficient data flow that keeps your business operations running smoothly. But just like a conductor needs a keen ear to identify even minor imbalances within the orchestra, you need a way to assess and audit the health of each network component.
Here's the challenge: manually monitoring and auditing this intricate network infrastructure can be a big mess of data points and configurations. To maintain optimal network performance and ensure seamless business operations, specialized tools are your secret weapon.
But with a plethora of auditing tools available, selecting the right one can feel like navigating a labyrinth. Further complicating the search, the world of software reviews can be riddled with bias. Just like sponsored listings on travel websites or the clearly marked ads in search results, you'd expect transparency in software recommendations. Unfortunately, that's not always the case.
Many software lists are primarily promotional, with top positions bought and paid for. These "pay-to-play" listings often overshadow smaller, innovative solutions with equally effective functionalities. This puts the Davids of the industry at a severe disadvantage against the Goliaths, making it difficult for them to compete for your attention. As a result, you, the end-user, might end up paying the price, quite literally, through expensive licensing fees for solutions that may not be the best fit for your needs.
Our goal is to change that. We believe in giving every solution a fair chance, which is why we've created a comprehensive and unbiased guide to network auditing tools. This guide serves as your trusty map, illuminating the functionalities of leading auditing solutions and empowering you to make an informed decision, free from commercial influence.
We'll delve into the diverse range of auditing tools, categorizing them for clear comprehension. Furthermore, we'll equip you with the knowledge needed to assess your specific network security requirements and select the ideal tool to safeguard your digital fortress.
So, let's embark on this journey together. By the end of this guide, you'll be equipped to identify and choose the perfect network auditing tool, ensuring your network remains efficient and optimized.
What is a Network Audit? 
A network audit (also known as network assessment) is a comprehensive network evaluation. It delves into the various components of your network infrastructure—hardware, software, applications, security protocols, and user access—to identify a wide range of issues. This includes potential security risks, vulnerabilities, bottlenecks impacting performance, and areas for infrastructure improvement.
Think of a network audit as a thorough examination. It's like taking your network to the doctor for a checkup. The doctor doesn't just check for infections (security threats); they assess overall health (performance, capacity) and identify areas that might need attention in the future.

Learn how to perform a network audit (network performance audit) to uncover issues before they cause havoc. Uncover Obkio's Network Audit Tool.
Learn moreThe Roadmap to Network Health: Goals of a Network Audit
During a network audit, IT professionals act as network detectives. They employ various techniques and tools for mapping network topology, analyzing network traffic, reviewing configurations, and assessing application performance. Their mission: gain a deep understanding of the network's health.
The ultimate objective of a network audit is to ensure your network is operating efficiently and securely, while also planning for its future needs. It's about proactively identifying and addressing potential issues before they snowball into major problems.
Here's a breakdown of the key goals of a network audit:
- Comprehensive Inventory: Identify and document all devices, software, and applications on the network.
- Vulnerability Assessment: Expose potential security weaknesses within the network.
- Performance Optimization: Identify areas where network performance can be improved, including application performance bottlenecks and more.
- Capacity Planning: Assess current network capacity and plan for future growth needs.
- Infrastructure Improvement: Identify areas where network infrastructure can be upgraded or optimized.
- Performance Baseline: Establish a benchmark for future network improvements and comparisons.
Why Invest in a Network Auditing Tool? Unveil Network Mysteries and Optimize Performance
Network problems can leave everyone pointing fingers. But before assigning blame, a network audit can shed light on the true source of the issues. Whether you manage a large distributed enterprise network or a smaller office setup, a network audit offers a wealth of benefits.
1. Unveiling Network Mysteries: Identifying Root Causes
Diagnosing network issues can feel like detective work. Slowdowns, outages, and connectivity problems often have hidden causes. A network audit acts as a magnifying glass, meticulously examining your network infrastructure—devices, connections, and configurations. By pinpointing the root cause of performance issues, downtime, or connectivity problems, the audit empowers network administrators to take targeted action and resolve problems efficiently.
2. Building a Strong Case: Securing External Support
The insights gleaned from a network audit can be a powerful tool when seeking external assistance. The audit report provides concrete evidence to support requests for technical support or specialized expertise. By leveraging the findings, you can collaborate with service providers (MSPs, MSSPs or VoIP providers) to address complex network challenges and ensure a swift resolution.
3. Separating Fact from Fiction: Is it Really the Network?
Not all performance issues arise from the network. Sometimes, network problems are side effects of issues caused by software, server configurations, or even user errors. A network audit helps clear the air. By systematically ruling out potential network-related causes, the audit allows you to focus your efforts on the true root of the problem, saving valuable time and resources.
4. Prioritizing Network Improvements: Making Informed Decisions
Large networks can be intricate ecosystems with numerous devices, connections, and locations. A network audit helps prioritize improvements and optimize resource allocation. By assessing the security posture, performance bottlenecks, and outdated components, administrators can identify areas that require attention. This allows for targeted upgrades, optimizations, or replacements to enhance overall network efficiency and resilience.
5. Navigating Network Change: Ensuring a Smooth Journey
The network is the foundation of your digital world. Before embarking on major upgrades, like migrating to new technologies (think MPLS to SD-WAN) or deploying innovative services (like VoIP or SASE), it's vital to prepare the network for a smooth transition. A network audit acts as a roadmap, identifying potential obstacles or limitations that could disrupt the migration or deployment process. By proactively addressing these concerns, organizations can minimize disruptions, optimize performance, and ensure the success of the new network technology or service.

Introducing Network Audit Tools: Your Trusted Allies in Revealing Network Weaknesses
Just like any detective needs the right equipment, a successful network audit relies on the right tools. Network audit tools are specialized software applications designed to act as your eyes and ears within the network. They provide a comprehensive view of your network infrastructure, helping you identify vulnerabilities, assess performance, and ensure security compliance.
These tools can:
- Map Your Network: Network audit tools create a detailed map of your network infrastructure, including all devices, connections, and configurations. This comprehensive picture allows you to identify potential weaknesses and areas for improvement.
- Hunt for Vulnerabilities: These tools act like vulnerability scanners, scouring your network for security gaps and misconfigurations that could be exploited by attackers. By proactively identifying these weaknesses, you can take steps to mitigate them before they become a critical security breach.
- Monitor Performance: Network audit tools can monitor network traffic and performance metrics, helping you pinpoint bottlenecks and identify areas that require optimization. This ensures your network is operating efficiently and can handle your current and future needs.
- Ensure Compliance: Some network audit tools include features to help you verify adherence to industry security standards and internal security policies. This helps you maintain a secure network environment and avoid potential regulatory non-compliance issues.
In essence, network audit tools are essential because they empower you to:
- Gain Visibility: See your network infrastructure through a clear lens, uncovering hidden weaknesses and potential security risks.
- Make Informed Decisions: Gather the data and insights needed to prioritize network improvements and optimize resource allocation.
- Proactive Security: Identify and address vulnerabilities before they can be exploited by attackers.
- Maintain Network Efficiency: Monitor performance and identify bottlenecks to ensure optimal network operation.
Without these valuable tools, conducting a thorough network audit would be akin to navigating a dark maze – you might miss crucial details and leave your network exposed to unnecessary risk.
How to Choose Your Network Auditing Tool Kit
Choosing the right network auditing tool empowers you to optimize performance, ensure compliance, and proactively identify potential issues. Here's a breakdown of key factors to consider when selecting the perfect auditing toolkit:
1. Features & Functionality:
- Match Your Needs: Identify your primary goals – is it optimizing performance, ensuring regulatory compliance, or conducting in-depth security assessments? Different tools cater to these varied needs. Explore options for vulnerability scanning, configuration management, performance monitoring, log management, and compliance auditing.
2. User-Friendliness:
- Seamless Navigation: A user-friendly interface is essential for your IT team to navigate the tool efficiently. They should be able to understand audit results, diagnose performance bottlenecks, and identify configuration inconsistencies with ease.
3. Scalability & Future-Proofing:
- Growth Ready: Your network will evolve. Choose a solution that can scale to accommodate future growth and changing network complexities.
4. Deployment Options:
- Cloud vs On-Premises: Consider your IT infrastructure and preferences. Cloud-based tools offer easy access and scalability, while on-premises solutions provide greater control.
5. Integration Potential:
- Work Together, Play Together: Ensure your chosen tools integrate seamlessly with existing IT management systems. This streamlines workflows and allows you to consolidate network data for a holistic view.
6. Customization & Adaptability:
- Tailored Operations: The ability to customize tools to your specific environment is crucial. Look for solutions that allow for customization and integration with additional auditing or performance monitoring tools as needed.
7. Vendor Reputation & Credibility:
- Track Record of Trust: Choose a vendor with a proven track record in network auditing solutions. Research their industry reputation and customer satisfaction to ensure reliability and support.
8. Financial Considerations:
- Cost-Effectiveness: Select a solution that aligns with your budget. Factor in licensing fees, subscription costs, and any additional implementation or training expenses.
9. Responsive Support:
- Help When You Need It: Reliable and responsive customer support is crucial. Ensure the vendor offers timely technical assistance, troubleshooting resources, and ongoing training opportunities.
10. Free Trial or Demo:
- Test Drive Your Tools: Before you commit to a network auditing tool, take it for a spin! Many vendors offer free trials or demos, allowing you to assess the software's features and user-friendliness firsthand. This hands-on experience is invaluable in determining if the tool meets your specific needs.
But here's a pro tip from a 10-year software industry veteran: Look for solutions that offer quick deployment with minimal upfront costs. This allows you to create a basic prototype of your network auditing environment. With this prototype, you can test different scenarios and gain a real-world understanding of the tool's capabilities. This approach helps you make a more informed decision – ensuring the chosen solution aligns with your organization's goals and scales effectively as your needs evolve.

Decoding the Most Popular Network Auditing Tools on the Market
The landscape of network auditing tools can be overwhelming, with various vendors offering a multitude of features. But before diving in, let's simplify things with a familiar concept: your home security system.
1. Traditional Network Monitoring and Network Auditing Tools: These are old-school alarm systems with basic door and window sensors. They provide a fundamental layer of security, similar to how traditional network auditing tools focus on identifying known vulnerabilities in devices and configurations. While reliable, they might miss more sophisticated threats.
2. Open-Source Network Monitoring and Network Auditing Software: Just like installing your own security cameras, some organizations opt for open-source network auditing tools. These solutions offer a cost-effective way to identify basic security weaknesses but may require more technical expertise to set up and manage.
3. Pure Network Performance Monitoring and Network Auditing Tools: Think high-tech security systems with motion sensors, smart locks, and remote monitoring. These advanced network auditing tools provide in-depth analysis, often leveraging agent-based solutions and penetration testing to simulate real-world attacks. They offer a comprehensive view of your network security posture.
4. Application Performance Monitoring with Network Performance and Auditing Tools: Many home security providers offer additional features like fire alarms or flood sensors. Similarly, some network management suites include basic network auditing capabilities alongside other many functionalities. While convenient, these built-in auditing features may not offer the same level of detail or customization as dedicated network auditing tools.
5. Packet Capture Based Network Monitoring and Network Auditing Software: Large security companies offer comprehensive systems with 24/7 monitoring and rapid response teams. This is similar to large network management vendors that provide a full suite of auditing tools, often integrated with security information and event management (SIEM) systems for real-time threat detection and response.
Just like choosing the right security system for your home, selecting the appropriate network auditing tools depends on your specific needs and security posture.
Remember: Network auditing tools are a vital line of defence, but a layered security approach is essential. Combine these tools with robust security policies, user education, and ongoing vigilance to keep your network safe.

Discover the art of crafting dynamic and intuitive network assessment reports with real-time dashboards and graphs using Network Monitoring tools.
Learn morePart 1 of Navigating Network Auditing Tools: The Top 6 Pure Network Performance Monitoring and Network Auditing Tools
In the realm of network auditing, pure-play NPM solutions stand out from traditional IT management platforms due to their specialized approach. Focused on network performance, these solutions provide advanced analytics and reporting functionalities. This empowers organizations to make informed decisions regarding their network infrastructure.
This section delves into the top 6 pure NPM tools excelling in network assessment. Leveraging agent-based solutions and synthetic testing, these tools diagnose and troubleshoot issues in real-time through application, infrastructure, and network monitoring. Each solution offers unique features and functionalities, catering to varying levels of network complexity.
We'll now explore what makes these 6 pure NPM tools stand out and how they can assist organizations in auditing their networks.
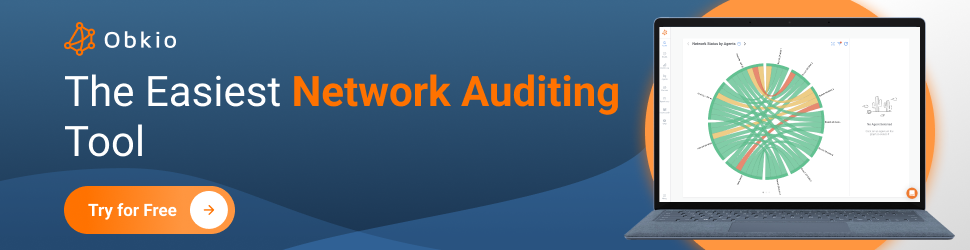
1. Obkio: Your Synthetic End-to-End Network Performance Monitoring and Network Auditing Software In One
Obkio isn't your one-stop shop for IT management. It excels in a specific area – network performance monitoring. Think of it as your dedicated cloud-based partner, keeping a watchful eye on your entire network infrastructure and applications.

Here's what sets Obkio apart:
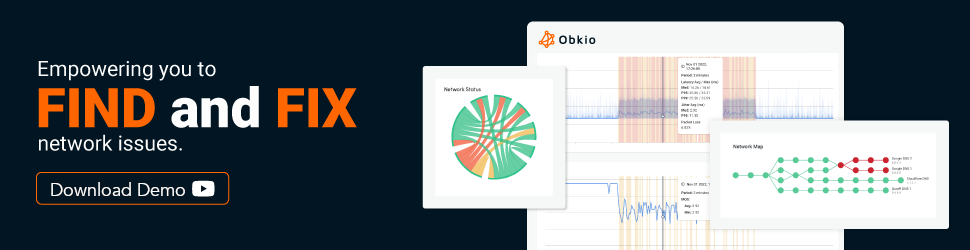
Real-Time Network Visibility: Obkio provides constant insights into critical network metrics like latency, packet loss, and jitter. This real-time visibility empowers you to identify and troubleshoot performance issues as they occur, ensuring a seamless user experience.
Comprehensive Monitoring Toolkit: Obkio goes beyond basic monitoring. It offers a comprehensive toolkit that includes active monitoring agents, network path monitoring, and cloud network monitoring capabilities. This multifaceted approach allows you to pinpoint bottlenecks and diagnose network issues swiftly.
Actionable Insights Made Easy: The user-friendly interface presents clear, real-time network performance data. This allows you to identify and address potential problems before they disrupt your end-users.
Effortless Setup, Big Impact: Getting started with Obkio is refreshingly simple. The setup process is straightforward, and the intuitive interface minimizes training needs for your IT team.
Scalability Across Industries: Whether you manage a small business network or a huge enterprise infrastructure, Obkio adapts to your needs. This scalability makes it a valuable tool across various industries, from professional managed services and manufacturing to finance and beyond.
In essence, Obkio empowers you to take a proactive approach to managing your network infrastructure and ensure optimal performance for your users. It's a reliable partner for performing a comprehensive network audit.
1.1. Obkio: Dedication to Network Performance Monitoring
Network performance monitoring tools focus on delivering a top-notch user experience for network performance, using advanced tools like agent-based solutions and synthetic testing.
Obkio takes pride in being part of this elite group. Leveraging their 20-year telecom industry expertise and 5 years in the NPM market, they've crafted a modern and comprehensive network performance monitoring tool.
Obkio isn't just about functionality – it looks good too. The sleek and user-friendly interface, along with customizable templates, provides deep insights into network performance in an easy-to-digest format.
So, whether you're aiming to optimize performance or prevent downtime, Obkio is the pure-play NPM player that can satisfy even the most demanding IT team. It's like a dedicated network watchdog, keeping your digital operations running smoothly and efficiently.

1.2. Obkio: Straightforward Pricing for Your Network Auditing Needs
Obkio keeps things simple when it comes to pricing. Their website offers various plans for:
- Single and home offices
- SMEs with less than 3 locations
- Mid to large multisite networks
- MSPs & large businesses
- Non-Profit Organizations
- Colleges and Universities
Costs are flexible, with per-agent prices decreasing as the number of agents increases. They also provide a free trial to test the platform before committing. Obkio offers an additional layer of convenience with the Price Calculator. Build your custom plan and receive a quote tailored to your specific needs and budget.

Obkio emphasizes transparency by avoiding hidden fees. Their pricing structure is based on a flat monthly fee per agent, device, and user. Data usage, bandwidth, and other complex metrics are not factored in, simplifying cost estimation. This clear pricing model allows you to easily budget for your network monitoring needs without surprises.
Learn more here: https://obkio.com/pricing/
Free Trial: https://obkio.com/signup/
Unleash Your Network's Potential with Obkio’s Network Auditing Solution!
Ready to unlock the true power of your network infrastructure? Obkio's state-of-the-art monitoring tool goes beyond basic monitoring, offering a comprehensive network assessment that dives deep. Gain in-depth insights into every aspect of your network's performance and identify areas for optimization.
Start your network assessment today with Obkio and unlock the full potential of your network!
- 14-day free trial of all premium features
- Deploy in just 10 minutes
- Monitor performance in all key network locations
- Measure real-time network metrics
- Identify and troubleshoot live network problems


1.3. Obkio: Support Built by the Experts Themselves
At Obkio, we believe in direct access to the experts. The same engineers who meticulously build Obkio day in and day out are the ones you'll interact with on our support channels.
Self-Service Support:
- Documentation Center: Our comprehensive Documentation Center provides a wealth of articles explaining how Obkio's solutions work. Find answers to your questions and delve deeper into specific functionalities.
- Community Forums: Engage with fellow Obkio users in our community-based forums. Ask questions, share insights, and participate in discussions to learn from each other's experiences.
Technical Support:
- Live Chat & Email: Need more personalized assistance? Reach out to our support team via live chat (available weekdays, 9am-5pm EST) or by email at support@obkio.com. Our team is responsive and aims to answer your questions within minutes.
- Dedicated Enterprise Support: For larger organizations, we offer dedicated support options. This includes in-depth account analysis, online Zoom meetings for private training, and onboarding assistance. Contact Obkio to learn more about these tailored support plans.
Obkio goes beyond basic support, providing direct access to the experts and a range of options to meet your technical needs, ensuring you get the most out of your network monitoring experience.
1.4. Obkio: Designed for Simplicity and Network Performance Auditing Insight
Obkio takes pride in its user-friendly interface. It's designed for easy navigation and access to all network monitoring and testing features. The intuitive layout provides real-time insights into network performance, empowering users to quickly identify and troubleshoot any issues that may arise.


Be guided through how to identify and troubleshoot network problems with Obkio’s Network Monitoring app tour and features through screenshots.
Learn more1.5. Positive Reviews Comments for Obkio
“You need a fantastic network for VoIP, but most people are not network experts and don’t know how to manage their network. Obkio eliminates the most tedious parts of the network assessment and puts the finger on the problem at hand.”
"Obkio was very easy to deploy and use, providing detailed network performance visibility without needing access to network equipment."
"Obkio is so user friendly and has so much power in simple views that has not only met our expectations and needs but is giving our organization added value in our Operations and Project teams."
"The team behind Obkio is absolutely amazing and passionate about what they do. Whenever there's something different happening with our servers, they write an email to wave a flag and when we don't understand, they take time to explain the situation."
"The nice part about Obkio cons is that you can discuss these with the Obkio team, and they will build those features for you."
"It is priced fairly low for the amount of features you get. Also, they are constantly working on making it better with more features and public agents."
"Accurate internet performance measurement and monitoring Ease of use Ease of deployment Support for Raspberry Pi, Windows and Linux Detailed breakdown of performance issues using weighted scoring."

1.6. Explore Obkio Firsthand: Demos and Personalized Assistance
Curious to see Obkio's network monitoring platform in action? Head over to their website for a detailed demo that walks you through the app's features and functionalities.
For a more tailored experience, book a one-on-one demo with Obkio's Network Pros! Discuss your specific network challenges, get troubleshooting help from the experts, and discover the Obkio features that best suit your needs.
2. Kentik
Kentik is a cloud-based platform that delves deep into your network's inner workings, providing real-time insights into traffic, performance, and security.
Here's what makes Kentik stand out:
Data Collection: Kentik acts as a data powerhouse, collecting massive volumes of network data from various sources like routers, switches, and firewalls.
Machine Learning Insights: Kentik uses advanced algorithms and machine learning to identify patterns and anomalies in network traffic, empowering you to quickly diagnose issues and optimize performance.
Security: Kentik goes beyond performance. Its advanced capabilities help you detect security threats lurking within your network traffic.
Kentik offers a comprehensive feature set, including network visibility and analytics, DDoS protection, peering analytics, cloud visibility, and network security. This makes it a popular choice for large enterprises, service providers, and Internet companies who need to perform complex network audits.

2.1. Kentik Positioning
Kentik doesn't settle for basic network monitoring. It delves deeper, offering a comprehensive toolkit for real-time visibility and analysis of network traffic. Here's how Kentik empowers you to optimize your network performance:
Traffic Analysis: Kentik acts as a network detective, collecting and analyzing traffic data from various sources like routers, switches, and firewalls. This provides you with real-time insights into traffic patterns, usage, and congestion, allowing you to pinpoint and troubleshoot issues swiftly.
Application Performance: Monitor application performance metrics like response times, throughput, and error rates. This allows you to identify and address issues impacting specific applications before they disrupt users.
Performance Metrics: Kentik offers a comprehensive set of network performance metrics, including latency, packet loss, and jitter. With this wealth of data, you can proactively monitor network performance and identify potential problems before they affect end-users.
Availability Monitoring: Kentik keeps a watchful eye on network availability and uptime. It alerts you instantly in case of any outages or network issues, minimizing downtime and ensuring optimal user experience.
Overall, Kentik's network performance monitoring tool empowers organizations to gain real-time visibility and insights for network audits. This allows for proactive network optimization, ultimately leading to a smoother and more efficient experience for end-users.
2.2. Kentik Customer Support
Kentik understands the importance of exceptional customer service. That's why they offer a comprehensive support program to ensure you get the most out of their platform:
Self-Service Support Portal: Kentik's online hub provides a wealth of resources, including documentation, FAQs, and knowledge base articles. Here you can find answers to common questions, troubleshoot challenges, and delve deeper into specific functionalities. You can also submit support tickets and track their status for personalized assistance.
24/7 Technical Support: Kentik offers round-the-clock technical support via email or phone. Their dedicated team is always ready to help you troubleshoot any problems you encounter.
Seamless Onboarding and Training: They offer personalized training sessions, best practices guides, and workshops to help you navigate the platform and unlock its full potential.
Expert Professional Services: Need a helping hand with customized integrations, data migration, or other specialized tasks? Kentik's professional services team is here to assist you.
They provide a robust customer service program, ensuring you have the resources and support needed to optimize your network and achieve success.
2.3. Kentik Network Performance Monitoring User Interface


2.4. Kentik Demo
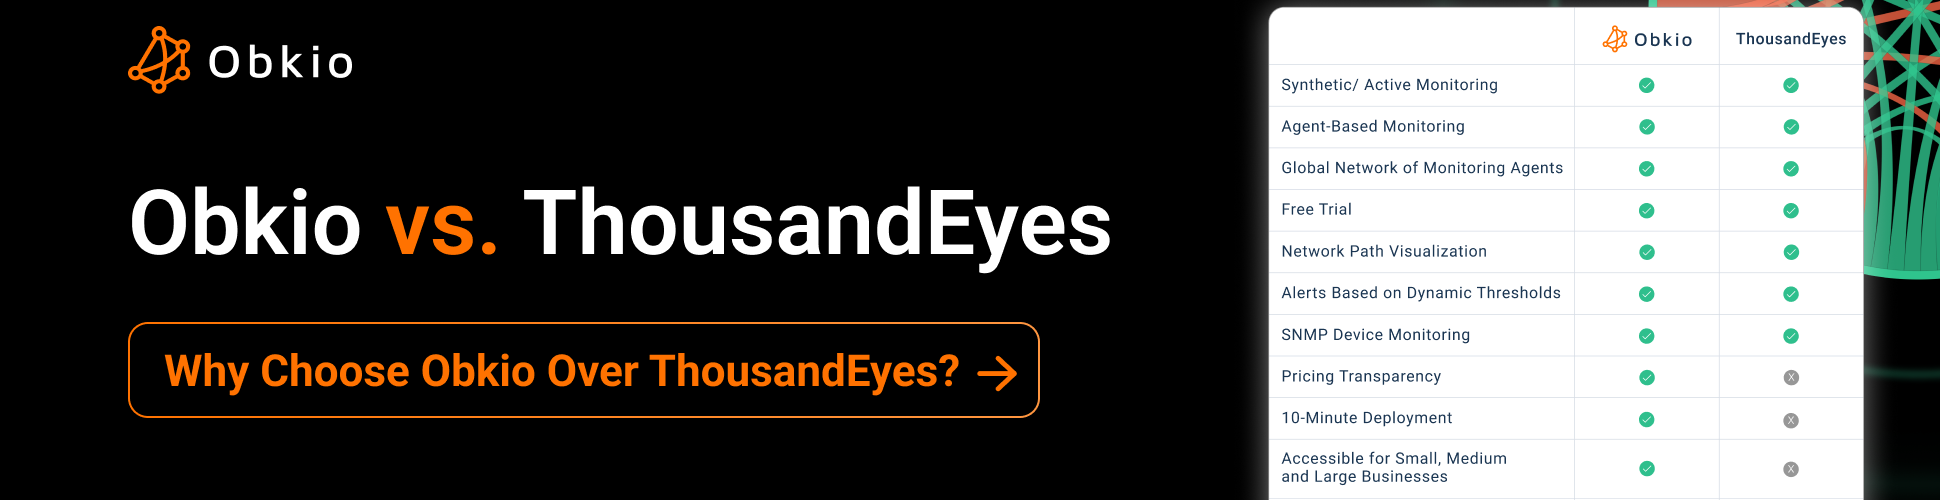
3. ThousandEyes
ThousandEyes, now part of the Cisco family, offers a cloud-based network intelligence platform that sheds light on the digital experiences users have across the internet.
Here's what sets ThousandEyes apart:
Global Setup: ThousandEyes utilizes a network of endpoint and cloud agents strategically positioned around the world. This comprehensive viewpoint allows you to monitor network, application, and service performance from diverse locations.
Digital Experience: ThousandEyes helps pinpoint network issues and diagnose problems that could negatively impact user experience.
Proactive Performance Management: ThousandEyes empowers IT teams to proactively improve the performance, availability, and security of their digital services. Gain real-time insights into the network infrastructure that supports your services and identify potential issues before they disrupt users.
ThousandEyes, now under the Cisco umbrella, offers a valuable tool for organizations seeking to perform network audits and optimize their digital experiences.

3.1. ThousandEyes Positioning
Targeting network specialists, ThousandEyes stands out as a pure-play NPM provider. They leverage cutting-edge solutions like agent-based monitoring and synthetic testing to deliver real-time, in-depth views of network performance – all from the end-user's perspective.
ThousandEyes caters to even the most demanding network experts with their comprehensive performance insights, allowing them to see beyond the surface and delve into network operations for proactive troubleshooting and optimization.
When AppDynamics and ThousandEyes join forces, organizations unlock a powerful advantage: comprehensive visibility into application and network performance, from the inner workings of applications to the underlying network infrastructure. This translates to faster identification and troubleshooting of performance issues, minimized downtime, and ultimately, optimized application performance for a smooth user experience.
3.2. ThousandEyes Customer Support
ThousandEyes goes beyond just the platform, offering a well-rounded customer support program to ensure your success:
Technical Support: Their technical support team is readily available via phone, email, or their online support portal to troubleshoot any issues you encounter.
Learning Resources: Dive deep with ThousandEyes' extensive documentation, including user guides, best practices, and technical references, to become a platform pro.
Training Programs: ThousandEyes offers various training options to fit your needs, from instructor-led sessions to self-paced online courses, and even certification programs to elevate your expertise.
User Community: Connect with other ThousandEyes users, share knowledge, and collaborate on solutions through their active online community, featuring discussion forums, knowledge bases, and user groups.
Professional Services: For specialized projects or initiatives, ThousandEyes provides professional services encompassing consulting, implementation, and customization to cater to your unique requirements.
3.3. ThousandEyes User Interface
ThousandEyes prioritizes user experience with a modern and intuitive interface. This clean and organized platform features a central dashboard that provides a quick snapshot of network performance with key metrics.
The interface empowers in-depth analysis from various perspectives. You can explore network topology maps, application flow data, and comprehensive device inventories. ThousandEyes allows for customization through the creation of personalized dashboards and reports to keep your focus on specific areas of interest.
They offer graphs, charts, and maps to bring the data to life. The platform's real-time visibility into network performance allows for swift identification and troubleshooting of any issues that may arise.


3.4. ThousandEyes Positive Reviews
"ThousandEyes has been very useful to identify network issues. It gives a complete overview concerning the path that the traffic takes through the service provider infrastructure."
"I like the ability to drill down into alerting at a very granular level and apply logic to cut down on the amount of noise in our alerting."
"Ease of set up and data collection. Standard scripting method used for synthetics. Secret sauce seems to be the ISP / Service Provider / LEC based latency detection all through the service delivery path. Good volume of Cloud agents representing global locations."
"The tool's capabilities are helpful for us in determining bottlenecks in our customer-facing applications."
3.5. ThousandEyes Demo
4. Catchpoint
Catchpoint DEM (digital experience monitoring) platform provides real-time insights into the performance of web and mobile applications, networks, and services globally.
Catchpoint empowers organizations to proactively monitor their digital services:
- Identify and troubleshoot issues before they impact end-users
- Gain granular data on performance metrics like page load times and network latency
- Utilize various monitoring capabilities, including website performance monitoring, network monitoring, and real user monitoring
Catchpoint's robust platform is trusted by industry leaders like LinkedIn, Comcast, and Adobe.

4.1. Catchpoint Positioning
Catchpoint strategically positions various monitoring agents across multiple cloud providers, ISPs, and data centers worldwide. This extensive network allows you to monitor performance from diverse locations, including within your network, at the edge, and in the cloud.
It offers a comprehensive suite of monitoring tools:
TCP Traceroute: Gain insight into the network path between client and server, pinpointing any latency or packet loss issues that may hinder performance.
Network Path Visualization: This feature creates a visual map of the network path, detailing hop-by-hop latency and packet loss for clear troubleshooting.
DNS Monitoring: Catchpoint keeps an eye on your DNS resolution times and the overall health of your DNS infrastructure.
Network Device Monitoring: Monitor the performance of network devices like routers, switches, and firewalls, and receive alerts if performance drops below optimal levels.
Network Topology Mapping: Get a clear visual representation of your entire network topology, allowing you to swiftly identify performance issues and their impact on business-critical services.
With Catchpoint's network performance monitoring, IT teams gain the visibility and insights needed to audit network performance, minimize downtime, and ultimately, deliver a superior user experience.
4.2. Catchpoint Customer Support
Catchpoint understands the importance of exceptional customer service, and offers a robust program to ensure you get the most out of their platform:
24/7 Technical Support: Catchpoint's dedicated support team is available around the clock to answer any questions or troubleshoot any issues you encounter via phone, email, or chat.
Customer Success Partnership: Catchpoint's Customer Success team will provide best practice guidance and help you optimize your monitoring and alerting configurations to get the most out of Catchpoint.
Tailored Professional Services: Catchpoint offers a range of professional services, including onboarding, configuration, integration, and consulting to ensure a smooth and successful implementation.
Extensive Knowledge Base: Catchpoint's Knowledge Base is a treasure trove of resources, including user guides, best practices, and troubleshooting tips to help you navigate the platform and maximize its value.
With Catchpoint's comprehensive customer service and support program, you're sure to get the most out of your digital experience monitoring investment.
4.3. Catchpoint User Interface


4.4. Positive Reviews/Comments
"Very flexible to use product, lots of API possibilities."
"It is a powerful tool-It has many useful functionalities -It has support for different kinds of test -It has an excellent support team."
"Easy to use. No prior knowledge is needed. Easily integrates with multiple services and systems."
4.5. Catchpoint Demo
5. AppNeta
AppNeta empowers enterprise IT teams to take control of application and network performance. Their cloud-based platform, AppNeta Performance Manager, offers end-to-end visibility, from the user's device all the way to the application server and back.

Here's what makes AppNeta stand out:
Real-Time Insights: AppNeta utilizes a combination of active and passive monitoring techniques, providing real-time visibility into application performance across various network environments, including cloud, SaaS, and on-premises deployments.
Proactive Problem Solving: AppNeta empowers IT teams to proactively address network and application performance problems before they disrupt end-users, minimizing business impact and ensuring a smooth user experience.
Network Troubleshooting Toolkit: AppNeta equips your IT team with a comprehensive toolkit for network troubleshooting. This includes features for network path analysis and packet capture analysis, allowing for efficient problem identification and resolution.
Overall, AppNeta is the go-to solution for IT teams seeking to perform network audits and proactively manage application and network performance.
5.1. AppNeta Positioning
AppNeta's network performance monitoring (NPM) takes a unique two-pronged approach to provide real-time visibility into how your network and applications function together.
- Active Insights with FlowView: AppNeta's proprietary technology, FlowView, actively sends test traffic across your network. This allows them to measure key performance metrics like latency, packet loss, and jitter, giving you a clear understanding of how your network is performing.
- Passive Analysis with PacketTrace: Complementing the active approach, AppNeta utilizes PacketTrace for passive monitoring. This technique captures and analyzes real network packets, providing a detailed view of application flows, network conversations, and device-level statistics.
By combining active and passive techniques, AppNeta's NPM solution offers comprehensive end-to-end visibility which is crucial for network auditing. They collect and correlate data from various sources, including application performance metrics, network flow data, packet data, and device-level statistics. This data is then presented in a central dashboard, empowering IT teams to swiftly identify and troubleshoot any network performance issues that may arise.
5.2. AppNeta Customer Support
AppNeta provides a comprehensive support program to ensure you get the most out of their network performance solutions:
Technical Support: Their technicians are available via phone and email during business hours to troubleshoot and resolve any issues you encounter with the AppNeta platform.
Seamless Onboarding and Training: AppNeta offers personalized training sessions, along with resources and documentation, to get you up and running quickly and efficiently.
Expert Professional Services: For more complex deployments or custom integrations, AppNeta's professional services team is here to assist you They'll help with installation, configuration, and customization to ensure the platform meets your specific business needs.
Online Community: AppNeta fosters a vibrant online community forum moderated by their staff. This valuable resource allows you to learn from fellow users and get additional support.
AppNeta's commitment to excellent customer service ensures you can maximize the value of their network performance monitoring and troubleshooting solutions.
5.3. AppNeta User Interface


5.4. AppNeta User Reviews
"The synthetic traffic with auto diagnostics. The multi route path creation and analysis is very useful."
"In particular, TraceView helps to quickly identify trends in the performance. It helps to track, isolate or fix the outliers affecting application performance. The ability to monitor the application at all levels in the application stack is amazing."
5.5. AppNeta Demo
6. LiveAction
LiveAction tackles network performance monitoring with their powerful tool, LiveNX. LiveNX goes beyond basic monitoring, offering real-time analysis of key network metrics. With LiveNX, network administrators gain a comprehensive view of their network infrastructure, allowing them to:

- Troubleshoot Performance Issues: LiveNX empowers you to pinpoint and resolve network performance bottlenecks efficiently.
- Optimize Network Performance: Gain valuable insights to optimize your network's overall performance.
- Proactive Network Management: Leverage features like network topology mapping, device discovery, and automated alerts to proactively identify and address potential issues before they disrupt operations.
LiveNX integrates seamlessly with a wide range of network devices and offers deployment flexibility, supporting both on-premises and cloud environments. With LiveAction's LiveNX you can ensure optimal performance and perform a comprehensive audit of your network.
6.1. LiveAction Positioning
LiveAction's LiveNX delves deeper to provide a comprehensive understanding of your network's inner workings. Here's what sets LiveNX apart:
Flow Data Expertise: LiveNX leverages flow data collected from network devices (routers, switches) to offer insights into both network traffic and application performance.
Real-Time Visibility: Gain a live view of your network's performance metrics, including bandwidth utilization, packet loss, latency, and jitter. This allows for swift identification and resolution of any issues that may arise.
Automated Monitoring Assistant: LiveNX automatically discovers and maps your network topology, creating a visual representation of how devices connect and traffic flows.
Proactive Problem Detection: Define performance thresholds and configure automated alerts. LiveNX will notify you of potential problems before they snowball into major disruptions.
Historical Insights: LiveNX stores historical flow data, allowing you to analyze trends and patterns over time. This helps to compare past and present network audits, empowering you to make informed decisions for future network optimization.
Application Performance: LiveNX analyzes flow data to pinpoint which applications are bandwidth hogs or causing performance issues, allowing for targeted troubleshooting.
LiveNX equips network engineers with a powerful toolkit for monitoring and optimizing network performance. This translates to a smooth-running, efficient network that supports your operations seamlessly.
6.2. LiveAction Customer Support
LiveAction understands that exceptional customer service is key to your network optimization success. That's why they provide a comprehensive support program for LiveNX users:
24/7 Technical Support: With an active maintenance contract, you have access to round-the-clock technical support via phone, email, or the LiveAction support portal for any technical issues or product questions that may arise.
Dedicated Customer Success Team: Their customer success team is invested in your journey, offering product onboarding, training, and adoption guidance to ensure you maximize the value of LiveNX.
Expert Professional Services: LiveAction's certified engineers provide professional services encompassing deployment, configuration, and customization to meet your unique needs.
Knowledge at Your Fingertips: LiveAction's extensive knowledge base is a treasure trove of resources, including product documentation, training videos, FAQs, and more – all accessible through the convenient LiveAction support portal.
Online Community: LiveAction fosters an online community forum where you can share experiences, ask questions, and gain valuable insights from other LiveNX users.
LiveAction's commitment to exceptional customer service ensures you have the resources and support needed to optimize your network performance and achieve success with LiveNX.
6.3. LiveAction User Reviews
"Ease of use. LiveAction allows us to track down network issues very easily. We have found and resolved at least 50 problems while using this product since it was implemented."
"Easy to use, easy to set up and works. Within a few hours of setting up the demo of the service and adding a few devices, we found an asymmetric routing issue we weren't even aware of."
"Fat client interface is still available so we are not forced to use a WebGUI like so many other vendors."
6.4. LiveAction User Interface


Part 2 of Navigating Network Auditing Tools: The Top 8 Traditional Network Monitoring and Network Auditing Tools
Just like a captain relies on their crew to navigate a vast ship, organizations depend on a variety of tools to ensure smooth sailing for their IT infrastructure. IT management platforms are the captains in this scenario, wielding the power to oversee various aspects of your network.
This section explores 8 of the most trusted IT management platforms, or traditional network monitoring tools, known for their network auditing capabilities.

Discover the superheroes of network monitoring tools in our comprehensive guide. Unveil the perfect type of network monitoring tool for your business.
Learn more1. PRTG Network Monitor
PRTG Network Monitor caters to organizations of all sizes with three distinct solutions:
- PRTG Network Monitor: This core solution acts as your network's watchful eye, providing real-time monitoring and alerts for network devices, applications, and servers. It keeps a pulse on network performance, bandwidth usage, and availability, and empowers you with customizable dashboards, reports, and notifications to stay informed.
- PRTG Enterprise Monitor: Geared towards sprawling IT environments, this advanced solution offers features like distributed monitoring, load balancing, and failover. It can manage multiple PRTG instances, giving you a centralized view of network performance across diverse locations— a must-have for complex network infrastructures.
- PRTG Hosted Monitor: Take the complexity out of network monitoring! This cloud-based solution, hosted on Paessler's servers, provides real-time monitoring and alerts without the burden of on-premises hardware or infrastructure. It's a fully-managed service that lets you focus on what matters most – managing your network effectively.
PRTG's commitment to flexibility ensures you can choose the solution that will audit your organization's network.
1.2. PRTG Network Monitor Positioning
PRTG Network Monitor is a well-respected name in network performance monitoring (NPM). They've carved out a niche as a dependable solution for traditional infrastructure monitoring, with a strong focus on both systems and network health.
PRTG has continuously adapted its legacy solution to address evolving market needs. They offer a comprehensive toolkit that empowers organizations to identify, troubleshoot, and optimize network performance.
However, it's important to note that PRTG's solutions primarily rely on traditional protocols like SNMP, Flow-Based, and ICMP. While effective, these methods may not deliver the all-encompassing insights and visibility needed to fully optimize complex IT environments.

Think of PRTG as a reliable veteran in the network monitoring field. They provide a proven solution for core infrastructure monitoring, but for cutting-edge features and in-depth visibility into intricate IT ecosystems, you might consider exploring other options.
1.3. PRTG Network Monitor Customer Support
PRTG understands that exceptional customer service is vital to your network monitoring success. That's why they provide a comprehensive support program:
Technical Assistance: PRTG offers technical support via phone, email, or their support portal to troubleshoot any issues you encounter using the platform.
Knowledge Base: Empower yourself with a wealth of resources! PRTG's extensive documentation includes user manuals, guides, knowledge base articles, and video tutorials – all readily available to guide you through effective platform utilization.
Online Community: PRTG fosters a vibrant online community with discussion forums, knowledge bases, and user groups where you can share insights, ask questions, and collaborate on solving monitoring challenges.
Training and Development: PRTG offers training programs, including instructor-led sessions, self-paced online courses, and even certification programs, to help your team get the most out of the platform.
Expert Professional Services: For more specialized needs, PRTG offers professional services. Their certified consultants can assist with projects, implementation, and customization to perfectly tailor the platform to your specific requirements.
Staying Ahead of the Curve: PRTG is committed to ongoing maintenance and updates. They deliver regular updates to ensure the platform remains secure, up-to-date with the latest technologies, and equipped with the most advanced features.
PRTG's dedication to exceptional customer service ensures you have the resources and support needed to navigate your network monitoring journey with confidence.
1.4. PRTG User Interface


1.5. PRTG User Reviews
"The feature that I find most appealing about PRTG is that it can be customized according to our requirements and is easy to put into practice."
"The excellent thing about this system is that we don't have to be concerned if we don't receive any notifications; in fact, it implies that everything is well. The user interface is straightforward to use and allows us to set up and modify the monitoring devices and sensors we have to monitor."
"The ability to integrate it with a variety of market solutions, as well as the plethora of interface elements that are already available make it admirable for our business."
1.6. PRTG Demo
2. ManageEngine OpManager
ManageEngine OpManager isn't just another network monitoring tool, it's a comprehensive suite designed to optimize your entire network's performance, which makes it a pretty good platform for performing network audits. While ManageEngine offers a broader range of IT management functionalities, let's dive into its network performance monitoring capabilities:
Real-Time Network Visibility: Gain complete transparency into your network's health with real-time monitoring of devices, servers, applications, and crucial metrics like bandwidth usage.
In-Depth Monitoring with Diverse Protocols: OpManager supports a wide range of protocols, including SNMP, ICMP, WMI, and CLI. This comprehensive approach ensures you have a clear picture of your network's overall performance.
Proactive Problem Identification: Leverage features like network mapping, threshold-based alerting, and customizable dashboards to proactively identify and address potential issues before they disrupt your operations.
User-Friendly Design: Its user-friendly interface and straightforward installation process make it accessible for organizations of all sizes and technical backgrounds.

OpManager empowers you to take control of your network performance and optimize its efficiency. This translates to a smoothly running network after performing a comprehensive audit.
2.1. ManageEngine OpManager Positioning
ManageEngine OpManager goes beyond basic monitoring by offering a comprehensive suite of tools designed to optimize your entire IT infrastructure. Here's why ManageEngine OpManager is a strategic choice:
Market Leader with a Proven Track Record: ManageEngine is a well-established player in the NPM market, recognized for its dependable solutions.
Actionable Insights for Network Optimization: OpManager empowers organizations to identify and resolve issues swiftly, ensuring a healthy and efficient network.
Versatility in Monitoring Protocols: ManageEngine offers a well-rounded approach, supporting various monitoring protocols like SNMP, Flow-Based, and ICMP. T
A Solution for Every Need: Whether your goal is to enhance network performance, troubleshoot problems, or prevent costly downtime, ManageEngine OpManager is a reliable and effective solution.
2.2. Manage Engine OpManager Customer Support
To ensure that users get the most out of their network performance monitoring tools, ManageEngine offers a variety of support services. Email support, community forums, online documentation, and a knowledge base are some of their support offerings. In addition, they provide chat, phone, and remote support for clients who require quick help with their products.
In order to assist businesses in making the most out of their NPM solutions, ManageEngine also provides expert services like installation, configuration, and customization. Their team of professional services works closely with clients to figure out their needs and offer solutions that are specifically tailored to fulfill those goals.
In general, ManageEngine's support services are made to assist clients in swiftly and simply resolving any problems they might run into when utilizing their products. Their knowledgeable support staff is on hand 24 hours a day to help clients get the most out of their network performance monitoring investment by responding quickly and efficiently.
2.3. Manage Engine OPManager User Interface


2.4. Manage Engine OPManager User Reviews
"The unified monitoring, easy integration, and alert notification management, the ability to monitor and manage various IT infrastructure components in one product. This makes it a popular choice for many organisation looking to streamline their IT operations and simplify the management of their IT infrastructure."
"Outstanding and quick service/support always available for questions or problems. - Scalability throughout different networks- integration with other services (like SSO from Azure-ad) - high level of details of devices over a long period of time once the initial setup is completed."
"24x7 Real-time Monitoring and always provide true notification or alerts over mail. We can schedule a number of auto generated customized reports which help us get a consolidated standard report, so that it's easy to analyze and investigate problems before the issue arises."
2.4. Manage Engine OPManager Demo
3. SolarWinds
A network monitoring tool called SolarWinds Network Performance Monitor (NPM) offers real-time visibility into the health and performance of networks. Network performance can be optimized, problems can be found and fixed, and network infrastructure can be monitored and managed, which covers most requirements for effective network auditing.
Both an on-premises and cloud-based Software as a Service version of SolarWinds Network Performance Monitor are offered. SolarWinds NPM Cloud is the name of the cloud-based version.

3.1. SolarWinds Positioning
SolarWinds is a familiar name in the network performance monitoring (NPM) market. They've established a strong reputation for delivering comprehensive tools, originally focused on traditional infrastructure monitoring of systems and networks.
SolarWinds has continuously adapted its solutions to address the evolving needs of the IT landscape. They now offer a broad range of NPM tools that empower organizations to:
Troubleshoot Issues Efficiently: SolarWinds equips you with the necessary tools to pinpoint problems and resolve them swiftly.
Identify Areas for Optimization: Gain valuable insights to identify bottlenecks and areas where your network performance can be enhanced.
Optimize Network Performance: Leverage SolarWinds' comprehensive toolkit to fine-tune your network for optimal efficiency.
It's important to note that SolarWinds primarily relies on traditional protocols like SNMP, Flow-Based, and ICMP. While effective, these methods may not provide the all-encompassing visibility needed to fully assess highly complex IT environments.
3.2. SolarWinds Customer Support
SolarWinds prioritizes exceptional customer service, ensuring you maximize the value of their Network Performance Monitor. Here's a breakdown of their support program:
24/7 Technical Support: SolarWinds offers round-the-clock technical assistance via phone, email, and online chat to address any technical issues you encounter.
Knowledge Base: SolarWinds provides extensive product documentation, including user guides, installation guides, and knowledge base articles.
Product Training: SolarWinds offers product training courses and webinars designed to help your team get the most out of the Network Performance Monitor and leverage its features effectively.
Customer Community: The SolarWinds Customer Success Centre fosters a vibrant online community where you can ask questions, share best practices, and collaborate with other users.
Expert Professional Services: SolarWinds offers professional services with certified engineers to tailor the Network Performance Monitor to your specific network environment and requirements.
The sheer volume of information available through the SolarWinds customer success portal may seem overwhelming at first. However, don't hesitate to leverage these materials or reach out to their support team for personalized assistance.
3.3. SolarWinds User Interface


3.4. SolarWinds User Reviews
"The network map it creates is very helpful for seeing any issues with LAN or WAN links. The dashboards are good and provide the level of information that we would want to see. The Top 10 lists are great for prioritising what the team should focus on."
"UPDATE: The tool is still easy to use, this did not change. Also, reports are customizable fully and this one is a really good part of the tool. Module configuration is easy for even beginner users. Alerts can be integrated into any chat-ops or incident management tools. Reports can be configured in any way …"
"The ease of setup and getting started. NPM works pretty much flawlessly. Reporting is flexible and useful. Agent and SNMP/WMI."
3.5. SolarWinds Demo
4. ScienceLogic
ScienceLogic empowers businesses with a centralized IT monitoring platform, granting them complete oversight and control over their entire IT infrastructure. This solution encompasses both on-premises and cloud-based environments, including servers, networks, storage, applications, and more.
With ScienceLogic, IT teams can audit their network using real-time insights into critical aspects like performance, availability, and overall health. This proactive approach enables them to identify and address potential issues before they disrupt end-users. Furthermore, ScienceLogic streamlines operations by automating routine tasks, minimizing manual intervention, and maximizing IT team efficiency.

ScienceLogic boasts a robust feature set, including customizable dashboards for tailored data visualization, advanced analytics for in-depth trend identification, intelligent alerting for prompt issue notification, and automated remediation for swift problem resolution. Additionally, it integrates seamlessly with other IT management tools, fostering a unified ecosystem for streamlined IT operations.
ScienceLogic's scalability caters to businesses of all sizes and across diverse industries, including healthcare, finance, telecommunications, and government agencies.
4.1. ScienceLogic Positioning
One of ScienceLogic's primary functions is to provide network performance monitoring. IT pros can use it to see network performance in real-time and see possible problems before they affect end users.
You can monitor network traffic, bandwidth usage, and other important performance metrics throughout your whole network infrastructure—including routers, switches, firewalls, and other network devices—with ScienceLogic's network performance monitoring service. To assist you in promptly identifying and resolving network issues, it also provides intelligent alerting and comprehensive analytics.
ScienceLogic's network monitoring features can also be expanded to include multi-cloud and hybrid settings.
4.2. ScienceLogic Customer Support
ScienceLogic provides a comprehensive support program designed to empower you at every stage:
24/7 Technical Support: ScienceLogic offers round-the-clock technical assistance via phone, email, and a web-based support portal. Their team of experienced engineers is on standby to tackle any challenge related to installation, configuration, or troubleshooting the ScienceLogic platform.
Expert Professional Services: ScienceLogic's professional services team offers comprehensive support, from initial installation and configuration to ongoing maintenance and optimization, guiding you toward a streamlined and effective IT monitoring experience.
Team's Expertise: ScienceLogic provides a range of training and certification programs, encompassing both online and in-person options. These programs equip your team with the skills and expertise to leverage the ScienceLogic platform to its full potential.
Community and Knowledge Base: ScienceLogic fosters a vibrant online community where you can share best practices, ask questions, and collaborate with other users. Furthermore, their comprehensive knowledge base offers a treasure trove of documentation related to the platform, empowering you to find answers and troubleshoot challenges independently.
4.3. ScienceLogic User Interface


4.4. ScienceLogic User Reviews
"Highly capable & broad platform of capabilities, many of which are easily & quickly adoptable at scale & pace."
"SL1 is a very powerful tool and can monitor pretty much what you want it to, it does take a lot of knowledge to get to know the product and what you can make it do but it is a very good tool to have as a MSP."
"Good Monitoring console. its very useful for monitoring the Server utilisation."
4.4. ScienceLogic Demo
5. LogicMonitor
Businesses can monitor their IT infrastructure, apps, and services in real-time using LogicMonitor, a cloud-based platform for monitoring and analytics. IT operations teams can utilize it to perform network audits to find and fix problems before they have an impact on end users.
The platform gathers data in one central dashboard for simple analysis from a range of sources, including servers, storage devices, networks, and apps. Agent-based and agentless monitoring approaches are combined by LogicMonitor to offer thorough coverage of the whole IT system.
Numerous capabilities are available with LogicMonitor, such as customizable dashboards, automatic reporting, alerts and notifications, predictive analytics, and connectors with well-known third-party applications. Businesses of all sizes use it in a range of sectors, including technology, healthcare, finance, and retail.

5.1. LogicMonitor Positioning
One of the main functionalities of LogicMonitor is network performance monitoring. IT operations teams can swiftly detect and resolve network problems because to its real-time visibility into network performance measures like bandwidth usage, packet loss, latency, and jitter.
To offer thorough network monitoring coverage, LogicMonitor combines agent-based and agentless monitoring techniques. It offers comprehensive insights into network traffic flows and performance and supports a broad range of network devices and technologies, such as firewalls, load balancers, routers, switches, and VPNs.
Network topology mapping is another feature that LogicMonitor offers, which aids IT teams in visualizing their network infrastructure and determining interdependencies among network devices. This can be helpful in capacity and scalability planning as well as debugging network problems.
5.2. LogicMonitor Customer Support
LogicMonitor understands that exceptional customer service is key to optimizing your network performance monitoring. That's why they provide a multi-tiered support system to empower you at every step:
Streamlined Onboarding: A dedicated customer success manager, along with technical support and extensive training resources, ensures you get started with network performance monitoring quickly and efficiently.
24/7 Technical Support: LogicMonitor offers round-the-clock technical assistance via phone, email, or chat. Their team of experts is readily available to troubleshoot any network performance monitoring challenges you may encounter.
Invest in Knowledge: Explore online training courses, informative webinars, and in-depth documentation to equip yourself with the expertise to leverage the platform to its fullest.
Expert Professional Services: This includes assistance with custom integrations, tailored dashboards, and even on-site support to ensure your network monitoring solution perfectly aligns with your specific environment.
LogicMonitor's commitment to exceptional customer service ensures you have the resources and support needed to achieve your network performance monitoring goals with confidence.
5.3. LogicMonitor User Interface


5.4. LogicMonitor User Reviews
"Easy to use, you can add all the devices you want to monitor from the interface, it is also possible to schedule alerts, the installation is easier than I thought, they have an excellent community behind the project there is a lot of documentation on how to make the most of the software."
"Good mechanics of real-time alerts, monitoring options in the cloud are excellent, the software is interpreted in a good way, the configuration for a good use did not bring problems, analysis and reports of the data collected are very complete."
5.4. LogicMonitor Demo
6. Auvik
Providing insight and control over network infrastructure, Auvik is a solution for network monitoring, management and auditing. Its purpose is to make network device management and monitoring, including router, switch, firewall, and server maintenance, easier for managed service providers (MSPs) and IT specialists.
With Auvik's technology, network administrators may quickly detect problems with the network and run automated network maintenance procedures, like firmware updates and configuration backups. Device monitoring, automated network detection, and real-time network mapping are some of the functions it offers for comprehensive network assessments. Together with these comprehensive insights, it offers information on traffic flows, device performance metrics, and bandwidth utilization on networks.

6.1. Auvik Positioning
With real-time network mapping, device monitoring, and bandwidth usage tracking, Auvik offers a complete platform for monitoring network performance. Several salient characteristics of Auvik's network performance monitoring capabilities are as follows:
Real-time network mapping: Every connected device and their connections are displayed on a real-time network map created by Auvik's software. This makes it easier for IT specialists to troubleshoot and detect network faults rapidly.
Device monitoring: Auvik keeps an eye on servers, firewalls, routers, switches, and other network equipment constantly and notifies IT specialists of any problems. This entails keeping an eye on the availability, health, and performance indicators of the device, including CPU, memory, and interface utilization.
Monitoring bandwidth usage: Auvik keeps track of how much bandwidth is being used on a network in real-time, which helps IT specialists find and fix bandwidth-hungry apps that can be the source of network congestion.
Metrics for measuring network performance: Auvik offers comprehensive data on latency, packet loss, and jitter. This aids in the detection and resolution of network performance problems by IT specialists.
All things considered, Auvik's network performance monitoring features are made to make it simple for IT professionals to audit and manage their network infrastructure, as well as to find and fix problems as soon as they appear.
6.3. Auvik Customer Support
To ensure that businesses get the most out of their network management and monitoring platform, Auvik provides a variety of customer services. Auvik provides the following important consumer services, to name a few:
Technical assistance: Auvik offers technical support to assist clients in troubleshooting and expeditiously resolving issues. Their help staff can be reached by phone, email, or chat around the clock.
Onboarding and training: To assist businesses in utilizing the platform as soon as possible, Auvik provides onboarding and training services. This covers ongoing support, training resource access, and customized onboarding sessions.
Account management: Auvik offers its clients specialized account management, with a named account manager acting as a single point of contact for all inquiries and demands from the client.
Community forum: Auvik provides a community forum where members may interact, exchange questions, and discuss the best ways to use the platform.
Features requests: In order to enhance the platform and add new features, Auvik actively seeks input from its users and accepts feature requests.
In general, the goal of Auvik's client services is to give businesses the assistance and tools they need to succeed by maximizing the use of their network monitoring and management platform.
6.3. Auvik User Interface

6.4. Auvik User Reviews
"Really solid network mapping and SNMP monitoring platform. Very easy to implement with lots of out of the box deployment options. Good Visual Mapping of product."
"It's provided me valuable insight into how our network topology looks and functions."
"The overview of the entire network environment has been a game-changer for my role at my company. It provides me insight into my client's settings so I can confidently answer their questions on their network and it is also really useful to have that whole map that generates for the business. While it is not used every day by other people on my team, we do have it integrated into other platforms that can notify us of any potential outages with devices."
6.6. Auvik Demo
7. Icinga
An open-source monitoring program called Icinga is used to keep an eye on network services, apps, and infrastructure. Servers, switches, routers, and apps are just a few of the things it may be used to monitor. It offers real-time monitoring, alerting, and reporting of network resources.
The popular open-source monitoring tool Nagios was the source of inspiration for Icinga. In comparison to Nagios, Icinga has more features and enhancements, such as a more contemporary web interface, more scalability, and enhanced performance.
Among the key features of Icinga are:
- Monitoring hosts, apps, and network services
- System for alerts and notifications that can be customized
- Integration with a number of tools and services from third parties
- A large selection of plugins and addons are supported
- Role-based user management and access control
- Configuration management and deployment that is automated
IT specialists, service providers, and small to large businesses all utilize Icinga to monitor and manage their IT infrastructure as well as perform initial network audits. It can be downloaded for free as an open-source tool supported by the community or purchased as a commercial solution with more features and expert assistance.

7.1. Icinga Positioning
Icinga equips you with a comprehensive network monitoring tool that provides real-time insights into the health of your network infrastructure, services, and applications. Here's what Icinga can monitor to help you perform a network audit:
Host Health: Gain instant visibility into the availability and response times of your hosts, encompassing servers, switches, routers, and any other network device on your network. Additionally, Icinga monitors applications running on these hosts, ensuring their smooth operation.
Network Bandwidth: Identify bottlenecks, congestion, and bandwidth usage trends with Icinga's network bandwidth monitoring capabilities. It can also trigger alerts when usage surpasses predefined thresholds, allowing you to proactively address potential issues.
Network Device Performance: Icinga delves into the performance of your network devices, including switches and routers. This enables you to identify problems related to device utilization, CPU and memory usage, and interface errors before they disrupt your network operations.
Application Performance: Monitor the performance of various applications, including web applications, databases, and even custom applications you rely on. Icinga tracks application response times, database query performance, and other critical application-specific metrics.
Tailored Monitoring: Icinga's flexibility extends to custom performance metrics. Leverage plugins or custom scripts to monitor any performance metric specific to your unique network environment.
Icinga offers a comprehensive library of monitoring plugins and add-ons, empowering you to monitor a wide range of network performance metrics. Furthermore, its customizable alerting and notification features ensure you're promptly informed of any network performance issues, allowing for swift intervention and resolution.
7.2. Icinga Customer Support
Icinga offers a range of customer support services to assist its users, such as:
Support from the community: Icinga boasts a sizable and vibrant user base that uses chat rooms, email lists, and online forums to exchange information, meets, conferences, and advice.
Documentation: To assist customers in getting started with the platform, Icinga offers thorough documentation that includes installation instructions, user manuals, and API documentation.
Expert services: Icinga provides users with expert assistance with deployment, configuration management, and bespoke integrations. These services include of bespoke development, training, and consultation.
Technical help: Icinga provides its customers with expert technical support via phone and email. When it comes to installation, setting, and troubleshooting, the support staff can assist.
7.3. Icinga User Interface


7.4. Icinga User Reviews
"Icinga works great in real-time monitoring and can be easily integrated with other tools (Slack, emails, etc.) for notifications."
"As an open source project, Icinga offers a free, open, and complete solution for most operation monitoring. In particular, Icinga is great for monitoring hosts and alerting on basic metrics."
7.5. Icinga Demo
8. Progress WhatsUpGold
Progress WhatsUpGold is a solution for network monitoring that offers insights and real-time visibility into security, availability, and performance of networks.
It can monitor a variety of network devices, such as servers, switches, routers, and applications, and is intended for auditing networks of small to medium-sized enterprises.
WhatsUp Gold equips you with a feature-rich network management toolkit, empowering you to see and optimize every aspect of your network. Here's what WhatsUp Gold brings to the table:
Automatic Network Discovery and Mapping: WhatsUp Gold automatically discovers and maps your network topology, providing a clear visual representation of your entire network infrastructure. This holistic view empowers informed decision-making and network audits.
Real-Time Network Monitoring: Response time, bandwidth utilization, and device availability are all continuously monitored, and real-time alerts and notifications keep you informed of any emerging issues.
Application Performance Monitoring (APM): WhatsUp Gold monitors various applications, including web applications, databases, and even custom applications you rely on. It tracks application response times, database query performance, and other application-specific metrics, ensuring optimal application health.
Network Security: It monitors for intrusion attempts, malware threats, and vulnerabilities, acting as a vigilant guard against potential security breaches.
Customizable Reporting and Analytics: WhatsUp Gold's customizable reporting and analytics features allow you to generate reports and analyze network performance data, enabling you to identify trends, optimize performance, and make data-driven decisions for your network.

WhatsUp Gold positions itself as a comprehensive network monitoring solution. It empowers businesses to optimize network performance, proactively address security concerns, and minimize downtime, all through a centralized and user-friendly platform.
8.1. Progress WhatsUpGold Positioning
WhatsUp Gold goes beyond basic monitoring – it offers a comprehensive toolkit that sheds light on various aspects of network performance:
Device Performance: Gain real-time insights into the availability and performance of your network devices. This includes servers, switches, routers, and firewalls.
Application Health: Monitor the performance of various applications, encompassing web applications, databases, and even custom applications you rely on. WhatsUp Gold tracks application response times, database query performance, and other critical application-specific metrics, ensuring optimal application functionality.
Bandwidth: Identify bottlenecks, congestion, and bandwidth usage trends with WhatsUp Gold's network bandwidth monitoring capabilities. It can also trigger alerts when usage surpasses predefined thresholds, allowing you to proactively address potential issues.
Network Traffic: WhatsUp Gold's network flow analysis functionality empowers you to understand network traffic patterns. This enables you to monitor application usage and even detect potential security threats lurking within your network traffic.
Cloud Performance: In today's hybrid IT environments, WhatsUp Gold extends its monitoring prowess to the cloud. Monitor cloud resources, including virtual machines, databases, and cloud services, to identify performance issues and ensure optimal cloud performance.
With real-time visibility and in-depth insights delivered by WhatsUp Gold's network performance monitoring tool, businesses can audit their networks to address performance bottlenecks, and ultimately provide a seamless experience for their end-user
8.2. Progress WhatsUpGold Customer Support
Progress WhatsUp Gold provides a multi-layered support program to empower you at every step:
24/7 Technical Support: They offer technical assistance via email, phone, and live chat, ensuring you have a direct line to support whenever you encounter an issue.
Knowledge Base: Progress WhatsUp Gold's comprehensive knowledge base houses user guides, troubleshooting guides, and best practices.
Expert Guidance: Their certified team provides assistance with customized integrations, deployment, and configuration management, ensuring your WhatsUp Gold solution seamlessly integrates into your specific network environment.
Community for Collaboration: Connect with a network of peers who can provide support, share best practices, and offer valuable insights from their own experiences.
Expertise: Elevate your team's knowledge and skills with Progress' training and certification programs. These programs delve into various topics like network monitoring, application monitoring, and network security, empowering your team to leverage WhatsUp Gold to its full potential.
This comprehensive program allows you to choose the level of support that best suits your needs and budget, equipping you to confidently navigate the ever-evolving landscape of network auditing and management.
8.3. Progress WhatsUpGold User Interface


8.4. Progress WhatsUpGold User Reviews
"The monitoring service is very complete with each update is improving without any doubt, the user interface is easy to understand, all options are distributed very well in the upper tabs of the program."
"It has a user-friendly and intuitive interface. It allows users to determine and scan performance from a glance. It has quick and timely alerts that help users identify and fix network problems before end users realize there's an issue."
8.5. Progress WhatsUpGoldDemo
Part 3 of Navigating Network Auditing Tools: The Top 4 Open-Source Network Monitoring and Network Auditing Software
This section reveals the top 4 open-source network monitoring tools renowned for their effectiveness for performing network audits. These tools have gained widespread popularity due to their:
- User-Friendliness: Straightforward interfaces and intuitive functionalities make them accessible for IT teams of all experience levels.
- Affordability: The open-source model eliminates licensing costs, making them a budget-friendly option for organizations of all sizes.
- Flexibility: Open-source tools offer extensive customization options, allowing you to tailor the platform to your specific network monitoring needs.
- Communities: Large communities of developers and users actively contribute to their ongoing development and improvement, ensuring these tools stay at the forefront of network monitoring capabilities.
So, buckle up! We're about to explore these open-source powerhouses and discover how they can help your organization achieve optimal network performance monitoring without sacrificing efficiency or budget.
1. Nagios XI
An enterprise-level solution for network monitoring, Nagios XI offers real-time visibility into services, applications, and network infrastructure. It is a commercial software that adds features and functionalities to the open-source Nagios Core monitoring engine.

Nagios XI offers a range of features:
Network topology and mapping: Nagios XI can automatically discover and map the network topology, providing users with visual depiction of the network architecture.
Real-time network monitoring: When problems are identified, Nagios XI can track and report on network performance indicators such as response time, bandwidth usage, and device availability.
Application performance monitoring (APM): Web apps, databases, and other custom applications can all have their performance monitored by Nagios XI. It may track metrics unique to each application, such as database query performance and application response times.
Network security: Nagios XI is capable of keeping an eye on incursion, malware, and vulnerability screening as well as network security.
Reporting and analytics: Users can create reports and examine network performance statistics with Nagios XI's configurable reporting and analytics features.
All things considered, Nagios XI offers a complete network monitoring solution that enables companies to enhance network security, minimize downtime, and maximize network performance. Businesses, service providers, and IT specialists utilize the platform extensively to audit, monitor and manage their IT infrastructure.
1.1. Nagios XI Positioning
Nagios XI takes the robust foundation of the open-source Nagios Core and supercharges it for enterprise-grade IT monitoring. Designed for comprehensive oversight, it keeps a watchful eye on your entire IT infrastructure, encompassing servers, applications, services, and network devices, which makes it a reliable platform for conducting network audits.
Nagios XI positions itself as the go-to solution for businesses requiring a feature-rich monitoring platform. It boasts customizable dashboards for tailored data visualization, powerful reporting for in-depth analysis, and superior scalability to seamlessly adapt to large and growing IT environments. This flexibility caters to organizations of all sizes and across diverse industries, including government agencies, healthcare providers, educational institutions, and financial services firms.
In the competitive enterprise monitoring landscape, Nagios XI faces rivals like SolarWinds, Zabbix, and PRTG Network Monitor. While it leverages its strong open-source heritage and is recognized for reliability and cost-effectiveness, the commercial licensing model might deter some users who prefer the completely free and open-source nature of Nagios Core. Ultimately, the choice between Nagios XI and Nagios Core boils down to the specific auditing and monitoring needs as well as budget of your organization.
1.2. Nagios XI Customer Support
Nagios understands that maximizing the value of your IT infrastructure monitoring solution relies on exceptional customer support. That's why Nagios XI offers several options to their users:
Email Support: Nagios provides email support, allowing you to submit inquiries anytime and receive a response within one business day.
Phone Support: For standard and enterprise support plans, Nagios offers phone support, putting you in direct contact with their team of experts for immediate assistance with any challenges you encounter.
Enterprise Chat Support: Elevate your support experience with enterprise plan access to chat support. This real-time channel allows you to connect with Nagios experts and resolve issues swiftly.
Streamlined Remote Assistance: Nagios offers remote assistance, enabling their support team to troubleshoot and fix issues directly on your system, minimizing disruption and saving valuable time.
Investment in Your Expertise: Nagios offer training and consulting services to help you unlock the full potential of Nagios XI. This includes customized training programs, on-site consulting, and assistance with integration and configuration, ensuring your Nagios XI solution is tailored to your specific needs.
Nagios XI's commitment to customer support ensures you have the resources and assistance needed to maintain optimal monitoring performance and keep your IT infrastructure running smoothly and efficiently.
1.3. Nagios XI User Interface


1.4. Nagios XI User Reviews
"A good comprehensive monitoring tool for SMBs. I love the simplicity of the tool and one of the key things I like personally is the Eagle Eye view."
"It's relialable, scalable and efficient. Allows a lots of custumization that grant you the possibility to monitor whatever you want."
1.5. Nagios Demo
2. LibreNMS
A free and open-source network monitoring tool called LibreNMS offers extensive monitoring features for networks of all kinds. It is a fork of the Observium project that was started in response to Observium's new, restrictive license. Written in PHP, LibreNMS stores its data in a MySQL database.
Numerous capabilities are available with LibreNMS for network monitoring, such as automatic device and service discovery, tracking of network performance metrics including packet loss and bandwidth consumption, event logging, alerting, and network topology visualization. Multiple network devices and vendor varieties are supported, such as Cisco, Juniper, HP, Dell, and many more.
The simplicity of the setup and use of LibreNMS is one of its main benefits. It is compatible with Linux, macOS, and FreeBSD among other operating systems, and it has an easy-to-use online interface for customization and configuration. In addition, LibreNMS has a thriving user and development community that helps develop the project.
All things considered, LibreNMS is a strong and adaptable network auditing solution with a number of features and advantages for network managers and IT departments. Given that it offers similar features and capabilities to commercial network monitoring systems without breaking the bank, it's a great substitute for quick and easy network assessment.

2.1. LibreNMS Positioning
Numerous features for monitoring network performance are available with LibreNMS, including but not limited to:
Device mapping and discovery: LibreNMS is capable of automatically locating and mapping all of the servers, switches, and routers on your network.
Real-time monitoring: It allows for the real-time tracking of several network performance parameters, including disk, CPU, memory, and network bandwidth usage.
Notifications and alerts: LibreNMS lets you configure personalized notifications and alerts according to pre-established criteria. Alerts can be sent to you by SMS, email, Slack, or other messaging services.
Graphing and reporting: LibreNMS offers comprehensive network performance data graphing and reporting features. Among other things, you can utilize pre-built templates or create custom reports for network availability and device inventory.
Fault management: LibreNMS offers comprehensive logs and event tracking for devices and interfaces, which can assist you in troubleshooting network problems.
Network visualization: LibreNMS allows you to monitor the status of connections and network devices in real time, as well as view your network architecture.
In general, LibreNMS is an effective solution for network auditing that may assist you in troubleshooting, optimizing, and monitoring your network architecture.
2.2. LibreNMS Customer Support
LibreNMS provides assistance via a number of channels. They include an active forum where users may post queries and receive assistance from developers and other users.
For businesses in need of more extensive support, some vendors now provide professional support plans. Access to priority support, help with installation and configuration, and assistance with troubleshooting and issue resolution are all included in these support plans.
The number of devices being monitored and the required degree of support determine how much these support plans cost.
2.3. LibreNMS User Interface


2.4. LibreNMS User Reviews
"What I like about Librenms is that I can add any device ( I have not found one that did not work) to its SNMP puller and get device information very easily. I can also add ssh and telnet information to Librenms to login into the network or server equipment."
"LibreNMS is easy to install and configure since it's an open-source solution to monitor network equipment and servers."
2.5. LibreNMS Demo
3. Zabbix
Zabbix is an open-source tool for network monitoring that tracks and keeps an eye on the availability and performance of servers, devices, apps, and network services. With the help of its centralized monitoring solution, users may gather and examine data from a variety of sources, such as IPMI-enabled servers, JMX apps, and SNMP devices.
Zabbix is an adaptable and configurable alerting system that may send users emails, SMS messages, and instant messages when there are any concerns or problems. In order to assist customers in better understanding their network performance and pinpointing areas for development, it also has a robust reporting engine that can provide personalized reports and visualizations. These reports basically become your network audits reports.
Download and install Zabbix, a free and open-source network monitoring program, on Linux, Windows, and macOS, among other operating systems. For business users who need more help, it also provides paid professional support services, training, and consultancy.

3.1. Zabbix Positioning
Zabbix provides all-inclusive network performance monitoring, encompassing data collecting, alerting, reporting, and real-time monitoring. Network equipment including servers, virtual machines, firewalls, switches, and routers can all be monitored using it. A variety of network protocols, including TCP/IP, SNMP, ICMP, and others, can also be monitored by it.
Zabbix is able to track a variety of network performance parameters, including CPU and memory consumption, disk space usage, latency, packet loss, and bandwidth utilization. Additionally, network services like HTTP, FTP, DNS, and others can be watched over by it. Zabbix offers a range of customized dashboards and reports for network audits that facilitate the visualization and analysis of network performance data by network managers. Zabbix also offers sophisticated alerting capabilities including threshold-based alerts and anomaly detection, which enable proactive monitoring.
3.2. Zabbix Customer Support
Zabbix provides several support options.
First, there is community support, which is available without charge and consists of a knowledge base, user forum, and documentation.
Second, Zabbix provides access to the Zabbix support staff, technical help, and tool upgrades as well as professional support services. The number of monitored devices and the quality of help needed determine how much professional support will cost.
For an extra cost, Zabbix also provides training courses, such as on-site training and online self-paced courses.
For clients who need more specialist help, Zabbix also has a partner network that offers consultation, implementation, and customization services. These services are explicitly agreed in price with the partners.
3.3. Zabbix User Interface


3.4. Zabbix User Reviews
"Zabbix is an effective and high performance monitoring solution, it is flexible and very customizable thanks to its open source nature, with Zabbix we can monitor and track the performance of our network infrastructure and its different devices."
"Zabbix is an excellent network monitoring software that provides us with a centralized solution to monitor multiple elements of our network infrastructure (health and integrity)."
3.5. Zabbix Demo
4. OpenNMS
Network administrators may monitor and manage their network infrastructure with the help of OpenNMS, a free and open-source enterprise-grade network management application. It offers an extensive collection of network management capabilities, such as service assurance, traffic analysis, and fault and performance management.
OpenNMS is appropriate for auditing networks of various sizes and complexity since it supports a broad variety of network protocols and devices. Additionally, it has an effective event and alarm management system that can instantly alert managers to any network problems.
The extensibility of OpenNMS is one of its main characteristics. It is a versatile solution for managing intricate network settings since it is simple to configure and combine with other tools and systems.
The network management platform from OpenNMS is available in two versions: OpenNMS Horizon and OpenNMS Meridian. Even though the two versions have many of the same capabilities, OpenNMS Meridian is intended for use in enterprise settings and comes with sophisticated functionality as well as expert support services, whilst OpenNMS Horizon is an open-source, community-driven version of the platform. The primary distinctions between the two versions are found in their upgrades, functionality, support, and licensing. Network managers can choose the version that best suits the requirements of their company by being aware of these variations.

Features: With a broad range of capabilities for network administration, including fault and performance management, traffic analysis, and service assurance, OpenNMS Horizon is an open-source, community-driven network management platform. Conversely, OpenNMS Meridian, the enterprise edition of OpenNMS, comes with expert support and services in addition to sophisticated capabilities like Sentinel, ALEC, and Flows/Streaming telemetry.
Support: The community is the backbone of OpenNMS Horizon and provides both maintenance and support. OpenNMS Meridian, on the other hand, offers expert support services, such as installation guidance and quicker SLA response times.
License: OpenNMS Horizon is freely downloadable, usable, and customizable under the terms of the GPLv3. To access enterprise features and support, OpenNMS Meridian requires a subscription and is accessible under a commercial license.
Updates: The OpenNMS website offers the most recent version of OpenNMS Horizon, which is updated on a regular basis. Regular updates and upgrades are provided by OpenNMS Meridian, along with expert support services to help with setup and maintenance.
All things considered, OpenNMS Meridian is intended for enterprise environments and has advanced features to support efficient network auditing. Whereas OpenNMS Horizon offers a comprehensive feature set and is appropriate for many network management needs.
4.1. OpenNMS Positioning
Network performance monitoring is one of the main functions of OpenNMS. It offers several kinds of network performance tracking, such as:
Resource Utilization Monitoring: OpenNMS has the ability to track in real-time the CPU, memory, disk, and network usage of interfaces and devices.
Latency Monitoring: Device and application response times as well as network latency can be tracked by OpenNMS.
Monitoring of Bandwidth: Throughput, traffic volume, and packet loss can all be tracked using OpenNMS.
Service Monitoring: HTTP, DNS, SMTP, FTP, and other network services and applications can all have their availability and performance tracked by OpenNMS.
Flow Monitoring: Network traffic flows, including source and destination IP addresses, protocols, and ports, can be observed using OpenNMS's flow monitoring feature.
Threshold Monitoring: When predetermined thresholds are exceeded, OpenNMS may keep an eye on network devices and interfaces and send out alerts.
All things considered, OpenNMS offers a full range of network performance monitoring features that support network managers in locating and resolving network problems instantly.
4.2. OpenNMS Customer Support
In order to better serve its business clients, OpenNMS Meridian provides a variety of customer services, such as expert support, installation guidance, and quicker SLA response times. Additionally, OpenNMS Meridian has advanced functionality not found in OpenNMS Horizon, such as Sentinel, Flows/Streaming telemetry, and ALEC.
It's crucial to remember that OpenNMS Horizon offers less functions than OpenNMS Meridian and is free of charge. Enterprise customers may need more extensive support and services that are only available through OpenNMS Meridian subscriptions, even though OpenNMS Horizon has a robust user and contributor community.
4.3. OpenNMS User Interface


4.4. OpenNMS User Reviews
"It's very easy to configure. Onboarding a server is pretty much easy. Just give IP address/Hostname and provision. That's it."
"The usage of powerful SNMP protocol, often no so appreciated, gives an amazing way to monitor and collecting data and alerts from different kind of devices. ONMS helps enterprise architecture to have all in control."
Part 4 of Navigating Network Auditing Tools: Application Performance Monitoring with Network Performance and Auditing Tools
These comprehensive platforms have a robust arsenal of features designed to monitor, troubleshoot, and optimize performance across all layers, encompassing infrastructure, applications, and even cloud-native architectures and microservices.
While they do offer network performance monitoring (NPM) capabilities, their core mission lies in empowering network administrators with in-depth insights into application performance.
This section dives into the top 6 application performance monitoring (APM) tools that double as all-in-one platforms. These tools have gained recognition for their exceptional ability to deliver granular insights into both application and network performance, making them invaluable assets for any organization's network auditing strategy.
1. Datadog
Datadog stands out as a comprehensive cloud monitoring and analytics platform, offering valuable insights into application, infrastructure, and log performance. It's important to acknowledge the broad functionality of this feature-rich suite for performing a comprehensive network audit.
Datadog empowers businesses to monitor their entire cloud infrastructure, encompassing servers, databases, and containers. This holistic view allows for proactive identification of performance bottlenecks and facilitates performance optimization across your network.
The platform boasts seamless integration with over 450 technologies, and its customizable dashboards, alerts, and visualizations provide clear and actionable insights gleaned from your network data. Furthermore, Datadog goes beyond basic monitoring – it offers additional features such as security monitoring, application performance monitoring (APM), and log management, creating a one-stop shop for managing your cloud environments.
Trusted by companies of all sizes, from startups to industry giants, Datadog caters to diverse industries like finance, healthcare, and e-commerce. This widespread adoption is a testament to its ability to deliver exceptional value across a multitude of use cases.

1.1. Datadog Positioning
Datadog offers a feature called Network Performance Monitoring (NPM) that gives users real-time visibility into the functionality and condition of their network infrastructure. Businesses can monitor the functionality of their switches, routers, and firewalls as well as identify potential problems that could affect network performance by using NPM.
The feature gives businesses a thorough understanding of their network environment and enables them to spot potential bottlenecks or vulnerabilities. It includes tools for network mapping, traffic analysis, and network flow analysis.
Moreover, Datadog's NPM offers tools for network maintenance and troubleshooting, such as packet capture and root cause analysis, to assist companies in minimizing downtime and resolving problems promptly.
Businesses can fully assess every aspect of their cloud infrastructure, from apps to network performance, and optimize performance throughout by utilizing NPM within the Datadog platform.
1.2. Datadog Customer Support
To ensure that their clients get the most out of their cloud monitoring and analytics platform, Datadog provides a variety of support options. Professional services, training and certification courses, and technical support are some of these offerings.
All Datadog customers have access to a team of technical professionals for assistance with installation, configuration, and troubleshooting problems. To suit their demands, customers can select from a variety of support options, such as Standard, Pro, and Enterprise support.
In order to help clients maximize their use of the platform and increase their proficiency in cloud monitoring, Datadog also provides training and certification programs. These programs consist of certification tests, live instructor-led instruction, and on-demand courses.
Datadog provides professional services like consulting, implementation, and optimization services for companies that require extra help with their Datadog deployments. These services are intended to maximize return on investment and assist businesses in quickly implementing cloud monitoring solutions.
1.3. Datadog User Interface


1.4. Datadog User Reviews
"It is ideal for monitoring cloud products and can be used not only for monitoring the life and death of common servers and networks but also for monitoring serverless services (PaaS)."
"The best part of Datadog is how it evolves so quickly. Every week you seem to find an improvement and a new feature on the UI. They are doing a really good job on adding more features around security, which are updated regularly."
"Datadog has a comprehensive and user-friendly interface that simplifies daily use in monitoring and analytics. There is no need to write code to set up and configure the service in the organization."
1.5. Datadog Demo
2. AppDynamics
Cisco's network monitoring platform incorporates two powerful solutions: AppDynamics and ThousandEyes. While functionalities might shift in the future, both currently play crucial roles.
AppDynamics is a software company renowned for its application performance management (APM) and IT operations analytics solutions. Their platform empowers organizations to monitor and optimize applications, infrastructure, and user experience in real-time. This translates to unparalleled visibility into the performance and behavior of applications and services across various platforms, including cloud, on-premises, and mobile environments.
AppDynamics equips users with the ability to monitor web applications, databases, servers, and other critical IT components. These insights into application behavior enable proactive identification of potential issues, facilitating swift diagnosis and resolution to minimize disruptions.
Beyond core monitoring, AppDynamics offers advanced features like transaction tracing, code-level visibility, anomaly detection, and machine learning-based analytics. These empower organizations to not only understand the impact of application performance on end-users but also optimize resource allocation, reduce downtime, and ultimately elevate the overall user experience. All these functionalities provide network admins with tools necessary to audit their network with maximum visibility.
2.1. AppDynamics Positioning
Leading application performance monitoring (APM) tool provider AppDynamics recently announced that ThousandEyes, a solution for network performance monitoring, will be integrated into their platform.
With more companies shifting their operations to the cloud, there is an increasing need for thorough visibility into application and network performance, which is why this choice was made.
AppDynamics users will be able to see a more comprehensive picture of their IT environment using ThousandEyes, which includes real-time insights into network behavior and any problems.
This change is anticipated to strengthen AppDynamics' capacity to offer comprehensive end-to-end visibility into network and application performance, ultimately assisting companies in raising the dependability and performance of their digital offerings.
2.2. AppDynamics Customer Support
AppDynamics understands that maximizing the value of your application performance management (APM) solution hinges on comprehensive customer support. That's why they offer a multi-layered support program to empower you at every step:
Technical Support: All AppDynamics customers receive access to a team of dedicated experts ready to assist with installation, configuration, and troubleshooting challenges you might encounter. Flexible support plans allow you to choose the level of assistance that best suits your needs, ranging from standard to premium and elite options.
Investing in Your Expertise: AppDynamics fosters a culture of learning through its training and certification programs. These programs encompass on-demand courses, live instructor-led training, and certification exams, equipping you with the knowledge and skills to optimize your AppDynamics platform utilization.
Professional Services: For organizations seeking additional guidance, AppDynamics offers professional services. These services include consulting, implementation, and optimization assistance. This ensures you get up and running swiftly with your APM solution and extract maximum value from your investment.
AppDynamics' commitment to exceptional customer service ensures you have the resources and support needed to embark on a successful APM journey, fostering optimal application performance and a superior user experience.
2.3. AppDynamics User Interface

2.4. AppDynamics User Reviews
"We have found root cause analysis and code inspection very helpful and detailed.Web based and national customer support are very responsive, efficient and highly competent."
"The transaction snapshots are what I like the most because it helps us narrow down where we should be looking for issues, especially when it's an adjacent application or service."
"One UI for all the components - APM, Analytics and EUM.SaaS offering takes the burden off having to host your own Controller."
2.5. AppDynamics Demo
3. Dynatrace
Dynatrace stands out as a comprehensive application performance management (APM) solution offering a powerful suite of tools. While our focus here is specifically on its network auditing capabilities, it's important to acknowledge the broader functionality of this feature-rich platform which allows for comprehensive network assessment.
Dynatrace empowers businesses with end-to-end visibility encompassing application performance, cloud infrastructure, and network health. This holistic view allows for proactive identification and resolution of performance issues before they disrupt the end-user experience.
Leveraging advanced analytics and artificial intelligence, Dynatrace automates anomaly detection and root cause analysis. This translates to streamlined troubleshooting, reduced time spent resolving network issues, and ultimately, enhanced overall application performance.
Trusted by businesses of all sizes across diverse industries, Dynatrace empowers organizations to deliver exceptional digital experiences for both customers and employees. This focus on user experience underscores the value proposition of Dynatrace, making it a compelling choice for organizations seeking to optimize their network performance as part of a broader digital experience strategy.

3.1. Dynatrace Positioning
With a comprehensive tool intelligence platform that extends beyond network performance monitoring to offer end-to-end visibility into the entire application stack, from the front-end user experience to the back-end infrastructure, Dynatrace is positioned as a major player in the digital experience management market.
The platform from Dynatrace uses automation and artificial intelligence to deliver real-time insights on user behaviour, application performance, and business impact. It can detect and resolve performance problems in intricate multi-cloud setups and offers teams useful information to perform network audits in such environments and plan for future development procedures.
3.2. Dynatrace Customer Support
Customers can access a variety of resources and support services through Dynatrace ONE, the company's all-inclusive support program, which helps them get the most out of their Dynatrace investment.
Customers that use Dynatrace ONE can get in touch with a team of technical support specialists for assistance with any technical problems or issues, as well as a dedicated customer success manager (CSM) who acts as their main point of contact for support and direction.
Dedicated Customer Success Manager: Dynatrace ONE assigns you a dedicated customer success manager (CSM) who acts as your trusted advisor. This CSM serves as your primary point of contact for support and guidance, ensuring you have a single point of reference for all your Dynatrace needs.
24/7 Technical Expertise: Rest assured, technical support specialists are available around the clock to address any issues or answer questions that may arise.
Proactive Problem Prevention: Dynatrace's AI-powered platform goes beyond reactive support. It proactively monitors your environment, identifying potential issues before they escalate into critical problems.
Tailored Guidance and Training: They provide customized guidance and training tailored to your specific use case. This ensures you leverage Dynatrace to its full potential and extract maximum value from your investment.
Community and Knowledge Hub: Dynatrace fosters a vibrant user community where you can connect with peers and share best practices. Additionally, a comprehensive knowledge base offers a wealth of resources, including documentation, best practices, and tips to empower you on your Dynatrace journey.
Dynatrace ONE goes beyond basic support – it's a strategic partnership designed to ensure your success with Dynatrace. While pricing information suggests a starting point of $13,000 USD per year for the Standard package, it's important to note that pricing may vary depending on your specific needs and usage. To determine the optimal support plan for your organization, contact Dynatrace directly.
3.3. Dynatrace User Interface


3.4. Dynatrace User Reviews
"What I like most about Dynatrace is that it provides live alerts and synthetic monitoring of online or cloud-based applications with proper, real-time tracking and monitoring that has strong predictive analytics on the data."
"I love the ability to have real-time alerts and synthetic monitoring of online or cloud-based applications, as well as proper tracking and monitoring."
"Dynatraces support services such as Business Insights and Dynatrace One are exceptional. They help you analyze your application data, are responsive when you need their expertise, and proactive in offering suggestions on how to best use Dynatrace features."
3.5. Dynatrace Demo
4. Splunk
A software platform called Splunk is used for real-time machine-generated data searching, analysis, and visualization. It is employed in the observation, diagnosis, and troubleshooting of extensive IT activities, security incidents, and company operations. Splunk gathers information from a variety of sources, including network devices, servers, apps, and sensors, and offers a single platform for indexing, searching, and correlating this information. All that makes it a reliable tool for auditing IT networks.
Application monitoring, log analysis, security information and event management (SIEM), fraud detection, and business analytics are just a few of the many use cases that Splunk may be put to. Users can rapidly spot patterns, trends, and abnormalities in their data because of its robust search and visualization features, which empower them to make more informed decisions.

4.1. Splunk Positioning
Splunk offers a tool called Splunk NPM (Network Performance Monitor) that helps businesses keep an eye on and control the functionality of their network infrastructure. It offers a full suite of capabilities, including intelligent alerts, deep network analytics, and real-time network visibility, for keeping an eye on network performance.
With Splunk NPM, network admins can keep an eye on important performance indicators, including response times, throughput, packet loss, and network latency. Moreover, it offers comprehensive dashboards and network topology maps, which enable administrators to troubleshoot network issues and immediately discover performance concerns.
A number of more sophisticated capabilities are also included with Splunk NPM, including adaptable network baselines, automatic network device identification and classification, and integration with additional Splunk applications and solutions. Additionally, it has artificial intelligence and machine learning features to assist find trends and abnormalities in network traffic and enhance network efficiency.
All things considered, Splunk NPM offers a thorough tool for network performance monitoring and auditing that may assist businesses in maximizing the functionality and availability of their network infrastructure.
4.2. Splunk Customer Support
To assist its clients, Splunk provides several customer services, such as:
Technical Support: To assist clients in resolving problems and streamlining their Splunk setup, Splunk offers technical support. This provides direct access to Splunk support engineers as well as a knowledge base, product documentation, and online forums.
Professional Services: To assist clients with deployment planning, architectural design, and implementation, Splunk provides professional services. The professional services team at Splunk comprises seasoned consultants who may offer tailored solutions to satisfy certain client requirements.
Training and Certification: To assist clients in becoming proficient Splunk users, Splunk provides a variety of training and certification courses. These programs feature certification tests to verify knowledge and abilities in addition to instructor-led and online instruction.
Community Support: Splunk boasts a sizable and vibrant user and contributor community that is available via user groups, online forums, and other channels to offer help and guidance.
All things considered, Splunk offers a variety of customer services to assist its clients in making the most of their Splunk deployment and guaranteeing the peak operation of their vital IT infrastructure.
4.3. Splunk User Interface


4.4. Splunk User Reviews
"Splunk Enterprise is a great solution for the organization collecting data from different services and can be used to do a lots of tasks like searching,visualizing and analyzing data."
"Splunk provides great features for log aggregator, searching , you can monitor things like your infrastructure, can create different dash boards for your infra, application and many more!"
4.5. Splunk Demo
5. New Relic
A cloud-based network observability tool called New Relic offers real-time insights on the functionality and condition of computer networks. With real-time monitoring of apps, infrastructure, and customer experiences, it gives businesses the ability to audit their networks, take immediate action and optimize customer experiences.
Application performance monitoring (APM), serverless monitoring, infrastructure monitoring, browser monitoring, mobile monitoring, and synthetic monitoring are just a few of the observability solutions that New Relic provides. These instruments offer instantaneous insight into the functionality and well-being of apps, infrastructure, and consumer experiences.
Moreover, New Relic offers a range of analytics capabilities, such as event, metric, and trace data, that help businesses understand how their systems and apps behave. Issues may be found, performance can be optimized, and overall customer satisfaction can be raised with the help of this data.
All things considered, New Relic offers a thorough observability and auditing platform that aids businesses in pro-actively tracking, diagnosing, and improving the functionality of their digital systems.

5.1. New Relic Positioning
Network performance monitoring is provided by New Relic as a feature of its observability platform. It has partner with Kentik to give clients a way to examine all of their data in one location and understand the interplay between network and system performance. Together they create a solid platform for comprehensive network audits.
Customers can identify performance problems faster and target troubleshooting efforts at the appropriate layer with the appropriate team when they use this tool. As a result, problems are identified more quickly and the Mean Time to Resolution (MTTR) is decreased.
5.2. New Relic Customer Support
Customer success services, self-service resources, technical help, and online community support are just a few of the support options that New Relic provides to its clients.
Clients can interact with other users and discover answers to frequently asked questions by using user groups, forums, and an extensive knowledge base.
Customers who require further help with the installation of New Relic can access varying degrees of technical support, dependent on their specific requirements.
Last but not least, customer success services provide tailored assistance and direction to help clients use New Relic to accomplish their business objectives.
5.3. New Relic User Interface


5.4. New Relic User Reviews
"It is super useful for engineering needs as it provides end-to-end visibility of the system overall. You can monitor performance, use it to troubleshoot and diagnose any problems, and it does well with alerts and notifications when something is starting to fail."
"New Relic is a must have infrastructure monitoring tool that offers an unparalleled level of detail for businesses. With New Relic, users can dive deep into their infrastructure and applications, gaining valuable insights and fine-grained control."
5.5. New Relic Network Performance Monitoring Demo
6. Elastic Observability
Elastic Observability is a set of techniques and tools for tracking, troubleshooting, and improving the functionality of complex applications and systems. It is based on the Elastic Stack and has a number of parts that offer profound insights into how systems and apps behave.
The components of Elastic Observability are as follows:
- Elastic APM (Application Performance Monitoring): This tool gathers and analyzes information about transaction traces, errors, and other important metrics to assist in keeping an eye on the functionality of applications and services.
- Elastic Logs: With the help of this tool, users can solve problems and learn more about the behaviour of the system by gathering, centralizing, and analyzing log data from several sources.
- Elastic Metrics: This program gathers and displays metrics information from a number of sources, including servers, software, and infrastructure elements.
- Elastic Uptime: This program keeps track of how responsive and available websites, APIs, and other network services are.
When combined, these technologies offer a thorough audit of system activity, enabling users to spot anomalies, solve problems, and maximize performance. Numerous sectors, including IT, banking, healthcare, and more, use Elastic Observability.

6.1. Elastic Observability Positioning
Elastic offers a service called Elastic Observability, which gives users extensive monitoring and analytical power over a range of system or application performance metrics.
Elastic Observability's Application Performance Monitoring, or APM, is one of its main characteristics. Developers and IT operations teams can use it to swiftly identify problems and troubleshoot apps by monitoring their performance in real-time. This includes tracking requests across different components, detecting faults, keeping an eye on the functionality of each application component, and examining application performance metrics.
Another Elastic Observability feature called "synthetic monitoring" allows teams to mimic user interactions with a website or application to track its performance. Synthetic monitoring can assist teams in spotting problems before they affect actual users and guarantee that vital business processes are operating as intended.
Teams may keep an eye on how users are interacting with a website or application by utilizing the User Experience Monitoring (UEM) capability. This includes monitoring user activity, spotting mistakes, and gauging contentment. Teams may improve the user experience by using UEM to better understand how users interact with their applications.
Elastic Observability provides network performance monitoring options in addition to APM, synthetic monitoring, and UEM. This entails keeping an eye on network traffic, spotting problems with network performance, and acting swiftly to resolve them. All that makes it a reliable tool for auditing your network and finding areas for optimization.
6.2. Elastic Observability Customer Support
Elastic provides its users with customer service. Elastic offers assistance via several channels, such as phone, email, and online forums. Users can get help from Elastic's support staff with technical problems, product-related inquiries, and troubleshooting. To assist customers in getting started and learning how to utilize Elastic's products efficiently, the company also offers documentation, training, and other tools.
Elastic provides Standard, Gold, Platinum, and Enterprise tiers of service, among others. The degree of support accessibility, response times, and the quantity of user-accessible support contacts vary throughout these tiers of assistance. Customers can select the support level that best suits their needs.
Elastic also provides expert services to assist users with tasks like customization, optimization, and installation. These services are intended to address the unique business demands of users and assist them in getting the most out of Elastic's products.
All things considered, Elastic is dedicated to giving its customers excellent customer care and support, and it offers a number of tools to enable customers to maximize the usage of its products.
6.3. Elastic Observability User Interface


6.4. Elastic Observability User Reviews
"User-Friendly Interface - It has a very intuitive and user-friendly interface that allows both professionals and novice users to quickly get started with monitoring and analyzing their applications and infrastructure."
"Dashboards and visualization feature in Kibana is really great. There are tons of ways you can visualize and analyse your data."
6.5. Elastic Observability Demo
Part 5 of Navigating Network Auditing Tools: The Top 6 Packet Capture-Based Network Monitoring and Network Auditing Software
For IT security, packet capture-based technologies stand as vigilant guardians. These powerful solutions delve into the very core of network traffic, meticulously capturing and analyzing each data packet. This granular analysis yields invaluable insights into network activity, empowering you to proactively identify and prevent potential security threats.
However, it's important to acknowledge that wielding these powerful tools requires specialized expertise for data analysis and significant hardware resources for storage. This complexity might limit accessibility and scalability for some organizations.
Despite these considerations, packet capture-based technologies remain a valuable asset for many organizations wanting to audit their networks, especially the cybersecurity aspect of it. This section dives into the top 6 solutions renowned for their ability to deliver high-level IT security network monitoring.
1. Ixia/Keysight Network Performance Monitoring Tool
A leading technology provider of electronic design and test solutions, Keysight Technologies, offers Keysight Network Monitoring (Hawkeye, formerly IX Chariot). IT teams can track and diagnose network performance problems in real-time with Keysight Network Monitoring, a software-based network monitoring solution.
Several functions are available with Keysight Network Monitoring, such as packet capture and analysis, network performance monitoring, application performance monitoring, and network traffic analysis. IT teams may swiftly audit their networks, troubleshoot problems, and monitor the operation of their networks & applications.
From packet-level analysis to application-level analysis, the system can monitor network traffic at different granularities. It can reveal information on network usage, response times, and user behaviour, in addition to identifying security risks and performance problems.
With the capacity to monitor networks of all sizes, from tiny local networks to massive dispersed networks, Keysight Network Monitoring is made to be both adaptable and scalable. It works with a variety of network devices and protocols and may be installed in virtual, cloud, and physical settings.
With the ability to monitor and optimize network performance, enhance application performance, and guarantee network security, Keysight Network Monitoring is an all-around effective network auditing solution for IT teams.

1.1. Ixia/Keysight Positioning
Keysight Technologies strategically targets Fortune 100 companies and federal organizations, catering to their unique and demanding network monitoring needs.
Focusing on the Power Players:
Fortune 100 Enterprises: These industry titans often manage intricate IT infrastructures and networks. Keysight steps in with sophisticated monitoring and analysis tools, like Keysight Network Monitoring, empowering them to optimize network performance and streamline business operations.
Federal Agencies: Similar complexities exist within federal organizations, where robust IT infrastructure and networks necessitate strict security and compliance adherence. Keysight's solutions address these concerns, enabling federal agencies to monitor for security threats and ensure regulatory compliance.
This targeted approach allows Keysight to concentrate on high-value clients with substantial budgets and intricate network monitoring requirements.
One of Keysight's offerings, Keysight Hawkeye, is a network performance monitoring and analytics solution designed to empower IT teams with real-time troubleshooting capabilities.
End-to-End Visibility: Hawkeye provides a comprehensive view of network performance, encompassing users, applications, and the network itself. This holistic perspective empowers the proactive identification and resolution of network issues.
Actionable Insights: Leveraging advanced analytics and machine learning, Hawkeye pinpoints performance bottlenecks and anomalies. These actionable insights empower IT teams to swiftly diagnose and rectify network problems.
Active Monitoring: A core strength of Hawkeye lies in its ability to actively monitor network and application performance. This translates to real-time monitoring of user transactions, application and service performance, and even network infrastructure components like routers, switches, and firewalls, ensuring a comprehensive approach to network health.
Advanced Analytics: Hawkeye offers advanced analytics capabilities such as correlation analysis and anomaly detection. These empower IT teams to unearth patterns and trends within network and application performance data, ultimately revealing the root causes of performance issues.
In conclusion, Keysight Hawkeye stands out as a powerful network performance monitoring and auditing solution. By equipping IT teams with the ability to swiftly identify and troubleshoot performance issues, Hawkeye paves the way for optimized networks, enhanced application performance, and a superior user experience.
1.2. Ixia/Keysight Customer Support
Keysight Technologies provides its users with various alternatives for customer care and support. Among them are:
Technical help: Keysight offers its users phone, email, and online chat support in addition to other channels. Users can get assistance from Keysight's technical support team with inquiries about its products, problems with technology, and troubleshooting.
Online resources: To assist customers in getting started with and learning how to use its products efficiently, Keysight provides a variety of online resources. These consist of user guides, product manuals, instructional videos, and community discussion boards where users can exchange information and pose queries.
Training: To assist users in gaining the abilities and information required to utilize Keysight products efficiently, the company offers training courses and programs. These online or in-person training sessions cover a variety of subjects linked to Keysight's solutions and products.
Professional services: To assist users with activities like implementation, optimization, and customization, Keysight also provides professional services. These services are intended to satisfy the unique business demands of users and help them get the most out of Keysight's solutions.
Keysight is dedicated to giving its users the best possible assistance and customer care. Keysight's customer care programs are developed to ensure customers can utilize its products to their full potential and accomplish their business goals.
1.3. Ixia/Keysight User Interface

1.4. Ixia/Keysight User Reviews
"It gives you all details on one single page. Saves a lot of time does all the work for you when it comes to analytics."
"Ixia has plenty of features that we can use to test network equipment. Supporting almost all the protocol traffic is a great thing."
1.5. Ixia/Keysight Demo
2. Viavi Observer Solutions
Viavi Solutions is a global supplier of network test, monitoring, and assurance solutions for avionics manufacturers, government and military organizations, businesses, and network equipment makers.
The company's solutions assist clients in assessing, maintaining, and improving the security, quality, and performance of their networks. Products for fibre and cable testing, mobile network testing, cloud and data centre testing, network monitoring and assurance, and other applications are available in Viavi's portfolio.

2.1. Viavi Observer Positioning
Network operators and businesses can monitor and troubleshoot their networks in real-time with the help of Viavi Solutions' array of network monitoring solutions. These solutions give businesses complete visibility into security, user experience, and network performance. They also assist businesses in identifying and resolving network problems before they negatively affect users. Viavi Solutions provides a number of network monitoring options, some of which are:
Observer Platform: An all-inclusive solution for network performance management that offers visibility into user, application, and network performance by combining flow-based, packet-based, and agentless monitoring technologies.
NITRO Mobile: Real-time visibility into the radio access network, core network, and service delivery platforms is offered by this network monitoring solution for mobile service providers.
DPI for Security: A deep packet inspection (DPI) technology that helps businesses and network operators identify and stop security risks in real-time, such as ransomware and malware.
UC&C Monitoring: A solution that offers end-to-end visibility into voice and video quality, network performance, and user experience for unified communications and collaboration (UC&C) applications.
Service assurance is a technology that helps businesses guarantee service delivery and maximize efficiency by providing real-time analytics and monitoring for cloud-based and hybrid IT environments.
All things considered, Viavi Solutions' network monitoring solutions offer vital security features to guard against cyberattacks, in addition to helping enterprises audit network performance, decrease downtime, and improve the user experience.
2.2. Viavi Solutions Customer Support
Viavi Solutions provides a variety of customer service options to help its clients use and take care of its products and services. Among these options are:
Technical Support: To assist clients in resolving problems with their products and solutions, Viavi Solutions offers technical support services. This includes having access to software updates and upgrades, a global staff of technical specialists, and online resources like knowledge bases and forums.
Training and Education: To ensure that clients get the most out of their products and solutions, Viavi Solutions provides training and educational services. This covers online courses, certification schemes, and instructor-led training.
Expert Services: Viavi Solutions assists clients with the design, implementation, and optimization of their network infrastructure by offering expert services. Project management services, network evaluations, and consulting are all included in this.
Customer Service: If a customer has any questions about billing, order tracking, or other non-technical matters, they can get help from Viavi Solutions' customer service staff.
Community and User Groups: Viavi Solutions organizes online communities and user groups so that users may interact, exchange ideas and information, and discuss best practices.
In summary, Viavi Solutions is dedicated to giving its clients excellent customer care and assistance so they may be successful with their network testing, monitoring, and assurance projects.
2.3. Viavi Solutions User Interface


2.4. Viavi Solutions User Reviews
"The solution performed as advertised and the account and support teams have done an excellent job making sure we get value from the product."
"The product works extremely well on diagnosing the network traffic and the support team is very knowledgeable with it."
2.5. Viavi Solutions Demo
3. Gigamon
A leading supplier of analytics and network visibility solutions, Gigamon assists enterprises in enhancing their network security, monitoring, and performance. Customers get many insights when auditing networks with these tools, which helps to take immediate action on network problems with visibility into network traffic.
Gigamon offers a variety of hardware and software solutions, such as the following:
Network TAPs: For the purposes of compliance, security, and monitoring, Gigamon provides a range of network TAPs that let enterprises record and examine network data.
Network Packet Brokers: Gigamon's network packet brokers give enterprises a single point of control over all network traffic, enhancing both security and performance.
Visibility Fabric: A software-defined platform from Gigamon, Visibility Fabric offers a scalable and adaptable architecture for network analytics and visibility.
Application Intelligence: By monitoring and analyzing application traffic, businesses may enhance user experience, guarantee application performance, and maintain application availability with the aid of Gigamon's application intelligence solutions.
Cloud & Virtualization: By offering visibility and analytics for cloud-based and virtualized systems, Gigamon's cloud and virtualization solutions help enterprises preserve network performance, security, and compliance in these settings.
With offices all throughout the world, Gigamon's corporate headquarters are in Santa Clara, California. The business provides services to a number of sectors, including as government, healthcare, financial services, and telecommunications.

3.1. Gigamon Positioning
With the help of Gigamon's array of network monitoring tools, enterprises can examine network behaviour, see what's happening on their network, and identify and address security risks. Gigamon provides a number of network monitoring options, some of which are:
Network TAPs: Businesses can record and examine network traffic in real time using Gigamon's network TAPs. They can now see how the network behaves, keep an eye on its performance, and fix problems thanks to this.
Network Packet Brokers: Gigamon's network packet brokers give enterprises a single point of management of overall network traffic, enhancing security, cutting expenses, and improving network performance.
Traffic Intelligence: Network traffic analysis and insights into application usage, user behaviour, and network performance are made possible for enterprises by Gigamon's traffic intelligence solutions. This aids in the detection and resolution of network problems, boosts application efficiency, and improves user satisfaction.
Threat Detection: By offering real-time visibility into network activity, Gigamon's threat detection solutions help enterprises identify and counter security risks like malware, ransomware, and other cyberattacks.
Cloud & Virtualization: By offering visibility and analytics for cloud-based and virtualized systems, Gigamon's cloud and virtualization solutions help enterprises preserve network performance, security, and compliance in these settings.
All things considered, Gigamon's network monitoring solutions are made to assist businesses in auditing and strengthening their security posture, streamlining network traffic, and enhancing network performance.
3.2. Gigamon Customer Services
From basic to elite assistance levels, Gigamon provides its customers with a range of technical help services. The lowest tier of support, known as Basic Product Support and Software Maintenance, offers defect isolation, help with configuration, and other "how to" inquiries in addition to a 9x5 response during client business hours. This level also covers repair or return to the factory for verified hardware issues, as well as full access to the most recent software version updates via the VÜE Community website.
The Gigamon products installed outside of business-critical customer environments that require improved hardware replacement or reduced spare stock objectives are best suited for the Enhanced Product Support and Software Maintenance level, which includes advanced hardware replacement for confirmed hardware defects.
For Gigamon products implemented in mission-critical customer business environments, the Elite Product Support and Software Maintenance level is the most appropriate option as it offers round-the-clock reaction to customer issues. This level offers "anytime access" to subject matter experts and technical support staff with shorter response times.
In addition, Gigamon provides hardware replacement services, such as Advance Hardware Replacement (AHR) for hardware problems that have been verified. Depending on the local time of the return material authorization (RMA) completion, AHR offers shipping options that can be shipped either the same day or the next working day. Worldwide access to expedited hardware returns through specific regional depots is also provided.
Gigamon's technical support services are made to assist clients in maintaining their network infrastructure and swiftly resolving technical issues with their products. A number of advantages are provided by the programs, including as complete access to the most recent software version updates through the VÜE Community website and round-the-clock access to technical support specialists and subject matter experts.
3.3. Gigamon User Interface


3.4. Gigamon User Reviews
"It is a best NDR solution for empowering security team to detect and respond to threats. Gives complete report of compromised devices and that too priority wise."
"I like is their real time threat detection , user friendly interface and cost effectiveness."
3.5. Gigamon Demo
4. Netscout nGeniusOne
An analytics and network performance management tool called Netscout GeniusOne offers complete end-to-end visibility over network traffic, apps, and services. It is intended to assist IT teams in proactively managing and improving the performance of their networks, decreasing downtime, and swiftly troubleshooting and resolving network problems. With these tools at hand, network admins can perform comprehensive network audits to optimize network infrastructure.
The nGeniusOne platform analyzes network data and provides insights into network behaviour, application usage, and end-user experience using machine learning algorithms and advanced analytics. It gathers and compiles information from various sources, such as cloud environments, physical and virtual networks, and outside monitoring tools.
IT departments can optimize network resources, detect and fix problems more quickly, and monitor network performance in real-time using nGeniusOne. The platform offers several functions and features, such as:
End-to-end visibility: IT teams can swiftly detect and resolve problems thanks to nGeniusOne's end-to-end insight into network traffic, apps, and services.
Advanced analytics: The platform analyzes network traffic and provides insights into network activity, application usage, and end-user experience through the use of machine learning algorithms and advanced analytics.
Real-time monitoring: Real-time network performance monitoring is made possible by nGeniusOne, which enables IT staff to promptly spot and fix problems before they have an influence on users.
Collaboration and data sharing: The platform makes it possible for IT teams to work together and exchange data between departments and teams, which speeds up the process of solving problems.
Scalability: nGeniusOne offers a single view of network performance throughout the company and is extremely scalable, allowing it to be implemented in vast and complicated network infrastructures.
All things considered, Netscout nGeniusOne is a complete platform for network performance auditing and analytics that gives IT teams the resources they need to efficiently troubleshoot and fix network problems, minimize downtime, and proactively manage and optimize their network performance.

4.1. Netscout nGeniusOne Positioning
Leading supplier of communication service provider (CSP) solutions, Netscout offers a selection of tools and technologies created especially to meet the requirements of telecom service providers. The company's collaborations with significant global CSPs and efforts with industry standards organizations to create and disseminate best practices for network performance management and optimization serve as evidence of its expertise in this field.
Advanced analytics and reporting features, real-time monitoring and alerting, and a variety of tools for debugging and fixing network problems are all included in Netscout's CSP solutions. These solutions are specially designed to meet the particular difficulties that CSPs have, like the requirement to oversee and manage intricate, distributed networks and guarantee the calibre and dependability of services provided to clients.
4.2. Netscout nGeniusOne Customer Support
For the purpose of providing its clients with the tools and support they require to maximize the operation of their networks, Netscout GeniusOne provides a variety of customer care and support alternatives. Among Netscout nGeniusOne's principal customer service offerings are the following:
Technical help: Customers can get technical support from Netscout GeniusOne seven days a week, 24 hours a day. Clients can get in touch with Netscout by email, phone, or the online support site.
Training and certification: To assist clients in becoming proficient platform users, Netscout nGeniusOne provides training and certification programs. This offers alternatives for online and in-person instruction, as well as certification tests to verify skills and knowledge.
Expert services: Netscout GeniusOne provides a number of expert services to assist clients in making the most of the platform and resolving certain network performance issues. Performance evaluations, modification and integration support, and consulting services are all included in this.
Community and knowledge base: To assist users get the most out of the platform, Netscout GeniusOne maintains an online community and knowledge base where users can interact with one another, exchange best practices, and access a variety of resources.
Customer success: Netscout GeniusOne provides a number of tools to assist clients in reaching their network performance objectives. This includes continuous support, availability of Netscout's network of partners and industry professionals, and frequent platform updates and enhancements to meet changing customer needs.
In general, NetscoutGeniusOne's customer care programs are made to make sure that clients have access to the tools, knowledge, and assistance they require to effectively monitor and enhance the operation of their networks.
4.3. Netscout nGeniusOne User Interface


4.4 Netscout nGeniusOne User Reviews
"The fact that it's able to capture and store packets from the wires is very useful for troubleshooting with our vendors, when issues do come up."
"It reduces troubleshooting time because you can get a much better view into the communications path between servers, database servers, web servers, and understand what's going on."
4.5. Netscout Demo
5. Extrahop Revealx
Network detection and response is ExtraHop's area of expertise (NDR). Network traffic monitoring and analysis (NDR) is a class of security solutions that offers real-time network traffic monitoring and analysis to identify and address security risks and unusual activity.
Reveal(x), ExtraHop's NDR technology is made to give users total visibility into network activity, identify abnormalities and risks using sophisticated machine learning and behavioural analysis, and facilitate quick reactions to security problems. Numerous features and functionalities are available with the platform, such as automated incident response workflows, real-time network traffic analysis, and integration with other security platforms and tools. All that helps network admin to perform a complete network audit, especially from a security perspective.
ExtraHop provides application performance monitoring (APM) solutions in addition to NDR, which enable visibility and insights into the operation of IT systems and applications. The purpose of ExtraHop's APM solutions is to assist businesses in locating and resolving problems that could affect application performance and in enhancing infrastructure and application performance for improved user experiences.

5.1. Extrahop Revealx Positioning
Organizations may monitor and secure their IT environments with the help of ExtraHop Reveal(x), a network detection and response (NDR) platform. To give visibility and insights into network activity, identify risks and abnormalities, and react swiftly to security problems, the platform leverages machine learning and real-time network traffic analysis.
ExtraHop Reveal(x) provides many tools and services to assist businesses in strengthening their security posture, such as:
- Automatic discovery of devices and assets on the network
- Real-time monitoring of network traffic and behaviour
- Advanced threat detection using machine learning and behavioural analysis
- Automated response and investigation workflows
- Integration with third-party security tools and platforms
- Compliance reporting and auditing capabilities
- Application performance monitoring and troubleshooting tools
Overall, by offering real-time visibility into network activity, swiftly identifying risks and abnormalities, and facilitating quick response to security incidents, ExtraHop Reveal(x) is intended to assist enterprises in auditing their security posture and lowering the risk of data breaches and cyberattacks.
5.2. Extrahop Revealx Customer Services
To ensure that businesses get the most out of their network monitoring solutions, ExtraHop provides a variety of customer services.
Among their principal services for customers are:
Technical Support: To assist clients in troubleshooting and resolving difficulties with their network monitoring systems, ExtraHop offers technical support services. Together with access to online tools like a knowledge base, user forums, and video lessons, this also provides phone and email help.
Expert Services: To assist clients with the setup, adjustment, and personalization of their network monitoring systems, ExtraHop provides expert services. Project management services, instruction, and consultancy are all included in this.
Customer Success: In order to comprehend their business wants and assist them in reaching their network monitoring objectives, ExtraHop's customer success crew works together with clients. Regular check-ins, performance evaluations, and access to industry knowledge and best practices are all part of this.
Community: Customers, partners, and industry professionals make up the robust user community of ExtraHop. The community offers tools including user groups, forums, and events as well as a platform for cooperation, knowledge exchange, and assistance.
All things considered, ExtraHop is dedicated to offering its clients complete support and services that enable them to attain their business goals and optimize the value of their network monitoring solutions.
5.3. Extrahop Revealx User Interface


5.4. Extrahop Revealx User Reviews
"Overall, RevealX is easy to use and provides great visibility into the network."
"ExtraHOP provides great visibility for performance and security issues in our environment. Many of the detections, dashboards, and device groups provide easy starting points for learning to use extraHOP."
5.5. Extrahop Revealx Demo
6. Accedian Skylight
Accedian is a company that offers auditing and network performance monitoring solutions to businesses and communication service providers. The business was established in 2005, and it has offices all around the world in addition to its headquarters in Montreal, Canada. Customers may monitor, troubleshoot, and optimize the performance of their networks, apps, and services with the help of Accedian's products and services.
Virtualized network probes, network analytics tools, and network performance monitoring software are a few of the company's main products.
Accedian provides services to clients in a number of sectors, such as government, financial services, healthcare, and telecommunications.

6.1. Accedian Skylight Positioning
Accedian's Skylight is a real-time analytics and network and application performance monitoring tool. It offers comprehensive insight into the operation of on-premises, multi-cloud, and hybrid networks and applications, making it a perfect platform for auditing complex infrastructures. Skylight provides insights into the user experience, application performance, and network health by monitoring and analyzing the performance of network traffic and application transactions using advanced analytics, machine learning, and artificial intelligence approaches.
With its ability to swiftly detect and address problems, minimize downtime, and enhance user experience, Skylight is intended to assist enterprises in optimizing the performance of their networks and applications. The platform is offered as a software-based or virtualized solution and can be implemented on-premises, in the cloud, or as a hybrid solution. Many different network technologies and protocols, such as MPLS, Wi-Fi, 5G, and SD-WAN, are supported by Skylight. Businesses and service providers from a range of sectors, including financial services, healthcare, retail, and government, use the platform.
6.2. Accedian Skylight Customer Services
To make sure that their clients can efficiently use and maintain their network performance monitoring systems, Accedian provides a variety of customer services. Key client services provided by Accedian include some of the following:
Technical Support: If clients have any queries or problems with their network monitoring products, Accedian's technical support staff is here to help. Technical assistance is offered by Accedian via email, phone, and an online support portal. A range of service level agreements (SLAs) are provided to guarantee prompt and efficient support.
Training and Certification: To ensure that clients get the most out of their network monitoring solutions, Accedian provides training and certification programs. These courses cover subjects including product installation, configuration, and troubleshooting and come in both online and in-person formats.
Professional Services: To assist clients in making the most out of their network performance monitoring systems, Accedian provides a variety of professional services. These services include design and templates for network assessments, deployment, and installation, as well as continuing support and maintenance.
Customer Success Management: Accedian's team of customer success managers works closely with clients to make sure their network monitoring solutions are helping them achieve the intended business results. This entails proactive reporting and monitoring, frequent check-ins, and continuous optimization and improvement.
All things considered, the goal of Accedian's customer service is to make sure that clients are getting the most out of their investment by assisting them in efficiently utilizing and maintaining their network performance monitoring solutions.
6.3. Accedian Skylight User Interface


6.4. Accedian Skylight User Reviews
"As per my usage and observation this is one of the best monitoring and also helps to analysis application for network and its up/down traffic."
"Skylight excels in helping businesses manage their operations efficiently."
6.5. Accedian Skylight Demo
Empowering Businesses to Choose the Best Network Auditing Software
We hope this comprehensive guide has empowered you to navigate the ever-evolving world of network auditing software. Our mission was to equip businesses with the knowledge they need to make informed decisions when selecting the optimal tool for assessing their networks.
We categorized market-leading network monitoring solutions, presenting them in a user-friendly format. This included clear overviews, along with valuable resources like user interfaces, demos, and pricing information, allowing you to compare and contrast functionalities effectively.
Our commitment to impartiality stands out. This guide offers an unbiased list of network monitoring software solutions, free from any influence or vendor bias. We understand the prevalence of promotional content masquerading as reviews, and we prioritize providing neutral and factual information throughout this guide.
We acknowledge that selecting the right network monitoring tool can feel overwhelming. However, by leveraging the insights presented here, you are well-equipped to embark on your journey with confidence. This guide serves as a springboard, empowering you to make informed decisions and identify the network auditing solution that perfectly aligns with your unique needs.
If you're interested in learning more about network audits and assessments, feel free to try Obkio’s Network Monitoring & Network Auditing tool with a free 14-day trial! We're here to help and provide useful information, not to harass or push sales.
- 14-day free trial of all premium features
- Deploy in just 10 minutes
- Monitor performance in all key network locations
- Measure real-time network metrics
- Identify and troubleshoot live network problems

