Default Dashboard
- What is "My First Dashboard"
- What widgets are automatically included
What you are going to learn:
Overview 
"My First Dashboard" is the default dashboard automatically created when you set up a new Obkio account. It displays your initial monitoring configuration from the Onboarding Wizard, including your first agent, Public Agents, and key performance metrics.
The dashboard provides immediate visibility into your network performance without manual configuration. All widgets display real-time data from your first Monitoring Agent as soon as it’s deployed.
Default Dashboard Widgets
My First Dashboard includes several pre-configured widgets that display data from your initial monitoring setup:
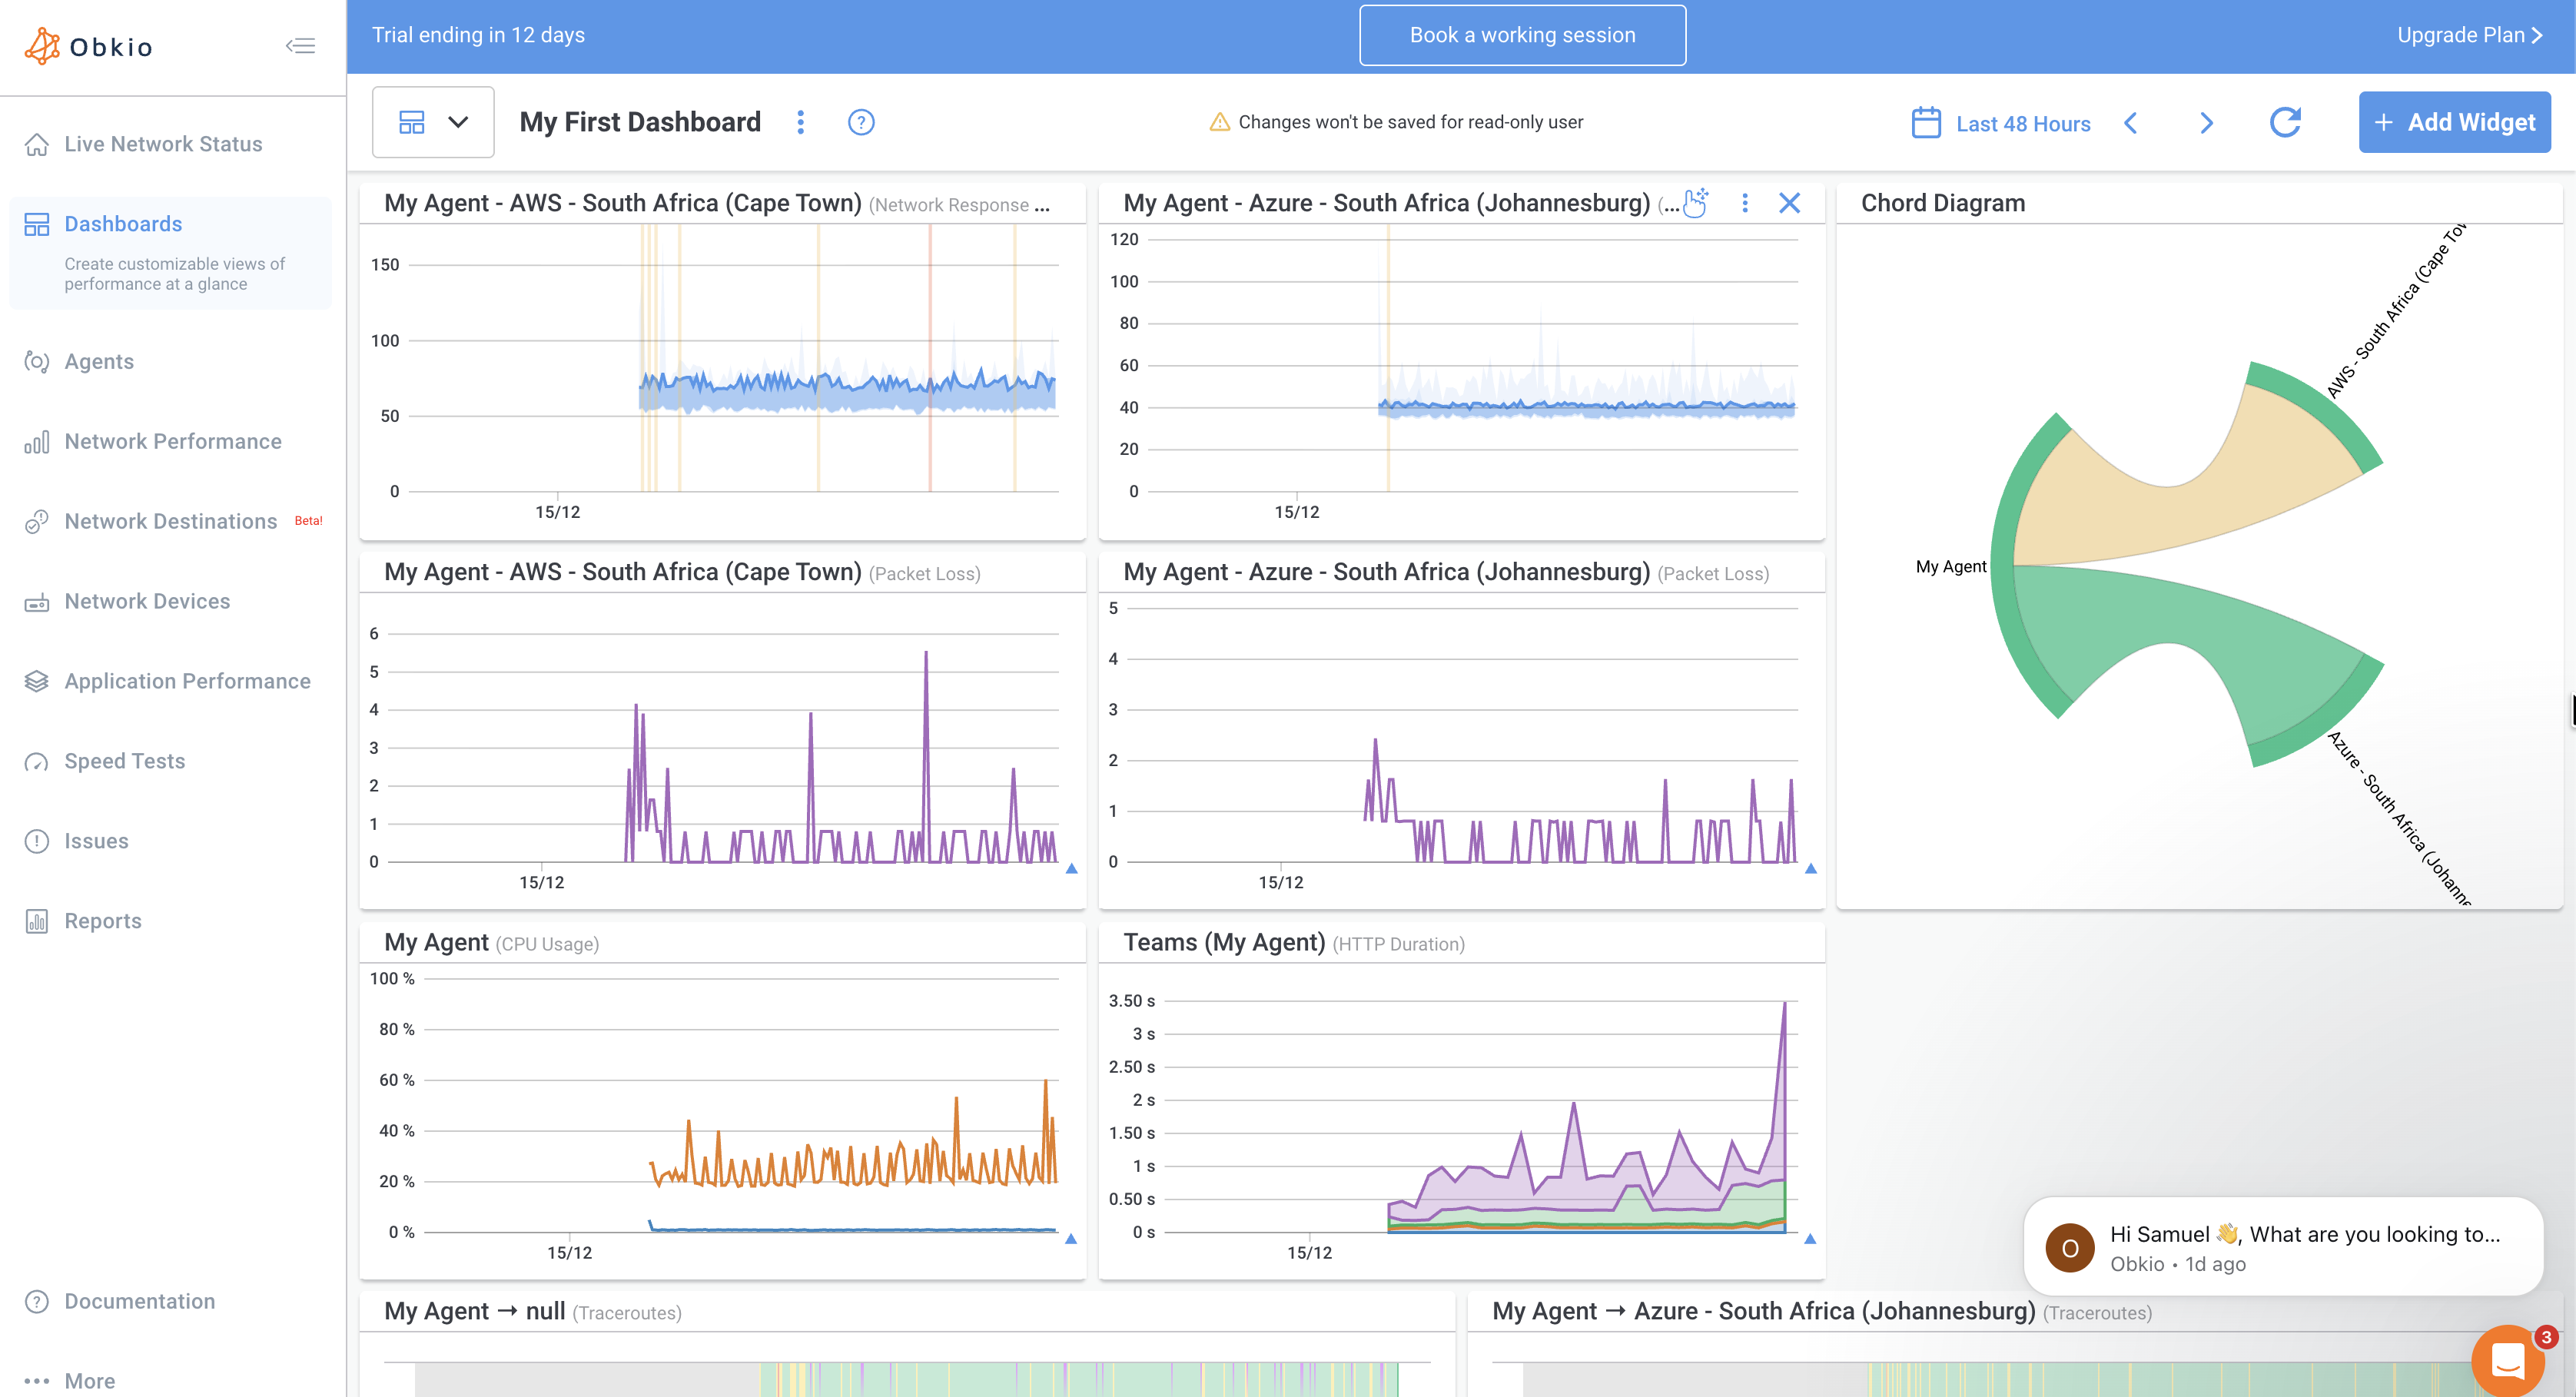
1. Chord Diagram
The Chord Diagram visualizes connections between your Monitoring Agents.
In a new account, the diagram shows:
- My Agent: Your first local Monitoring Agent installed during onboarding
- Public Agents: Two Public Monitoring Agents (AWS and Azure)
- Connection lines between agents representing active
monitoring sessions
Latency
Real-time latency graph over time
Shows:
- Minimum, average, and maximum latency values
- Percentile metrics (Median, P95, P99)
- Colour-coded quality indicators
Packet Loss
Displays packet loss percentage for active monitoring sessions.
Shows:
- Real-time packet loss graph over time
- Percentage values for the selected time period
Jitter
Displays jitter (latency variation) in milliseconds.
Shows:
- Real-time jitter graph over time
- Average jitter values with percentile metrics (Median, P95)
HTTP Duration
Displays HTTP request duration for Application Performance Monitoring tests.
Shows:
- Response time for HTTP requests
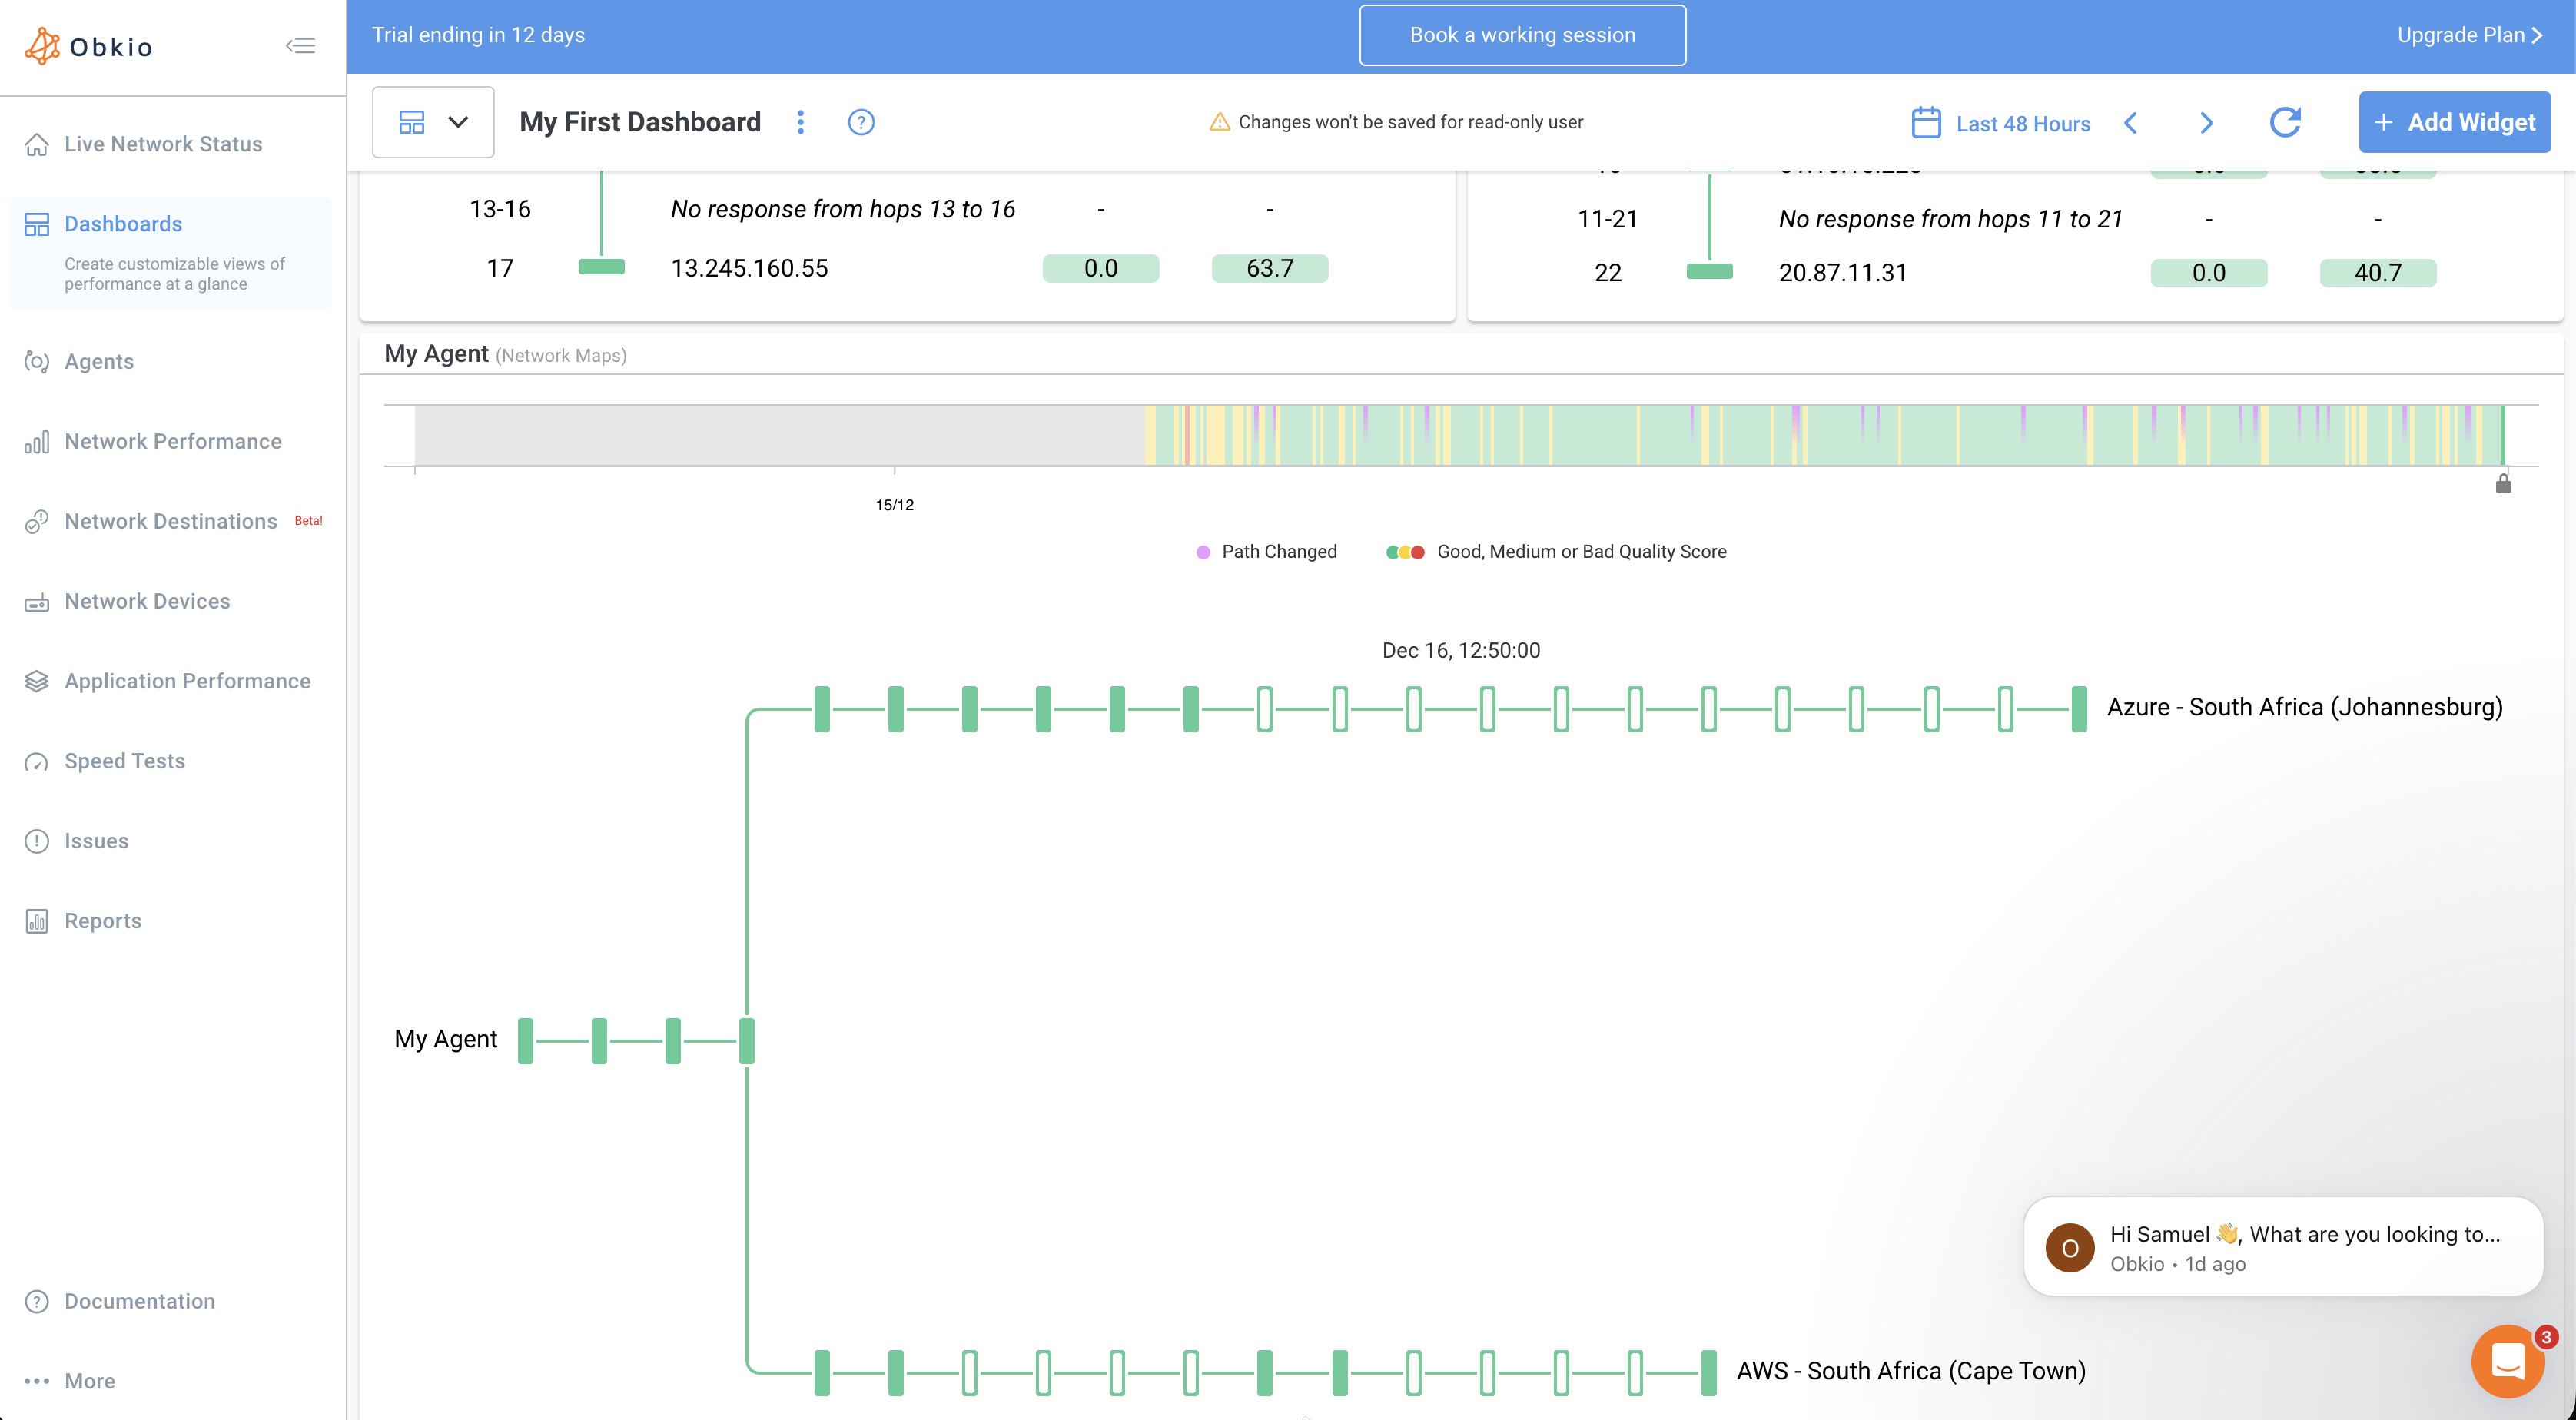
Visual Traceroutes
Visual Traceroute widgets provide immediate visibility into your network paths without manual configuration.
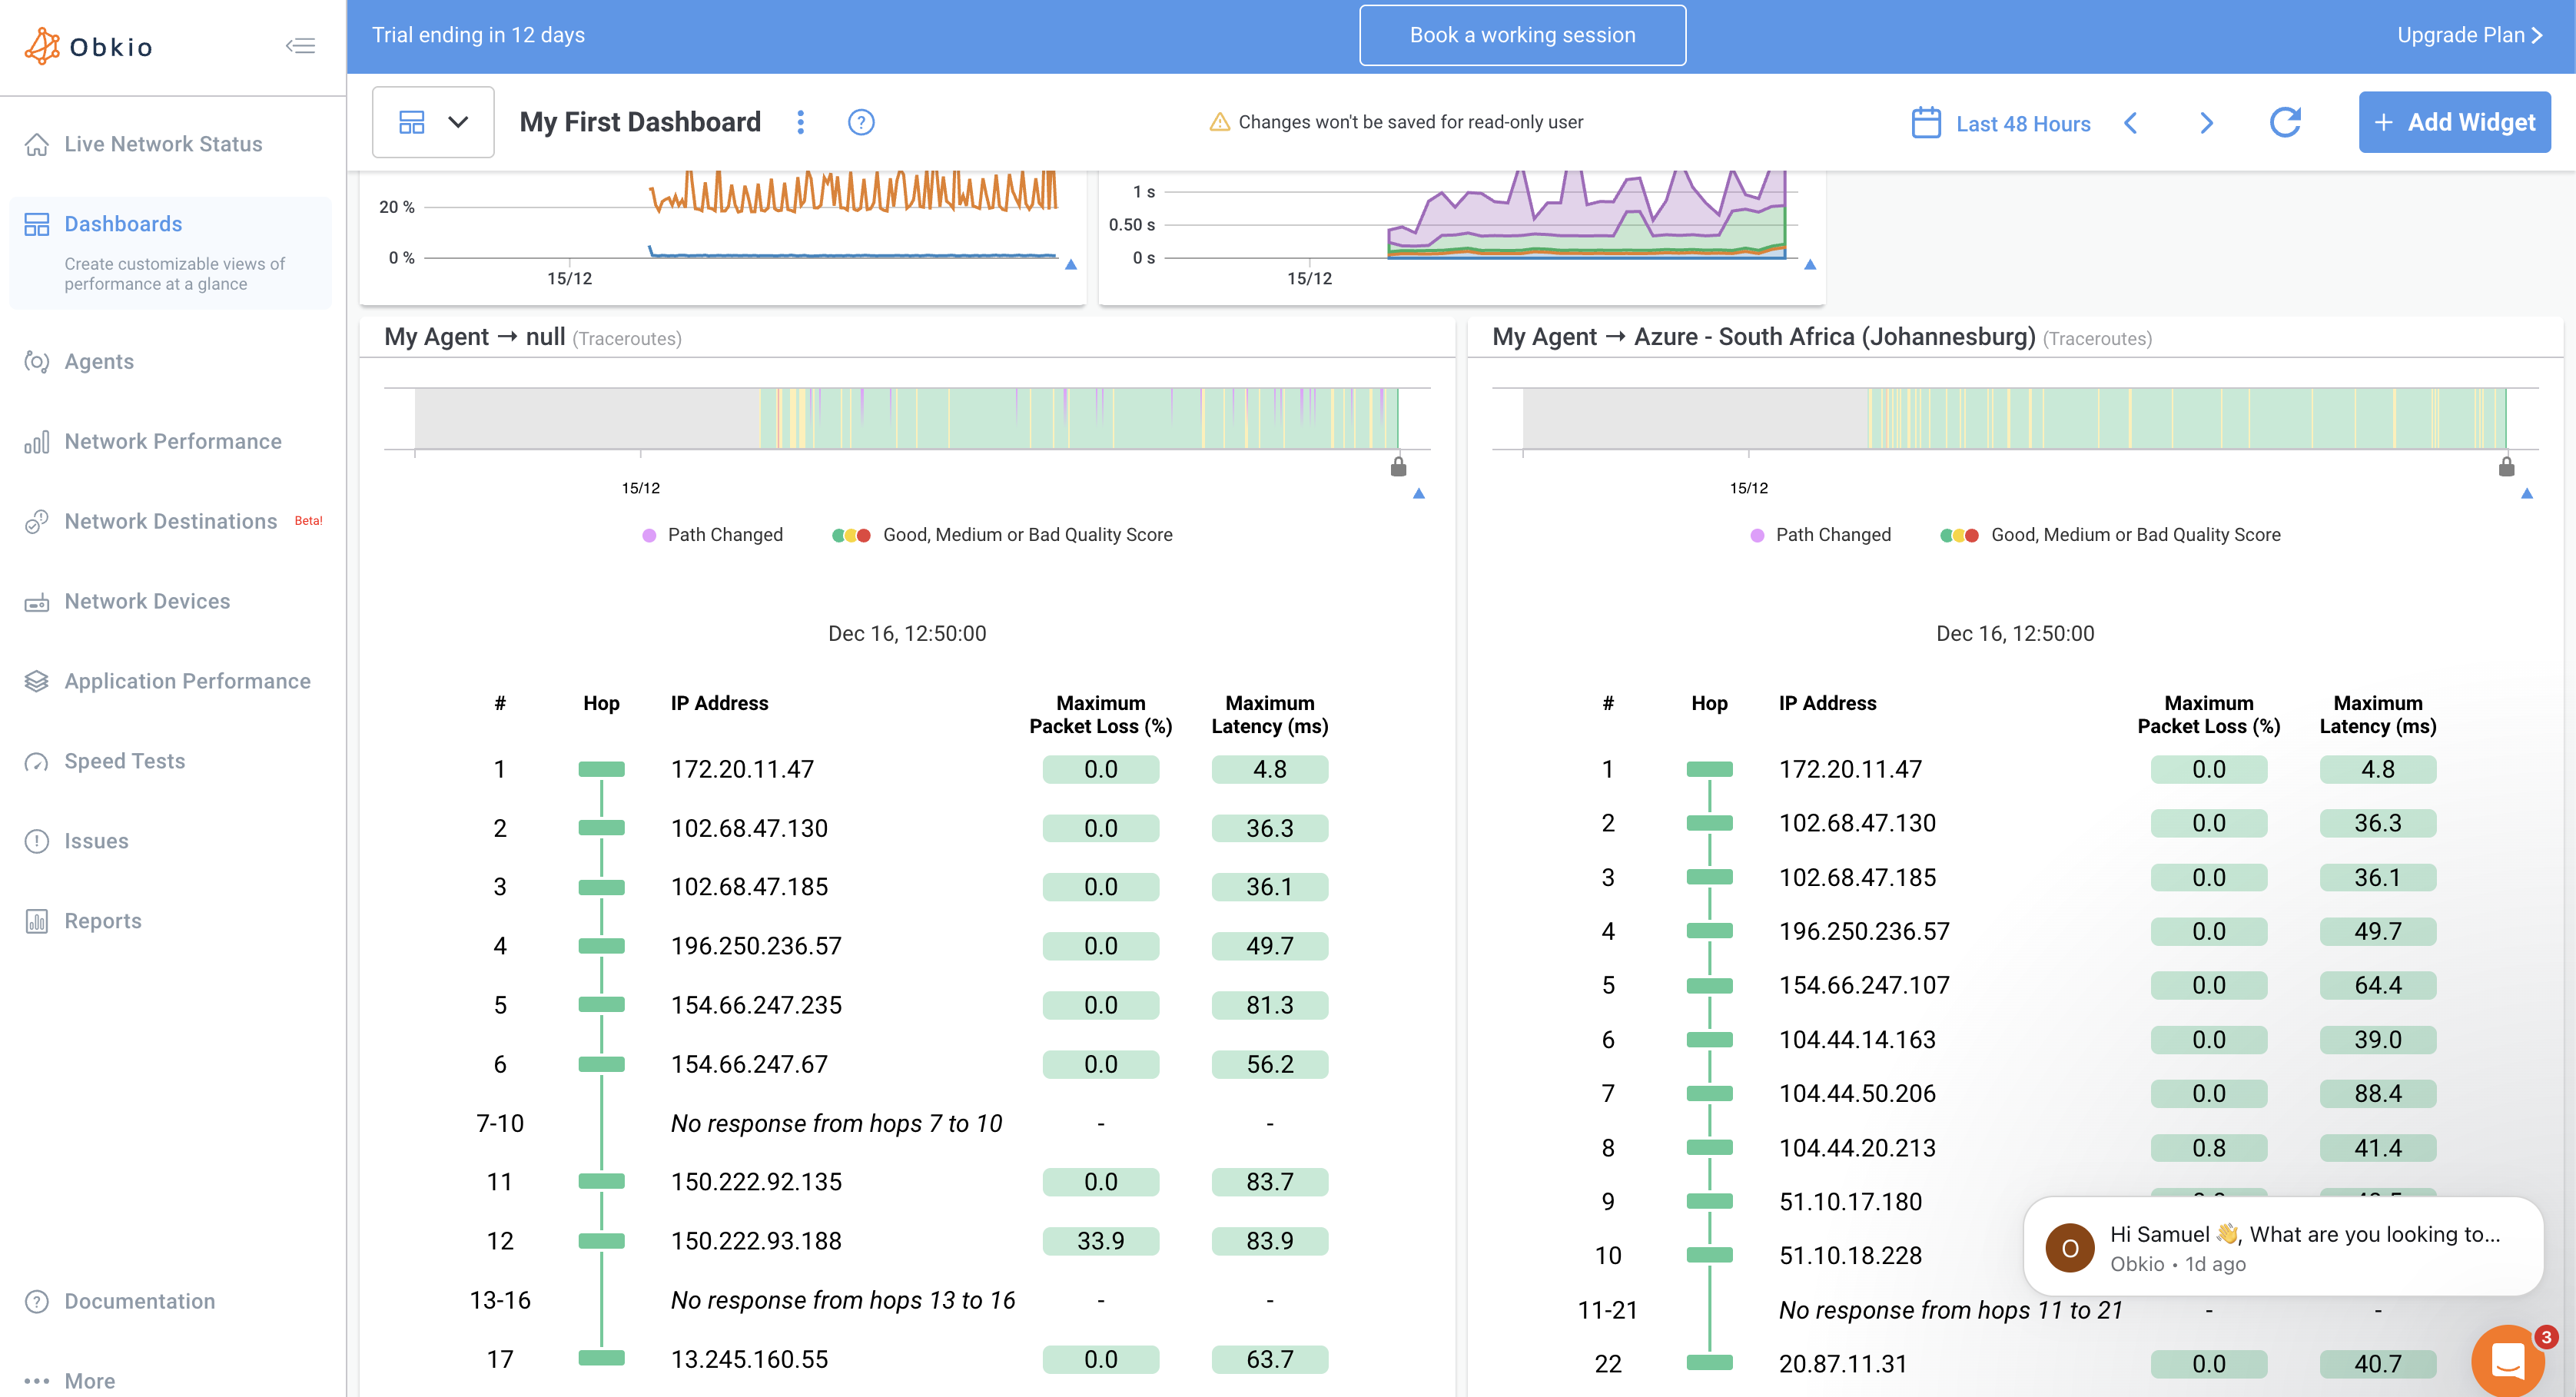
The default dashboard includes:
- Traceroute widget showing hop-by-hop path and metrics over time
- Network Map widget displaying visual path representation